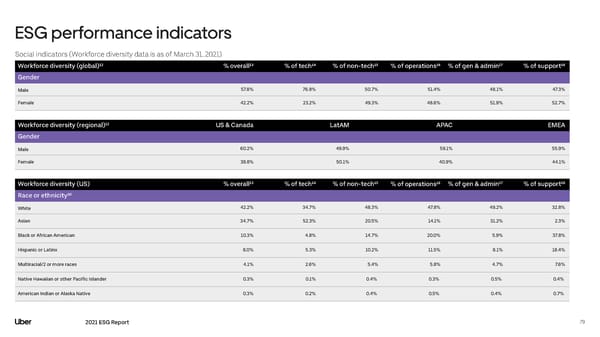
ESG performance indicators Social indicators (Workforce diversity data is as of March 31, 2021) Workforce diversity (global)¹² % overall¹³ % of tech¹⁴ % of non-tech¹⁵ % of operations¹⁶ % of gen & admin¹⁷ % of support¹⁸ Gender Male 57.8% 76.8% 50.7% 51.4% 48.1% 47.3% Female 42.2% 23.2% 49.3% 48.6% 51.9% 52.7% Workforce diversity (regional)¹² US & Canada LatAM APAC EMEA Gender Male 60.2% 49.9% 59.1% 55.9% Female 39.8% 50.1% 40.9% 44.1% Workforce diversity (US) % overall¹³ % of tech¹⁴ % of non-tech¹⁵ % of operations¹⁶ % of gen & admin¹⁷ % of support¹⁸ Race or ethnicity²⁰ White 42.2% 34.7% 48.3% 47.8% 49.2% 32.8% Asian 34.7% 52.3% 20.5% 14.1% 31.2% 2.3% Black or African American 10.3% 4.8% 14.7% 20.0% 5.9% 37.8% Hispanic or Latinx 8.0% 5.3% 10.2% 11.5% 8.1% 18.4% Multiracial/2 or more races 4.1% 2.6% 5.4% 5.8% 4.7% 7.6% Native Hawaiian or other Pacific Islander 0.3% 0.1% 0.4% 0.3% 0.5% 0.4% American Indian or Alaska Native 0.3% 0.2% 0.4% 0.5% 0.4% 0.7% 2021 ESG Report 79
 Uber ESG Report Page 78 Page 80