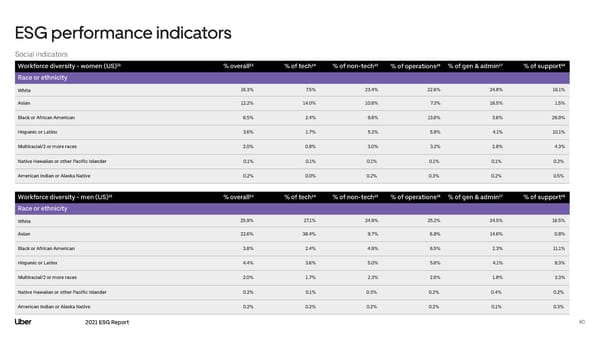
ESG performance indicators Social indicators Workforce diversity - women (US)²¹ % overall¹³ % of tech¹⁴ % of non-tech¹⁵ % of operations¹⁶ % of gen & admin¹⁷ % of support¹⁸ Race or ethnicity White 16.3% 7.5% 23.4% 22.6% 24.8% 16.1% Asian 12.2% 14.0% 10.8% 7.3% 16.5% 1.5% Black or African American 6.5% 2.4% 9.8% 13.6% 3.6% 26.9% Hispanic or Latinx 3.6% 1.7% 5.2% 5.9% 4.1% 10.1% Multiracial/2 or more races 2.0% 0.8% 3.0% 3.2% 2.8% 4.3% Native Hawaiian or other Pacific Islander 0.1% 0.1% 0.1% 0.1% 0.1% 0.2% American Indian or Alaska Native 0.2% 0.0% 0.2% 0.3% 0.2% 0.5% Workforce diversity - men (US)²¹ % overall¹³ % of tech¹⁴ % of non-tech¹⁵ % of operations¹⁶ % of gen & admin¹⁷ % of support¹⁸ Race or ethnicity White 25.9% 27.1% 24.9% 25.2% 24.5% 16.5% Asian 22.6% 38.4% 9.7% 6.8% 14.6% 0.8% Black or African American 3.8% 2.4% 4.9% 6.5% 2.3% 11.1% Hispanic or Latinx 4.4% 3.6% 5.0% 5.6% 4.1% 8.3% Multiracial/2 or more races 2.0% 1.7% 2.3% 2.6% 1.8% 3.3% Native Hawaiian or other Pacific Islander 0.2% 0.1% 0.3% 0.2% 0.4% 0.2% American Indian or Alaska Native 0.2% 0.2% 0.2% 0.2% 0.1% 0.3% 2021 ESG Report 80
 Uber ESG Report Page 79 Page 81