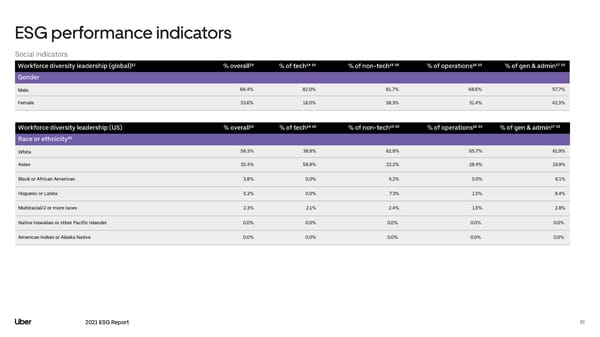
ESG performance indicators Social indicators Workforce diversity leadership (global)¹² % overall¹⁹ % of tech¹⁴ ¹⁹ % of non-tech¹⁵ ¹⁹ % of operations¹⁶ ¹⁹ % of gen & admin¹⁷ ¹⁹ Gender Male 66.4% 82.0% 61.7% 68.6% 57.7% Female 33.6% 18.0% 38.3% 31.4% 42.3% Workforce diversity leadership (US) % overall¹⁹ % of tech¹⁴ ¹⁹ % of non-tech¹⁵ ¹⁹ % of operations¹⁶ ¹⁹ % of gen & admin¹⁷ ¹⁹ Race or ethnicity²⁰ White 56.3% 38.9% 62.9% 65.7% 61.9% Asian 32.4% 58.9% 22.2% 28.4% 19.9% Black or African American 3.8% 0.0% 5.2% 3.0% 6.1% Hispanic or Latinx 5.2% 0.0% 7.3% 1.5% 9.4% Multiracial/2 or more races 2.3% 2.1% 2.4% 1.5% 2.8% Native Hawaiian or other Pacific Islander 0.0% 0.0% 0.0% 0.0% 0.0% American Indian or Alaska Native 0.0% 0.0% 0.0% 0.0% 0.0% 2021 ESG Report 81
 Uber ESG Report Page 80 Page 82