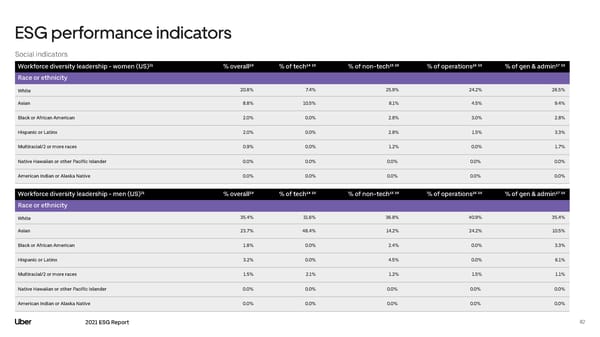
ESG performance indicators Social indicators Workforce diversity leadership - women (US)²¹ % overall¹⁹ % of tech¹⁴ ¹⁹ % of non-tech¹⁵ ¹⁹ % of operations¹⁶ ¹⁹ % of gen & admin¹⁷ ¹⁹ Race or ethnicity White 20.8% 7.4% 25.9% 24.2% 26.5% Asian 8.8% 10.5% 8.1% 4.5% 9.4% Black or African American 2.0% 0.0% 2.8% 3.0% 2.8% Hispanic or Latinx 2.0% 0.0% 2.8% 1.5% 3.3% Multiracial/2 or more races 0.9% 0.0% 1.2% 0.0% 1.7% Native Hawaiian or other Pacific Islander 0.0% 0.0% 0.0% 0.0% 0.0% American Indian or Alaska Native 0.0% 0.0% 0.0% 0.0% 0.0% Workforce diversity leadership - men (US)²¹ % overall¹⁹ % of tech¹⁴ ¹⁹ % of non-tech¹⁵ ¹⁹ % of operations¹⁶ ¹⁹ % of gen & admin¹⁷ ¹⁹ Race or ethnicity White 35.4% 31.6% 36.8% 40.9% 35.4% Asian 23.7% 48.4% 14.2% 24.2% 10.5% Black or African American 1.8% 0.0% 2.4% 0.0% 3.3% Hispanic or Latinx 3.2% 0.0% 4.5% 0.0% 6.1% Multiracial/2 or more races 1.5% 2.1% 1.2% 1.5% 1.1% Native Hawaiian or other Pacific Islander 0.0% 0.0% 0.0% 0.0% 0.0% American Indian or Alaska Native 0.0% 0.0% 0.0% 0.0% 0.0% 2021 ESG Report 82
 Uber ESG Report Page 81 Page 83