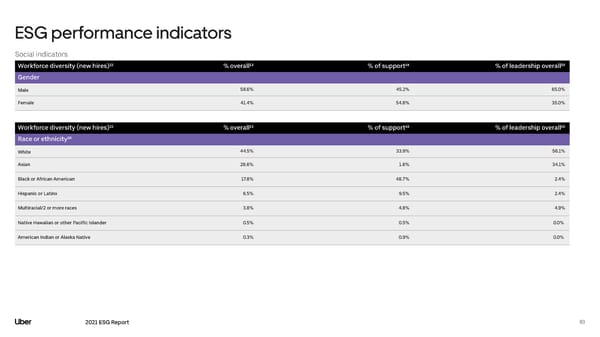
ESG performance indicators Social indicators Workforce diversity (new hires)²² % overall¹³ % of support¹⁸ % of leadership overall¹⁹ Gender Male 58.6% 45.2% 65.0% Female 41.4% 54.8% 35.0% Workforce diversity (new hires)²² % overall¹³ % of support¹⁸ % of leadership overall¹⁹ Race or ethnicity²⁰ White 44.5% 33.9% 56.1% Asian 26.6% 1.6% 34.1% Black or African American 17.8% 48.7% 2.4% Hispanic or Latinx 6.5% 9.5% 2.4% Multiracial/2 or more races 3.8% 4.8% 4.9% Native Hawaiian or other Pacific Islander 0.5% 0.5% 0.0% American Indian or Alaska Native 0.3% 0.9% 0.0% 2021 ESG Report 83
 Uber ESG Report Page 82 Page 84