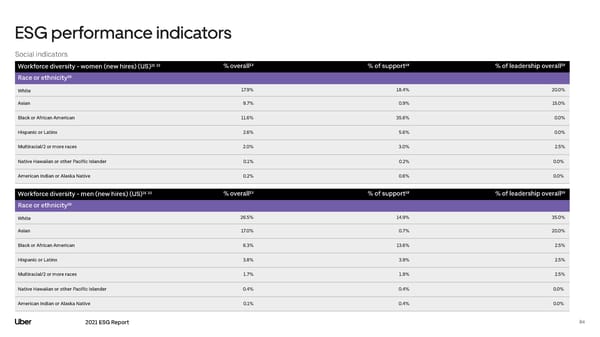
ESG performance indicators Social indicators Workforce diversity - women (new hires) (US)²¹ ²² % overall¹³ % of support¹⁸ % of leadership overall¹⁹ Race or ethnicity²⁰ White 17.9% 18.4% 20.0% Asian 9.7% 0.9% 15.0% Black or African American 11.6% 35.6% 0.0% Hispanic or Latinx 2.6% 5.6% 0.0% Multiracial/2 or more races 2.0% 3.0% 2.5% Native Hawaiian or other Pacific Islander 0.1% 0.2% 0.0% American Indian or Alaska Native 0.2% 0.6% 0.0% Workforce diversity - men (new hires) (US)²¹ ²² % overall¹³ % of support¹⁸ % of leadership overall¹⁹ Race or ethnicity²⁰ White 26.5% 14.9% 35.0% Asian 17.0% 0.7% 20.0% Black or African American 6.3% 13.6% 2.5% Hispanic or Latinx 3.8% 3.9% 2.5% Multiracial/2 or more races 1.7% 1.9% 2.5% Native Hawaiian or other Pacific Islander 0.4% 0.4% 0.0% American Indian or Alaska Native 0.1% 0.4% 0.0% 2021 ESG Report 84
 Uber ESG Report Page 83 Page 85