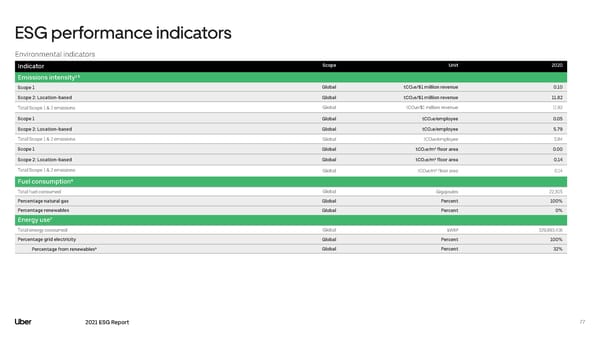
ESG performance indicators Environmental indicators Indicator Scope Unit 2020 Emissions intensity²⁵ Scope 1 Global tCO₂e/$1 million revenue 0.10 Scope 2: Location-based Global tCO₂e/$1 million revenue 11.82 Total Scope 1 & 2 emissions Global tCO₂e/$1 million revenue 11.92 Scope 1 Global tCO₂e/employee 0.05 Scope 2: Location-based Global tCO₂e/employee 5.79 Total Scope 1 & 2 emissions Global tCO₂e/employee 5.84 Scope 1 Global tCO₂e/m² floor area 0.00 Scope 2: Location-based Global tCO₂e/m² floor area 0.14 Total Scope 1 & 2 emissions Global tCO₂e/m² floor area 0.14 Fuel consumption⁶ Total fuel consumed Global Gigajoules 22,305 Percentage natural gas Global Percent 100% Percentage renewables Global Percent 0% Energy use⁷ Total energy consumed Global kWh⁸ 329,893,416 Percentage grid electricity Global Percent 100% Percentage from renewables⁹ Global Percent 32% 2021 ESG Report 77
 Uber ESG Report Page 76 Page 78