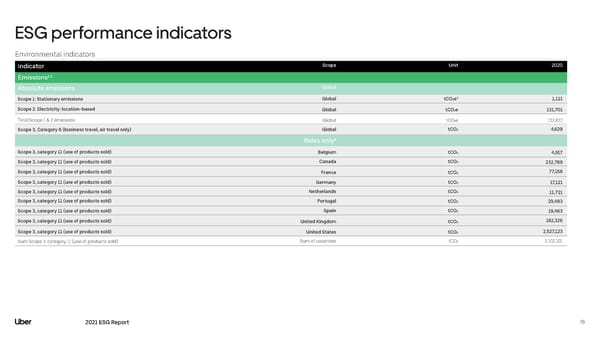
ESG performance indicators Environmental indicators Indicator Scope Unit 2020 Emissions¹² Absolute emissions Global Scope 1: Stationary emissions Global tCO₂e³ 1,121 Scope 2: Electricity: location-based Global tCO₂e 131,701 Total Scope 1 & 2 emissions Global tCO₂e 132,822 Scope 3, Category 6 (business travel, air travel only) Global tCO₂ 4,629 Rides only⁴ Scope 3, category 11 (use of products sold) Belgium tCO₂ 4,917 Scope 3, category 11 (use of products sold) Canada tCO₂ 232,789 Scope 3, category 11 (use of products sold) France tCO₂ 77,158 Scope 3, category 11 (use of products sold) Germany tCO₂ 17,121 Scope 3, category 11 (use of products sold) Netherlands tCO₂ 11,721 Scope 3, category 11 (use of products sold) Portugal tCO₂ 29,483 Scope 3, category 11 (use of products sold) Spain tCO₂ 19,463 Scope 3, category 11 (use of products sold) United Kingdom tCO₂ 182,326 Scope 3, category 11 (use of products sold) United States tCO₂ 2,527,123 Sum Scope 3, category 11 (use of products sold) Sum of countries tCO₂ 3,102,101 2021 ESG Report 76
 Uber ESG Report Page 75 Page 77