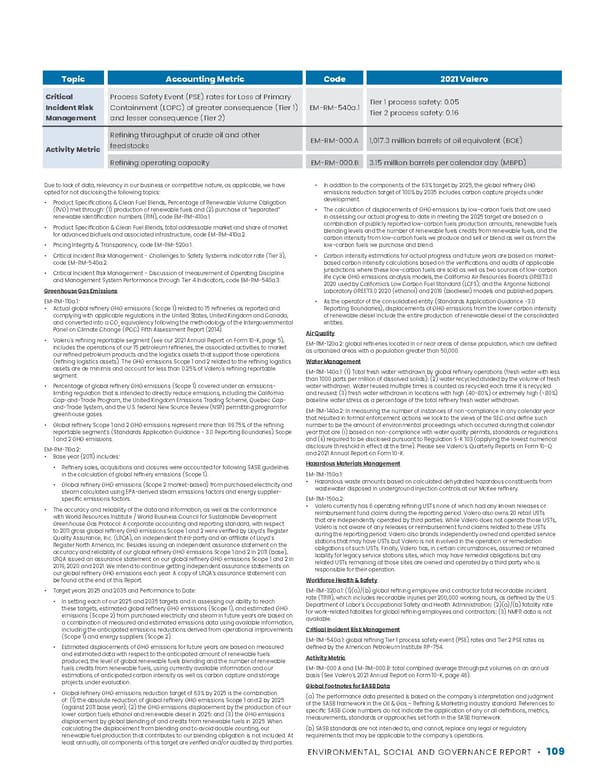
ENVIRONMENTAL, SOCIAL AND GOVERNANCE REPORT • 109 Topic Accounting Metric Code 2021 Valero Critical Incident Risk Management Process Safety Event (PSE) rates for Loss of Primary Containment (LOPC) of greater consequence (Tier 1) and lesser consequence (Tier 2) EM-RM-540a.1 Tier 1 process safety: 0.05 Tier 2 process safety: 0.16 Activity Metric Refining throughput of crude oil and other feedstocks EM-RM-000.A 1,017.3 million barrels of oil equivalent (BOE) Refining operating capacity EM-RM-000.B 3.15 million barrels per calendar day (MBPD) Due to lack of data, relevancy in our business or competitive nature, as applicable, we have opted for not disclosing the following topics: • Product Specifications & Clean Fuel Blends, Percentage of Renewable Volume Obligation (RVO) met through: (1) production of renewable fuels and (2) purchase of “separated” renewable identification numbers (RIN), code EM-RM-410a.1. • Product Specification & Clean Fuel Blends, total addressable market and share of market for advanced biofuels and associated infrastructure, code EM-RM-410a.2. • Pricing Integrity & Transparency, code EM-RM-520a.1. • Critical Incident Risk Management - Challenges to Safety Systems indicator rate (Tier 3), code EM-RM-540a.2. • Critical Incident Risk Management - Discussion of measurement of Operating Discipline and Management System Performance through Tier 4 Indicators, code EM-RM-540a.3. Greenhouse Gas Emissions EM-RM-110a.1: • Actual global refinery GHG emissions (Scope 1) related to 15 refineries as reported and complying with applicable regulations in the United States, United Kingdom and Canada, and converted into a CO 2 equivalency following the methodology of the Intergovernmental Panel on Climate Change (IPCC) Fifth Assessment Report (2014). • Valero’s refining reportable segment (see our 2021 Annual Report on Form 10-K, page 5), includes the operations of our 15 petroleum refineries, the associated activities to market our refined petroleum products and the logistics assets that support those operations (refining logistics assets). The GHG emissions Scope 1 and 2 related to the refining logistics assets are de minimis and account for less than 0.25% of Valero's refining reportable segment. • Percentage of global refinery GHG emissions (Scope 1) covered under an emissions- limiting regulation that is intended to directly reduce emissions, including the California Cap-and-Trade Program, the United Kingdom Emissions Trading Scheme, Quebec Cap- and-Trade System, and the U.S. federal New Source Review (NSR) permitting program for greenhouse gases. • Global refinery Scope 1 and 2 GHG emissions represent more than 99.75% of the refining reportable segment’s (Standards Application Guidance - 3.0 Reporting Boundaries) Scope 1 and 2 GHG emissions. EM-RM-110a.2: • Base year (2011) includes: • Refinery sales, acquisitions and closures were accounted for following SASB guidelines in the calculation of global refinery emissions (Scope 1). • Global refinery GHG emissions (Scope 2 market-based) from purchased electricity and steam calculated using EPA-derived steam emissions factors and energy supplier- specific emissions factors. • The accuracy and reliability of the data and information, as well as the conformance with World Resources Institute / World Business Council for Sustainable Development Greenhouse Gas Protocol: A corporate accounting and reporting standard, with respect to 2011 gross global refinery GHG emissions Scope 1 and 2 were verified by Lloyd’s Register Quality Assurance, Inc. (LRQA), an independent third-party and an affiliate of Lloyd’s Register North America, Inc. Besides issuing an independent assurance statement on the accuracy and reliability of our global refinery GHG emissions Scope 1 and 2 in 2011 (base), LRQA issued an assurance statement on our global refinery GHG emissions Scope 1 and 2 in 2019, 2020 and 2021. We intend to continue getting independent assurance statements on our global refinery GHG emissions each year. A copy of LRQA’s assurance statement can be found at the end of this Report. • Target years 2025 and 2035 and Performance to Date: • In setting each of our 2025 and 2035 targets and in assessing our ability to reach these targets, estimated global refinery GHG emissions (Scope 1), and estimated GHG emissions (Scope 2) from purchased electricity and steam in future years are based on a combination of measured and estimated emissions data using available information, including the anticipated emissions reductions derived from operational improvements (Scope 1) and energy suppliers (Scope 2). • Estimated displacements of GHG emissions for future years are based on measured and estimated data with respect to the anticipated amount of renewable fuels produced, the level of global renewable fuels blending and the number of renewable fuels credits from renewable fuels, using currently available information and our estimations of anticipated carbon intensity as well as carbon capture and storage projects under evaluation. • Global refinery GHG emissions reduction target of 63% by 2025 is the combination of: (1) the absolute reduction of global refinery GHG emissions Scope 1 and 2 by 2025 (against 2011 base year); (2) the GHG emissions displacement by the production of our lower carbon fuels ethanol and renewable diesel in 2025; and (3) the GHG emissions displacement by global blending of and credits from renewable fuels in 2025. When calculating the displacement from blending and to avoid double counting, our renewable fuel production that contributes to our blending obligation is not included. At least annually, all components of this target are verified and/or audited by third parties. • In addition to the components of the 63% target by 2025, the global refinery GHG emissions reduction target of 100% by 2035 includes carbon capture projects under development. • The calculation of displacements of GHG emissions by low-carbon fuels that are used in assessing our actual progress to date in meeting the 2025 target are based on a combination of publicly reported low-carbon fuels production amounts, renewable fuels blending levels and the number of renewable fuels credits from renewable fuels, and the carbon intensity from low-carbon fuels we produce and sell or blend as well as from the low-carbon fuels we purchase and blend. • Carbon intensity estimations for actual progress and future years are based on market- based carbon intensity calculations based on the verifications and audits of applicable jurisdictions where these low-carbon fuels are sold as well as two sources of low-carbon life cycle GHG emissions analysis models, the California Air Resources Board’s GREET3.0 2020 used by California’s Low Carbon Fuel Standard (LCFS); and the Argonne National Laboratory GREET3.0 2020 (ethanol) and 2019 (biodiesel) models and published papers. • As the operator of the consolidated entity (Standards Application Guidance -3.0 Reporting Boundaries), displacements of GHG emissions from the lower carbon intensity of renewable diesel include the entire production of renewable diesel of the consolidated entities. Air Quality EM-RM-120a.2: global refineries located in or near areas of dense population, which are defined as urbanized areas with a population greater than 50,000. Water Management EM-RM-140a.1: (1) Total fresh water withdrawn by global refinery operations (fresh water with less than 1000 parts per million of dissolved solids); (2) water recycled divided by the volume of fresh water withdrawn. Water reused multiple times is counted as recycled each time it is recycled and reused; (3) fresh water withdrawn in locations with high (40-80%) or extremely high (>80%) baseline water stress as a percentage of the total refinery fresh water withdrawn. EM-RM-140a.2: In measuring the number of instances of non-compliance in any calendar year that resulted in formal enforcement actions we look to the views of the SEC and define such number to be the amount of environmental proceedings which occurred during that calendar year that are (i) based on non-compliance with water quality permits, standards or regulations and (ii) required to be disclosed pursuant to Regulation S-K 103 (applying the lowest numerical disclosure threshold in effect at the time). Please see Valero’s Quarterly Reports on Form 10-Q and 2021 Annual Report on Form 10-K. Hazardous Materials Management EM-RM-150a.1: • Hazardous waste amounts based on calculated dehydrated hazardous constituents from wastewater disposed in underground injection controls at our McKee refinery. EM-RM-150a.2: • Valero currently has 6 operating refining USTs none of which had any known releases or reimbursement fund claims during the reporting period. Valero also owns 20 retail USTs that are independently operated by third parties. While Valero does not operate those USTs, Valero is not aware of any releases or reimbursement fund claims related to these USTs during the reporting period. Valero also brands independently owned and operated service stations that may have USTs but Valero is not involved in the operation or remediation obligations of such USTs. Finally, Valero has, in certain circumstances, assumed or retained liability for legacy service stations sites, which may have remedial obligations but any related USTs remaining at those sites are owned and operated by a third party who is responsible for their operation. Workforce Health & Safety EM-RM-320a.1: (1)(a)/(b) global refining employee and contractor total recordable incident rate (TRIR), which includes recordable injuries per 200,000 working hours, as defined by the U.S. Department of Labor’s Occupational Safety and Health Administration; (2)(a)/(b) fatality rate for work-related fatalities for global refining employees and contractors; (3) NMFR data is not available. Critical Incident Risk Management EM-RM-540a.1: global refining Tier 1 process safety event (PSE) rates and Tier 2 PSE rates as defined by the American Petroleum Institute RP-754. Activity Metric EM-RM-000.A and EM-RM-000.B: total combined average throughput volumes on an annual basis (See Valero’s 2021 Annual Report on Form 10-K, page 46). Global Footnotes for SASB Data (a) The performance data presented is based on the company’s interpretation and judgment of the SASB framework in the Oil & Gas – Refining & Marketing industry standard. References to specific SASB Code numbers do not indicate the application of any or all definitions, metrics, measurements, standards or approaches set forth in the SASB framework. (b) SASB standards are not intended to, and cannot, replace any legal or regulatory requirements that may be applicable to the company’s operations.
 Valero ESG Report Page 108 Page 110