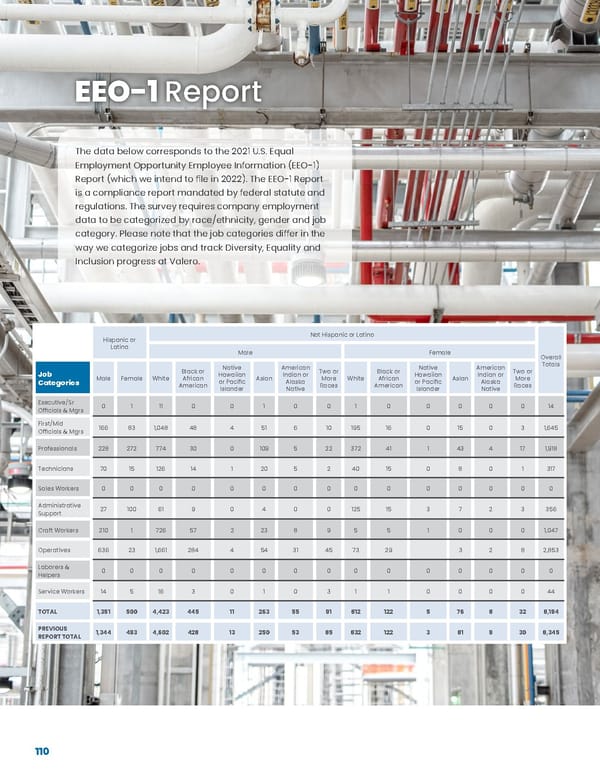
110 Hispanic or Latino Not Hispanic or Latino Overall Totals Male Female Job Categories Male Female White Black or African American Native Hawaiian or Pacific Islander Asian American Indian or Alaska Native Two or More Races White Black or African American Native Hawaiian or Pacific Islander Asian American Indian or Alaska Native Two or More Races Executive/Sr Officials & Mgrs 0 1 11 0 0 1 0 0 1 0 0 0 0 0 14 First/Mid Officials & Mgrs 166 83 1,048 48 4 51 6 10 195 16 0 15 0 3 1,645 Professionals 228 272 774 30 0 109 5 22 372 41 1 43 4 17 1,918 Technicians 70 15 126 14 1 20 5 2 40 15 0 8 0 1 317 Sales Workers 0 0 0 0 0 0 0 0 0 0 0 0 0 0 0 Administrative Support 27 100 61 9 0 4 0 0 125 15 3 7 2 3 356 Craft Workers 210 1 726 57 2 23 8 9 5 5 1 0 0 0 1,047 Operatives 636 23 1,661 284 4 54 31 45 73 29 3 2 8 2,853 Laborers & Helpers 0 0 0 0 0 0 0 0 0 0 0 0 0 0 0 Service Workers 14 5 16 3 0 1 0 3 1 1 0 0 0 0 44 TOTAL 1,351 500 4,423 445 11 263 55 91 812 122 5 76 8 32 8,194 PREVIOUS REPORT TOTAL 1,344 493 4,602 428 13 250 53 85 832 122 3 81 9 30 8,345 The data below corresponds to the 2021 U.S. Equal Employment Opportunity Employee Information (EEO-1) Report (which we intend to file in 2022). The EEO-1 Report is a compliance report mandated by federal statute and regulations. The survey requires company employment data to be categorized by race/ethnicity, gender and job category. Please note that the job categories differ in the way we categorize jobs and track Diversity, Equality and Inclusion progress at Valero. EEO-1 Report
 Valero ESG Report Page 109 Page 111