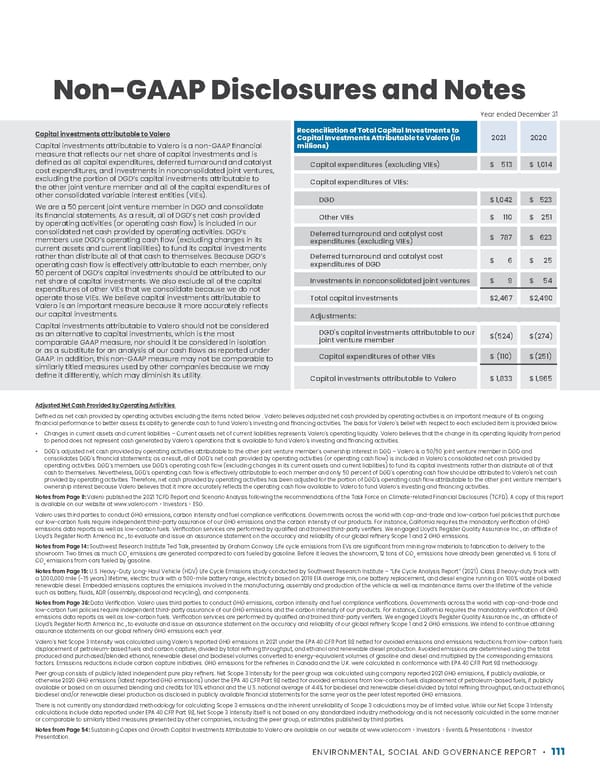
ENVIRONMENTAL, SOCIAL AND GOVERNANCE REPORT • 111 Capital investments attributable to Valero Capital investments attributable to Valero is a non-GAAP financial measure that reflects our net share of capital investments and is defined as all capital expenditures, deferred turnaround and catalyst cost expenditures, and investments in nonconsolidated joint ventures, excluding the portion of DGD’s capital investments attributable to the other joint venture member and all of the capital expenditures of other consolidated variable interest entities (VIEs). We are a 50 percent joint venture member in DGD and consolidate its financial statements. As a result, all of DGD’s net cash provided by operating activities (or operating cash flow) is included in our consolidated net cash provided by operating activities. DGD’s members use DGD’s operating cash flow (excluding changes in its current assets and current liabilities) to fund its capital investments rather than distribute all of that cash to themselves. Because DGD’s operating cash flow is effectively attributable to each member, only 50 percent of DGD’s capital investments should be attributed to our net share of capital investments. We also exclude all of the capital expenditures of other VIEs that we consolidate because we do not operate those VIEs. We believe capital investments attributable to Valero is an important measure because it more accurately reflects our capital investments. Capital investments attributable to Valero should not be considered as an alternative to capital investments, which is the most comparable GAAP measure, nor should it be considered in isolation or as a substitute for an analysis of our cash flows as reported under GAAP. In addition, this non-GAAP measure may not be comparable to similarly titled measures used by other companies because we may define it differently, which may diminish its utility. Reconciliation of Total Capital Investments to Capital Investments Attributable to Valero (in millions) 2021 2020 Capital expenditures (excluding VIEs) $ 513 $ 1,014 Capital expenditures of VIEs: DGD $ 1,042 $ 523 Other VIEs $ 110 $ 251 Deferred turnaround and catalyst cost expenditures (excluding VIEs) $ 787 $ 623 Deferred turnaround and catalyst cost expenditures of DGD $ 6 $ 25 Investments in nonconsolidated joint ventures $ 9 $ 54 Total capital investments $ 2,467 $ 2,490 Adjustments: DGD's capital investments attributable to our joint venture member $ (524) $ (274) Capital expenditures of other VIEs $ (110) $ (251) Capital investments attributable to Valero $ 1,833 $ 1,965 Adjusted Net Cash Provided by Operating Activities Defined as net cash provided by operating activities excluding the items noted below . Valero believes adjusted net cash provided by operating activities is an important measure of its ongoing financial performance to better assess its ability to generate cash to fund Valero’s investing and financing activities. The basis for Valero’s belief with respect to each excluded item is provided below. • Changes in current assets and current liabilities – Current assets net of current liabilities represents Valero’s operating liquidity. Valero believes that the change in its operating liquidity from period to period does not represent cash generated by Valero’s operations that is available to fund Valero’s investing and financing activities. • DGD’s adjusted net cash provided by operating activities attributable to the other joint venture member’s ownership interest in DGD – Valero is a 50/50 joint venture member in DGD and consolidates DGD’s financial statements; as a result, all of DGD’s net cash provided by operating activities (or operating cash flow) is included in Valero’s consolidated net cash provided by operating activities. DGD’s members use DGD’s operating cash flow (excluding changes in its current assets and current liabilities) to fund its capital investments rather than distribute all of that cash to themselves. Nevertheless, DGD’s operating cash flow is effectively attributable to each member and only 50 percent of DGD’s operating cash flow should be attributed to Valero's net cash provided by operating activities. Therefore, net cash provided by operating activities has been adjusted for the portion of DGD’s operating cash flow attributable to the other joint venture member’s ownership interest because Valero believes that it more accurately reflects the operating cash flow available to Valero to fund Valero’s investing and financing activities. Notes from Page 9: Valero published the 2021 TCFD Report and Scenario Analysis following the recommendations of the Task Force on Climate-related Financial Disclosures (TCFD). A copy of this report is available on our website at www.valero.com > Investors > ESG. Valero uses third parties to conduct GHG emissions, carbon intensity and fuel compliance verifications. Governments across the world with cap-and-trade and low-carbon fuel policies that purchase our low-carbon fuels require independent third-party assurance of our GHG emissions and the carbon intensity of our products. For instance, California requires the mandatory verification of GHG emissions data reports as well as low-carbon fuels. Verification services are performed by qualified and trained third-party verifiers. We engaged Lloyd’s Register Quality Assurance Inc., an affiliate of Lloyd’s Register North America Inc., to evaluate and issue an assurance statement on the accuracy and reliability of our global refinery Scope 1 and 2 GHG emissions. Notes from Page 14: Southwest Research Institute Ted Talk, presented by Graham Conway. Life cycle emissions from EVs are significant from mining raw materials to fabrication to delivery to the showroom. Two times as much CO 2 emissions are generated compared to cars fueled by gasoline. Before it leaves the showroom, 12 tons of CO 2 emissions have already been generated vs. 6 tons of CO 2 emissions from cars fueled by gasoline. Notes from Page 15: U.S. Heavy-Duty Long-Haul Vehicle (HDV) Life Cycle Emissions study conducted by Southwest Research Institute – “Life Cycle Analysis Report” (2021). Class 8 heavy-duty truck with a 1,000,000 mile (~15 years) lifetime, electric truck with a 500-mile battery range, electricity based on 2019 EIA average mix, one battery replacement, and diesel engine running on 100% waste oil based renewable diesel. Embedded emissions captures the emissions involved in the manufacturing, assembly and production of the vehicle as well as maintenance items over the lifetime of the vehicle such as battery, fluids, ADR (assembly, disposal and recycling), and components. Notes from Page 36: Data Verification. Valero uses third parties to conduct GHG emissions, carbon intensity and fuel compliance verifications. Governments across the world with cap-and-trade and low-carbon fuel policies require independent third-party assurance of our GHG emissions and the carbon intensity of our products. For instance, California requires the mandatory verification of GHG emissions data reports as well as low-carbon fuels. Verification services are performed by qualified and trained third-party verifiers. We engaged Lloyd’s Register Quality Assurance Inc., an affiliate of Lloyd’s Register North America Inc., to evaluate and issue an assurance statement on the accuracy and reliability of our global refinery Scope 1 and 2 GHG emissions. We intend to continue attaining assurance statements on our global refinery GHG emissions each year. Valero’s Net Scope 3 Intensity was calculated using Valero’s reported GHG emissions in 2021 under the EPA 40 CFR Part 98 netted for avoided emissions and emissions reductions from low-carbon fuels displacement of petroleum-based fuels and carbon capture, divided by total refining throughput, and ethanol and renewable diesel production. Avoided emissions are determined using the total produced and purchased/blended ethanol, renewable diesel and biodiesel volumes converted to energy-equivalent volumes of gasoline and diesel and multiplied by the corresponding emissions factors. Emissions reductions include carbon capture initiatives. GHG emissions for the refineries in Canada and the U.K. were calculated in conformance with EPA 40 CFR Part 98 methodology. Peer group consists of publicly listed independent pure play refiners. Net Scope 3 Intensity for the peer group was calculated using company reported 2021 GHG emissions, if publicly available, or otherwise 2020 GHG emissions (latest reported GHG emissions) under the EPA 40 CFR Part 98 netted for avoided emissions from low-carbon fuels displacement of petroleum-based fuels, if publicly available or based on an assumed blending and credits for 10% ethanol and the U.S. national average of 4.4% for biodiesel and renewable diesel divided by total refining throughput, and actual ethanol, biodiesel and/or renewable diesel production as disclosed in publicly available financial statements for the same year as the peer latest reported GHG emissions. There is not currently any standardized methodology for calculating Scope 3 emissions and the inherent unreliability of Scope 3 calculations may be of limited value. While our Net Scope 3 Intensity calculations include data reported under EPA 40 CFR Part 98, Net Scope 3 Intensity itself is not based on any standardized industry methodology and is not necessarily calculated in the same manner or comparable to similarly titled measures presented by other companies, including the peer group, or estimates published by third parties. Notes from Page 54: Sustaining Capex and Growth Capital Investments Atrributable to Valero are available on our website at www.valero.com > Investors > Events & Presentations > Investor Presentation. Non-GAAP Disclosures and Notes Year ended December 31
 Valero ESG Report Page 110 Page 112