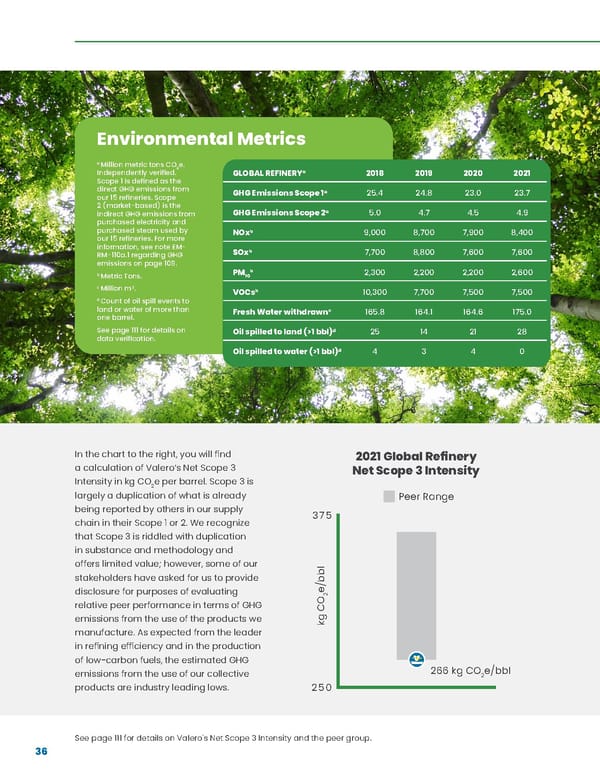
36 Environmental Metrics GLOBAL REFINERY a 2018 2019 2020 2021 GHG Emissions Scope 1 a 25.4 24.8 23.0 23.7 GHG Emissions Scope 2 a 5.0 4.7 4.5 4.9 NOx b 9,000 8,700 7,900 8,400 SOx b 7,700 8,800 7,600 7,600 PM 10 b 2,300 2,200 2,200 2,600 VOCs b 10,300 7,700 7,500 7,500 Fresh Water withdrawn c 165.8 164.1 164.6 175.0 Oil spilled to land (>1 bbl) d 25 14 21 28 Oil spilled to water (>1 bbl) d 4 3 4 0 a Million metric tons CO 2 e. Independently verified. Scope 1 is defined as the direct GHG emissions from our 15 refineries. Scope 2 (market-based) is the indirect GHG emissions from purchased electricity and purchased steam used by our 15 refineries. For more information, see note EM- RM-110a.1 regarding GHG emissions on page 109. b Metric Tons. c Million m 3 . d Count of oil spill events to land or water of more than one barrel. See page 111 for details on data verification. See page 111 for details on Valero's Net Scope 3 Intensity and the peer group. In the chart to the right, you will find a calculation of Valero’s Net Scope 3 Intensity in kg CO 2 e per barrel. Scope 3 is largely a duplication of what is already being reported by others in our supply chain in their Scope 1 or 2. We recognize that Scope 3 is riddled with duplication in substance and methodology and offers limited value; however, some of our stakeholders have asked for us to provide disclosure for purposes of evaluating relative peer performance in terms of GHG emissions from the use of the products we manufacture. As expected from the leader in refining efficiency and in the production of low-carbon fuels, the estimated GHG emissions from the use of our collective products are industry leading lows. 2021 Global Refinery Net Scope 3 Intensity 250 266 kg CO 2 e/bbl kg CO 2 e/bbl Peer Range 375
 Valero ESG Report Page 35 Page 37