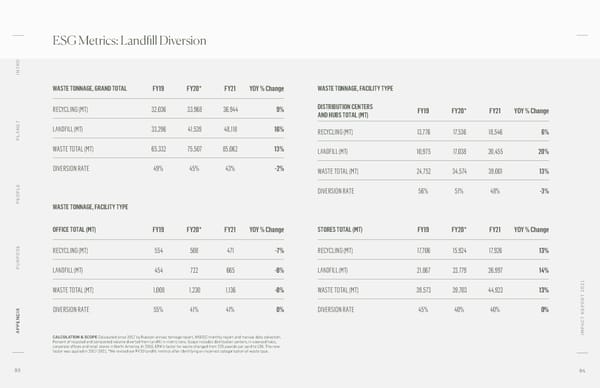
ESG Metrics: Landfill Diversion O INTR WASTE TONNAGE, GRAND TOTAL FY19 FY20* FY21 YOY % Change WASTE TONNAGE, FACILITY TYPE RECYCLING (MT) 32,036 33,968 36,944 9% DISTRIBUTION CENTERS FY19 FY20* FY21 YOY % Change AND HUBS TOTAL (MT) ANET LANDFILL (MT) 33,296 41,539 48,118 16% RECYCLING (MT) 13,776 17,536 18,546 6% PL WASTE TOTAL (MT) 65,332 75,507 85,062 13% LANDFILL (MT) 10,975 17,038 20,455 20% DIVERSION RATE 49% 45% 43% -2% WASTE TOTAL (MT) 24,752 34,574 39,001 13% OPLE DIVERSION RATE 56% 51% 48% -3% PE WASTE TONNAGE, FACILITY TYPE OFFICE TOTAL (MT) FY19 FY20* FY21 YOY % Change STORES TOTAL (MT) FY19 FY20* FY21 YOY % Change RECYCLING (MT) 554 508 471 -7% RECYCLING (MT) 17,706 15,924 17,926 13% PURPOSE LANDFILL (MT) 454 722 665 -8% LANDFILL (MT) 21,867 23,779 26,997 14% WASTE TOTAL (MT) 1,008 1,230 1,136 -8% WASTE TOTAL (MT) 39,573 39,703 44,923 13% T 2021 DIVERSION RATE 55% 41% 41% 0% DIVERSION RATE 45% 40% 40% 0% T REPOR C A APPENDIX IMP CALCULATION & SCOPE Calculated since 2017 by Rubicon annual tonnage report, WSI DC monthly report and manual data collection. Percent of recycled and composted volume diverted from landfill in metric tons. Scope includes distribution centers, in-sourced hubs, corporate offices and retail stores in North America. In 2016, EPA’s factor for waste changed from 225 pounds per yard to 138. The new factor was applied in 2017-2021. *We revised our FY20 landfill metrics after identifying an incorrect categorization of waste type. 93 94
 Williams-Sonoma, Inc - Impact Report Page 46 Page 48