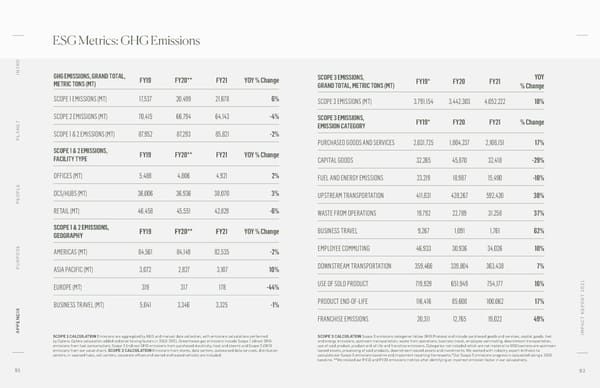
ESG Metrics: GHG Emissions O INTR GHG EMISSIONS, GRAND TOTAL, SCOPE 3 EMISSIONS, YOY METRIC TONS (MT) FY19 FY20** FY21 YOY % Change GRAND TOTAL, METRIC TONS (MT) FY19* FY20 FY21 % Change SCOPE 1 EMISSIONS (MT) 17,537 20,499 21,678 6% SCOPE 3 EMISSIONS (MT) 3,791,154 3,442,303 4,052,222 18% SCOPE 2 EMISSIONS (MT) 70,415 66,794 64,143 -4% SCOPE 3 EMISSIONS, FY19* FY20 FY21 % Change ANET EMISSION CATEGORY PL SCOPE 1 & 2 EMISSIONS (MT) 87,952 87,293 85,821 -2% PURCHASED GOODS AND SERVICES 2,031,725 1,804,237 2,108,151 17% SCOPE 1 & 2 EMISSIONS, FY19 FY20** FY21 YOY % Change FACILITY TYPE CAPITAL GOODS 32,265 45,870 32,418 -29% OFFICES (MT) 5,488 4,806 4,921 2% FUEL AND ENERGY EMISSIONS 23,219 18,987 15,490 -18% OPLE DCS/HUBS (MT) 36,006 36,936 38,070 3% UPSTREAM TRANSPORTATION 411,831 428,267 592,420 38% PE RETAIL (MT) 46,458 45,551 42,829 -6% WASTE FROM OPERATIONS 19,792 22,789 31,258 37% SCOPE 1 & 2 EMISSIONS, FY19 FY20** FY21 YOY % Change BUSINESS TRAVEL 9,267 1,091 1,761 62% GEOGRAPHY AMERICAS (MT) 84,561 84,149 82,535 -2% EMPLOYEE COMMUTING 46,933 30,936 34,026 10% PURPOSE ASIA PACIFIC (MT) 3,072 2,827 3,107 10% DOWNSTREAM TRANSPORTATION 359,466 339,804 363,438 7% EUROPE (MT) 319 317 178 -44% USE OF SOLD PRODUCT 719,929 651,949 754,177 16% PRODUCT END-OF-LIFE 116,416 85,608 100,062 17% T 2021 BUSINESS TRAVEL (MT) 5,041 3,346 3,325 -1% FRANCHISE EMISSIONS 20,311 12,765 19,022 49% T REPOR C A APPENDIX SCOPE 1 CALCULATION Emissions are aggregated by NUS and manual data collection, with emissions calculations performed SCOPE 3 CALCULATION Scope 3 emissions categories follow GHG Protocol and include purchased goods and services, capital goods, fuel IMP by Optera. Optera calculation added radiative forcing factors in 2019-2021. Greenhouse gas emissions include Scope 1 (direct GHG and energy emissions, upstream transportation, waste from operations, business travel, employee commuting, downstream transportation, emissions from fuel consumption), Scope 2 (indirect GHG emissions from purchased electricity, heat and steam) and Scope 3 (GHG use of sold product, product end-of-life and franchise emissions. Categories not included which are not material to WSI business are upstream emissions from our value chain). SCOPE 2 CALCULATION Emissions from stores, data centers, outsourced data services, distribution leased assets, processing of sold products, downstream leased assets and investments. We worked with industry expert Anthesis to centers, in-sourced hubs, call centers, corporate offices and owned and leased vehicles are included. calculate our Scope 3 emissions baseline and implement reporting frameworks.*Our Scope 3 emissions progress is calculated using a 2019 baseline. **We revised our FY19 and FY20 emissions metrics after identifying an incorrect emission factor in our calculations. 91 92
 Williams-Sonoma, Inc - Impact Report Page 45 Page 47