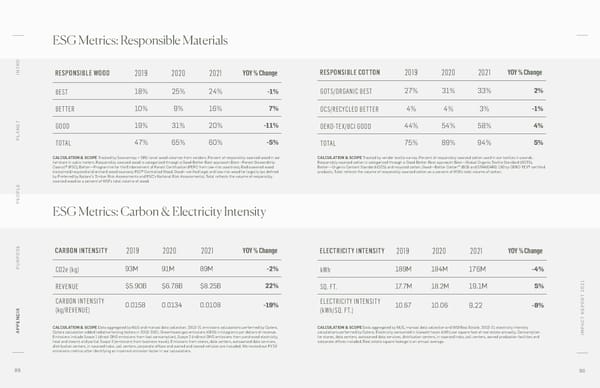
ESG Metrics: Responsible Materials O INTR RESPONSIBLE WOOD 2019 2020 2021 YOY % Change RESPONSIBLE COTTON 2019 2020 2021 YOY % Change BEST 18% 25% 24% -1% GOTS/ORGANIC BEST 27% 31% 33% 2% BETTER 10% 9% 16% 7% OCS/RECYCLED BETTER 4% 4% 3% -1% ANET GOOD 19% 31% 20% -11% OEKO-TEX/BCI GOOD 44% 54% 58% 4% PL TOTAL 47% 65% 60% -5% TOTAL 75% 89% 94% 5% CALCULATION & SCOPE Tracked by Sourcemap + SKU-level wood volumes from vendors. Percent of responsibly sourced wood in our CALCULATION & SCOPE Tracked by vendor textile survey. Percent of responsibly sourced cotton used in our textiles in pounds. furniture in cubic meters. Responsibly sourced wood is categorized through a Good-Better-Best approach: Best—Forest Stewardship Responsibly sourced cotton is categorized through a Good-Better-Best approach: Best—Global Organic Textile Standard (GOTS), Council® (FSC), Better—Programme for the Endorsement of Forest Certification (PEFC from low-risk countries), Rediscovered wood Better—Organic Content Standard (OCS) and recycled cotton, Good—Better Cotton™ (BCI) and STANDARD 100 by OEKO-TEX® certified (reclaimed/recycled and orchard wood sources), FSC® Controlled Wood, Good—verified legal and low-risk wood for legality (as defined products. Total reflects the volume of responsibly sourced cotton as a percent of WSI’s total volume of cotton. by Preferred by Nature’s Timber Risk Assessments and FSC’s National Risk Assessments). Total reflects the volume of responsibly sourced wood as a percent of WSI’s total volume of wood. OPLE PE ESG Metrics: Carbon & Electricity Intensity CARBON INTENSITY 2019 2020 2021 YOY % Change ELECTRICITY INTENSITY 2019 2020 2021 YOY % Change PURPOSE CO2e (kg) 93M 91M 89M -2% kWh 189M 184M 176M -4% REVENUE $5.90B $6.78B $8.25B 22% SQ. FT. 17.7M 18.2M 19.1M 5% CARBON INTENSITY ELECTRICITY INTENSITY T 2021 (kg/REVENUE) 0.0158 0.0134 0.0108 -19% (kWh/SQ. FT.) 10.67 10.06 9.22 -8% T REPOR C CALCULATION & SCOPE Data aggregated by NUS and manual data collection. 2019-21 emissions calculations performed by Optera. CALCULATION & SCOPE Data aggregated by NUS, manual data collection and WSI Real Estate. 2019-21 electricity intensity A APPENDIX Optera calculation added radiative forcing factors in 2019-2021. Greenhouse gas emissions (GHG) in kilograms per dollars of revenue. calculations performed by Optera. Electricity consumed in kilowatt hours (kWh) per square foot of real estate annually. Consumption IMP Emissions include Scope 1 (direct GHG emissions from fuel consumption), Scope 2 (indirect GHG emissions from purchased electricity, for stores, data centers, outsourced data services, distribution centers, in-sourced hubs, call centers, owned production facilities and heat and steam) and partial Scope 3 (emissions from business travel). Emissions from stores, data centers, outsourced data services, corporate offices included. Real estate square footage is an annual average. distribution centers, in-sourced hubs, call centers, corporate offices and owned and leased vehicles are included. We revised our FY20 emissions metrics after identifying an incorrect emission factor in our calculations. 89 90
 Williams-Sonoma, Inc - Impact Report Page 44 Page 46