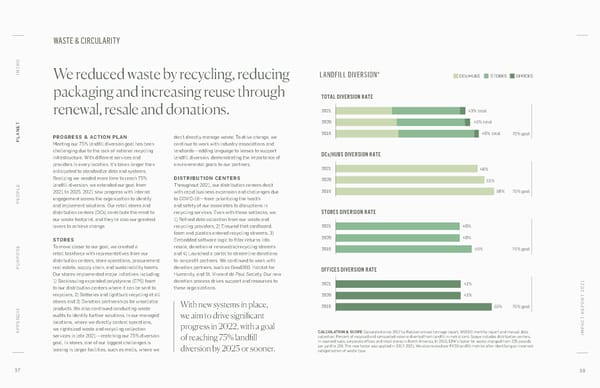
WASTE & CIRCULARITY O INTR We reduced waste by recycling, reducing LANDFILL DIVERSION* DCs/HUBS STORES OFFICES packaging and increasing reuse through TOTAL DIVERSION RATE renewal, resale and donations. 2021 43% total 2020 45% total ANET PROGRESS & ACTION PLAN don’t directly manage waste. To drive change, we 2019 49% total 75% goal PL Meeting our 75% landfill diversion goal has been continue to work with industry associations and challenging due to the lack of national recycling landlords—adding language to leases to support DCs/HUBS DIVERSION RATE infrastructure. With different services and landfill diversion, demonstrating the importance of providers in every location, it’s taken longer than environmental goals to our partners. 2021 48% anticipated to standardize data and systems. Realizing we needed more time to reach 75% DISTRIBUTION CENTERS 2020 51% landfill diversion, we extended our goal from Throughout 2021, our distribution centers dealt OPLE 2021 to 2025. 2021 saw progress with internal with rapid business expansion and challenges due 2019 56% 75% goal PE engagement across the organization to identify to COVID-19—from prioritizing the health and implement solutions. Our retail stores and and safety of our associates to disruptions in distribution centers (DCs) contribute the most to recycling services. Even with these setbacks, we: STORES DIVERSION RATE our waste footprint, and they’re also our greatest 1) Refined data collection from our waste and levers to achieve change. recycling providers, 2) Ensured that cardboard, 2021 40% foam and plastics entered recycling streams, 3) 2020 40% STORES Embedded software logic to filter returns into To move closer to our goal, we created a resale, donation or renewable/recycling streams 2019 45% 75% goal retail taskforce with representatives from our and 4) Launched a portal to streamline donations distribution centers, store operations, procurement, to nonprofit partners. We continued to work with PURPOSE real estate, supply chain, and sustainability teams. donation partners, such as Good360, Habitat for OFFICES DIVERSION RATE Our stores implemented major initiatives including: Humanity, and St. Vincent de Paul Society. Our new 1) Backhauling expanded polystyrene (EPS) foam donation process drives support and resources to 2021 41% to our distribution centers where it can be sent to these organizations. recyclers, 2) Batteries and lightbulb recycling at all 2020 41% T 2021 stores and 3) Donation partnerships for unsellable With new systems in place, products. We also continued conducting waste 2019 55% 75% goal audits to identify further solutions. In our managed we aim to drive significant T REPOR locations, where we directly control operations, C A we rightsized waste and recycling collection progress in 2022, with a goal * APPENDIX services in late 2021 CALCULATION & SCOPE Calculated since 2017 by Rubicon annual tonnage report, WSI DC monthly report and manual data IMP —matching our 75% diversion of reaching 75% landfill collection. Percent of recycled and composted volume diverted from landfill in metric tons. Scope includes distribution centers, goal. In stores, one of our biggest challenges is in-sourced hubs, corporate offices and retail stores in North America. In 2016, EPA’s factor for waste changed from 225 pounds leasing in larger facilities, such as malls, where we per yard to 138. The new factor was applied in 2017–2021. We also revised our FY20 landfill metrics after identifying an incorrect diversion by 2025 or sooner. categorization of waste type. BOARD DIVERSITY METRICS 2021 37 38
 Williams-Sonoma, Inc - Impact Report Page 18 Page 20