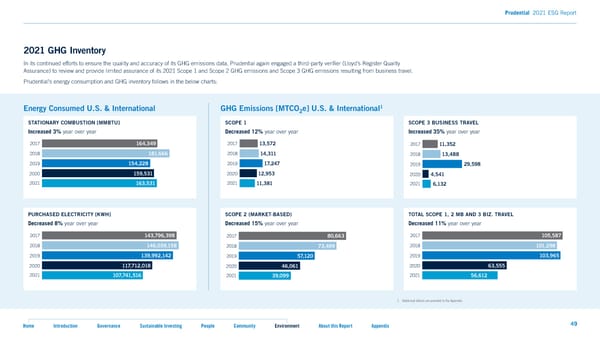
Prudential 2021 ESG Report 2017 164,349 2017 13,572 2018 181,666 2018 14,311 2021 GHG Inventory 2019 154,228 2019 17,247 2020 159,531 2020 12,953 2017 164,349 2017 13,572 In its continued efforts to ensure the quality and accuracy of its GHG emissions data, Prudential again engaged a third-party veri昀椀er (Lloyd’s Register Quality 2021 163,531 2021 11,381 2018 181,666 2018 14,311 Assurance) to review and provide limited assurance of its 2021 Scope 1 and Scope 2 GHG emissions and Scope 3 GHG emissions resulting from business travel. 2019 154,228 2019 17,247 Prudential’s energy consumption and GHG inventory follows in the below charts: 2017 143,796,398 2017 80,663 2020 159,531 2020 12,953 2018 146,039,158 2018 73,499 2021 163,531 2021 11,381 2019 139,992,142 1 2019 57,120 Energy Consumed U.S. & International GHG Emissions [MTCO e] U.S. & International 2020 2 117,712,018 2020 46,061 2017 143,796,398 2017 80,663 STATIONARY COMBUSTION [MMBTU] SCOPE 1 SCOPE 3 BUSINESS TRAVEL 2021 107,741,516 2021 39,099 2018 146,039,158 2018 73,499 Increased 3% year over year Decreased 12% year over year Increased 35% year over year 2019 139,992,142 2019 57,120 2017 2017 164,316494 ,349 20172017 13,57213,572 2017 11,352 2020 117,712,018 2020 46,061 2018 2018 181,666181 ,666 20182018 14,31114,311 2018 13,488 2021 107,741,516 2021 39,099 2019 2019 154,215284 ,228 20192019 17,21477,247 2019 29,598 2017 0.01089 2020 2020 159,513159 ,531 20202020 12,95312,953 2020 4,541 2017 164,349 2017 13,572 2017 11,352 2017 164,349 2017 13,572 2018 0.01058 2021 2021 163,513163 ,531 20212021 11,38111,381 2021 6,132 20182018 181,666 20182018 14,311 2018 13,488 181,666 2019 14,311 0.00896 2019 154,228 2019 17,247 2019 29,598 2019 154,228 2019 17,247 2020 0.00709 2017 0.01089 20172017 143,714963,,739986,398 20172017 80,66380,663 2017 105,587 20202020 159,531 20202020 12,953 2020 4,541 159,531 2021 12,953 0.00715 2018 0.01058 20182018 146,013496,1,05389,158 20182018 73,49793,499 2018 101,298 PURCHASED ELECTRICITY [KWH] SCOPE 2 (MARKET-BASED) TOTAL SCOPE 1, 2 MB AND 3 BIZ. TRAVEL 20212021 163,531 20212021 11,381 2021 6,132 163,531 11,381 139,91932,9,194292,142 2019 57,12507,1200.00896 20192019 20192019 2019 103,965 Decreased 8% year over year Decreased 15% year over year Decreased 11% year over year 2017 0.01220 2020 0.00709 20202020 117,171127,,071182,018 20202020 46,04616,061 2020 63,555 2017 143,796,398 2017 80,663 2017 105,587 2017 143,796,398 2017 80,663 2018 0.01220 2021 0.00715 20212021 107,710417,5,71641,516 20212021 39,03999,099 2021 56,612 2018 146,039,158 2018 73,499 2018 101,298 2018 146,039,158 2018 73,499 0.01252 2019 2019 139,992,142 2019 57,120 2019 103,965 2019 139,992,142 2019 57,120 2020 0.00764 2017 0.01220 20172017 11,31152,352 2020 117,712,018 2020 46,061 2020 63,555 2020 117,712,018 2020 46,061 2021 0.00802 2018 0.01220 20182018 13,41388,488 2021 107,741,516 2021 39,099 2021 2021 107,741,516 2021 39,099 56,612 2019 29,52989,598 0.01252 20192019 20172017 0.01008.019 089 2020 0.00764 20202020 2017 4,5414,541 2017 11,352 20182018 0.01005.018 058 11,352 2021 0.00802 1. Additional details are provided in the Appendix. 202120216,1362,132 2018 13,488 20192019 0.0008.0960896 2018 13,488 2019 29,598 20202020 0.00070.090709 2019 29,598 2017 0.01089 2017 0.01089 20172017 105,105857,587 49 Home Introduction Governance Sustainable Investing People Community Environment About this Report Appendix 2020 4,541 20212021 0.00071.050715 2020 4,541 2018 0.01058 2018 0.01058 20182018 101,120198,298 20212021 6,132 6,132 2019 0.00896 2019 0.00896 20192019 103,916503,965 20172017 0.0102.2010 220 20202020 0.00709 0.00709 20202020 63,55563,555 2017 105,587 20182018 0.0102.2010 220 2017 105,587 20212021 0.00715 20212021 0.00715 2018 56,61562,612 101,298 20192019 0.0102.5012 252 2018 101,298 2019 103,965 20202020 0.00076.040764 2019 103,965 2017 0.01220 2017 0.01220 2020 63,555 20212021 0.00800.020802 2020 63,555 2018 0.01220 2018 0.01220 20212021 56,612 56,612 2019 0.01252 2019 0.01252 20202020 0.00764 0.00764 20212021 0.00802 0.00802
 2021 ESG Report Page 48 Page 50