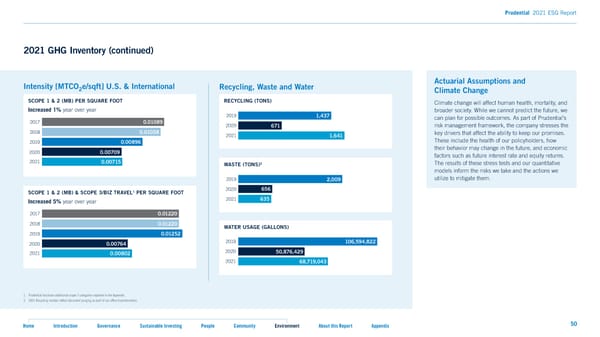
2017 164,349 2017 13,572 2018 181,666 2018 14,311 2019 154,228 2019 17,247 2020 159,531 2020 12,953 2017 164,349 2017 13,572 Prudential 2021 ESG Report 2021 163,531 2021 11,381 2018 181,666 2018 14,311 2019 154,228 2019 17,247 2017 143,796,398 2017 80,663 2020 159,531 2020 12,953 2018 146,039,158 2018 73,499 2021 163,531 2021 11,381 2021 GHG Inventory (continued) 2019 139,992,142 2019 57,120 2020 117,712,018 2020 46,061 2017 143,796,398 2017 80,663 2021 107,741,516 2021 39,099 2018 146,039,158 2018 73,499 Actuarial Assumptions and Intensity [MTCO e/sqft] U.S. & International Recycling, Waste and Water 2019 2 139,992,142 2019 57,120 Climate Change 2017 11,352 2020 117,712,018 2020 46,061 SCOPE 1 & 2 (MB) PER SQUARE FOOT RECYCLING (TONS) Climate change will affect human health, mortality, and 2018 13,488 2021 107,741,516 2021 39,099 Increased 1% year over year broader society. While we cannot predict the future, we 2019 29,598 1,437 2019 can plan for possible outcomes. As part of Prudential’s 2017 0.01089 2019 1,437 2020 671 risk management framework, the company stresses the 2020 4,541 2018 0.01058 2017 11,352 2019 1,437 key drivers that affect the ability to keep our promises. 2020 671 2021 2021 6,132 1,641 2019 0.00896 2018 13,488 These include the health of our policyholders, how 2020 671 2021 29,598 1,641 their behavior may change in the future, and economic 2020 0.00709 2019 2017 0.01089 2021 1,641 2017 105,587 factors such as future interest rate and equity returns. 2021 0.00715 2020 4,541 2018 2 The results of these stress tests and our quantitative 0.01058 WASTE (TONS) 2018 101,298 20212019 6,132 2,009 models inform the risks we take and the actions we 2019 0.00896 2019 103,965 utilize to mitigate them. 2019 656 2,009 2017 0.01220 2020 2020 0.00709 20202019 63,555 2,009 2017 656 105,587 2020 635 2018 1 0.01220 2021 SCOPE 1 & 2 (MB) & SCOPE 3/BIZ TRAVEL PER SQUARE FOOT 2021 0.00715 2021 656 56,612 2020 2018 635 101,298 2019 0.01252 2021 Increased 5% year over year 2021 635 103,965 2020 0.00764 2019 2017 0.01220 2021 0.00802 2020 63,555 2018 0.01220 2019 106,594,822 2021 WATER USAGE (GALLONS) 56,612 2019 0.01252 2019 106,594,822 2020 50,876,429 2019 106,594,822 2020 0.0076 4 2020 50,876,429 2021 68,719,043 2020 50,876,429 2021 0.00802 2021 68,719,043 2021 68,719,043 1. Prudential discloses additional scope 3 categories reported in the Appendix. 2. 2021 Recycling number re昀氀ect document purging as part of our of昀椀ce transformation Home Introduction Governance Sustainable Investing People Community Environment About this Report Appendix 50
 2021 ESG Report Page 49 Page 51