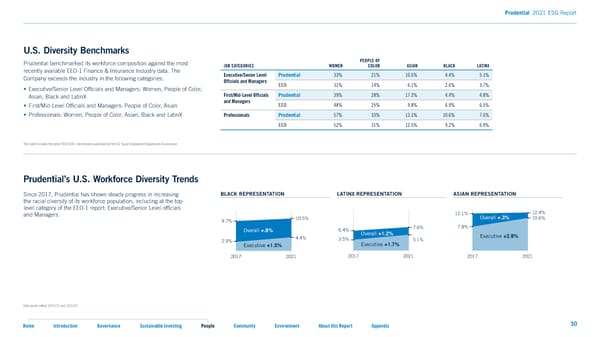
Prudential 2021 ESG Report U.S. Diversity Benchmarks Prudential benchmarked its workforce composition against the most PEOPLE OF JOB CATEGORIES WOMEN COLOR ASIAN BLACK LATINX recently available EEO-1 Finance & Insurance Industry data. The Executive/Senior Level Prudential 33% 21% 10.6% 4.4% 9.7% 5.1% 10.5% Company exceeds the industry in the following categories: Of昀椀cials and Managers Overall +.8% • Executive/Senior Level Of昀椀cials and Managers: Women, People of Color, EEO 31% 14% 6.1% 2.6% 3.7% 2.9% 4.4% Asian, Black and LatinX First/Mid-Level Of昀椀cials Prudential 39% 28% 17.3% 4.4% 4.8% and Managers Executive +1.5% • First/Mid-Level Of昀椀cials and Managers: People of Color, Asian EEO 48% 25% 9.8% 6.9% 2017 6.5% 2021 • Professionals: Women, People of Color, Asian, Black and LatinX Professionals Prudential 57% 33% 13.1% 10.6% 7.6% EEO 52% 31% 12.5% 9.2% 6.9% This table includes the latest 2018 EEO-1 benchmarks published by the U.S. Equal Employment Opportunity Commission. 10.5% 9.7% 7.6% 6.4% Overall +1.2% Overall +.8% 3.5% 4.4% 5.1% 2.9% Executive +1.7% Executive +1.5% Prudential’s U.S. Workforce Diversity Trends 2017 2021 2017 2021 Since 2017, Prudential has shown steady progress in increasing BLACK REPRESENTATION LATINX REPRESENTATION ASIAN REPRESENTATION the racial diversity of its workforce population, including at the top- level category of the EEO-1 report: Executive/Senior Level of昀椀cials 12.4% and Managers. 12.1% Overall +.3% 9.7% 10.5% 10.6% Overall +.8% 6.4% 7.6% 7.8% 4.4% Overall +1.2% Executive +2.8% 2.9% 3.5% 5.1% Executive +1.5% Executive +1.7% 2017 2021 2017 2021 2017 2021 12.1% 12.4% Overall +.3% 10.6% 6.4% 7.6% 7.8% Data points re昀氀ect 12/31/17 and 12/31/21. Overall +1.2% 3.5% 5.1% Executive +2.8% Executive +1.7% Home Introduction Governance Sustainable Investing People Community Environment About this Report Appendix 30 2017 2021 2017 2021 12.1% 12.4% Overall +.3% 10.6% 7.8% Executive +2.8% 2017 2021
 2021 ESG Report Page 29 Page 31