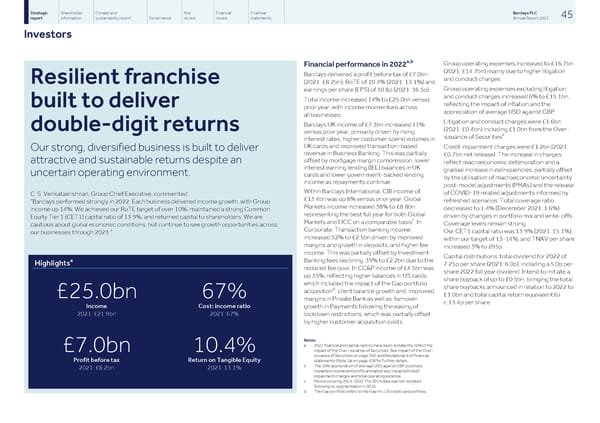
Strategic Shareholder Climate and Risk Financial Financial Barclays PLC 45 report information sustainability report Governance review review statements Annual Report 2022 Investors a,b Group operating expenses increased to £16.7bn Financial performance in 2022 (2021: £14.7bn) mainly due to higher litigation Barclays delivered a profit before tax of £7.0bn and conduct charges: Resilient franchise (2021: £8.2bn), RoTE of 10.4% (2021: 13.1%) and Group operating expenses excluding litigation earnings per share (EPS) of 30.8p (2021: 36.5p). and conduct charges increased 6% to £15.1bn, Total income increased 14% to £25.0bn versus reflecting the impact of inflation and the built to deliver prior year, with income momentum across appreciation of average USD against GBP all businesses: Litigation and conduct charges were £1.6bn Barclays UK income of £7.3bn increased 11% double-digit returns (2021: £0.4bn) including £1.0bn from the Over- versus prior year, primarily driven by rising a issuance of Securities . interest rates, higher customer spend volumes in UK cards and improved transaction-based Credit impairment charges were £1.2bn (2021: Our strong, diversified business is built to deliver revenue in Business Banking. This was partially £0.7bn net release). The increase in charges offset by mortgage margin compression, lower attractive and sustainable returns despite an reflect macroeconomic deterioration and a interest earning lending (IEL) balances in UK gradual increase in delinquencies, partially offset uncertain operating environment. cards and lower government-backed lending by the utilisation of macroeconomic uncertainty income as repayments continue. post-model adjustments (PMAs) and the release Within Barclays International, CIB income of of COVID-19 related adjustments informed by C. S. Venkatakrishnan, Group Chief Executive, commented £13.4bn was up 8% versus prior year. Global refreshed scenarios. Total coverage ratio “Barclays performed strongly in 2022. Each business delivered income growth, with Group Markets income increased 38% to £8.8bn decreased to 1.4% (December 2021: 1.6%) income up 14%. We achieved our RoTE target of over 10%, maintained a strong Common representing the best full year for both Global driven by changes in portfolio mix and write-offs. Equity Tier 1 (CET1) capital ratio of 13.9%, and returned capital to shareholders. We are c Markets and FICC on a comparable basis . In Coverage levels remain strong. cautious about global economic conditions, but continue to see growth opportunities across Corporate, Transaction banking income Our CET1 capital ratio was 13.9% (2021: 15.1%), our businesses through 2023.” increased 52% to £2.5bn driven by improved within our target of 13-14%, and TNAV per share margins and growth in deposits, and higher fee increased 3% to 295p. income. This was partially offset by Investment Capital distributions: total dividend for 2022 of a Banking fees declining 39% to £2.2bn due to the Highlights 7.25p per share (2021: 6.0p), including a 5.0p per reduced fee pool. In CC&P income of £4.5bn was share 2022 full year dividend. Intend to initiate a up 35%, reflecting higher balances in US cards share buyback of up to £0.5bn, bringing the total which included the impact of the Gap portfolio share buybacks announced in relation to 2022 to d acquisition , client balance growth and improved £1.0bn and total capital return equivalent to £25.0bn 67% margins in Private Bank as well as turnover c.13.4p per share. Income Cost: income ratio growth in Payments following the easing of 2021: £21.9bn 2021: 67% lockdown restrictions, which was partially offset by higher customer acquisition costs. Notes a 2021 financial and capital metrics have been restated to reflect the impact of the Over-issuance of Securities. See Impact of the Over- £7.0bn 10.4% issuance of Securities on page 356 and Restatement of financial Profit before tax Return on Tangible Equity statements (Note 1a) on page 428 for further details. b The 10% appreciation of average USD against GBP positively 2021: £8.2bn 2021: 13.1% impacted income and profits and adversely impacted credit impairment charges and total operating expense. c Period covering 2014-2022. Pre 2014 data was not restated following re-segmentation in 2016. d The Gap portfolio refers to the Gap Inc. US credit card portfolio.
 Barclays PLC - Annual Report - 2022 Page 46 Page 48