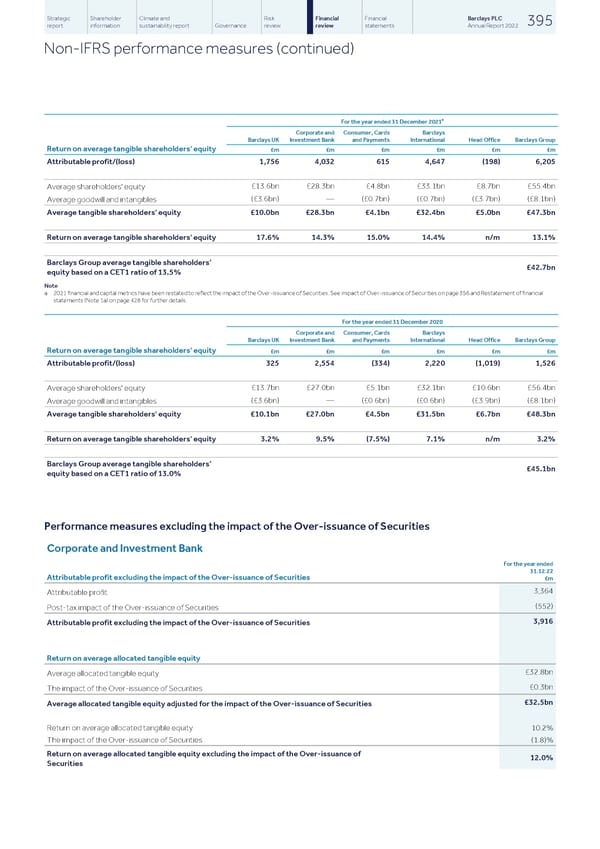
Strategic Shareholder Climate and Risk Financial Financial Barclays PLC 395 report information sustainability report Governance review review statements Annual Report 2022 Non-IFRS performance measures (continued) a For the year ended 31 December 2021 Corporate and Consumer, Cards Barclays Barclays UK Investment Bank and Payments International Head Office Barclays Group Return on average tangible shareholders' equity £m £m £m £m £m £m Attributable profit/(loss) 1,756 4,032 615 4,647 (198) 6,205 £13.6bn £28.3bn £4.8bn £33.1bn £8.7bn £55.4bn Average shareholders' equity (£3.6bn) — (£0.7bn) (£0.7bn) (£3.7bn) (£8.1bn) Average goodwill and intangibles Average tangible shareholders' equity £10.0bn £28.3bn £4.1bn £32.4bn £5.0bn £47.3bn Return on average tangible shareholders' equity 17.6% 14.3% 15.0% 14.4% n/m 13.1% Barclays Group average tangible shareholders’ £42.7bn equity based on a CET1 ratio of 13.5% Note a 2021 financial and capital metrics have been restated to reflect the impact of the Over-issuance of Securities. See impact of Over-issuance of Securities on page 356 and Restatement of financial statements (Note 1a) on page 428 for further details. For the year ended 31 December 2020 Corporate and Consumer, Cards Barclays Barclays UK Investment Bank and Payments International Head Office Barclays Group Return on average tangible shareholders' equity £m £m £m £m £m £m Attributable profit/(loss) 325 2,554 (334) 2,220 (1,019) 1,526 £13.7bn £27.0bn £5.1bn £32.1bn £10.6bn £56.4bn Average shareholders' equity (£3.6bn) — (£0.6bn) (£0.6bn) (£3.9bn) (£8.1bn) Average goodwill and intangibles Average tangible shareholders' equity £10.1bn £27.0bn £4.5bn £31.5bn £6.7bn £48.3bn Return on average tangible shareholders' equity 3.2% 9.5% (7.5%) 7.1% n/m 3.2% Barclays Group average tangible shareholders’ £45.1bn equity based on a CET1 ratio of 13.0% Performance measures excluding the impact of the Over-issuance of Securities Corporate and Investment Bank For the year ended 31.12.22 Attributable profit excluding the impact of the Over-issuance of Securities £m 3,364 Attributable profit (552) Post-tax impact of the Over-issuance of Securities 3,916 Attributable profit excluding the impact of the Over-issuance of Securities Return on average allocated tangible equity £32.8bn Average allocated tangible equity £0.3bn The impact of the Over-issuance of Securities £32.5bn Average allocated tangible equity adjusted for the impact of the Over-issuance of Securities Return on average allocated tangible equity 10.2% The impact of the Over-issuance of Securities (1.8)% Return on average allocated tangible equity excluding the impact of the Over-issuance of 12.0% Securities
 Barclays PLC - Annual Report - 2022 Page 396 Page 398