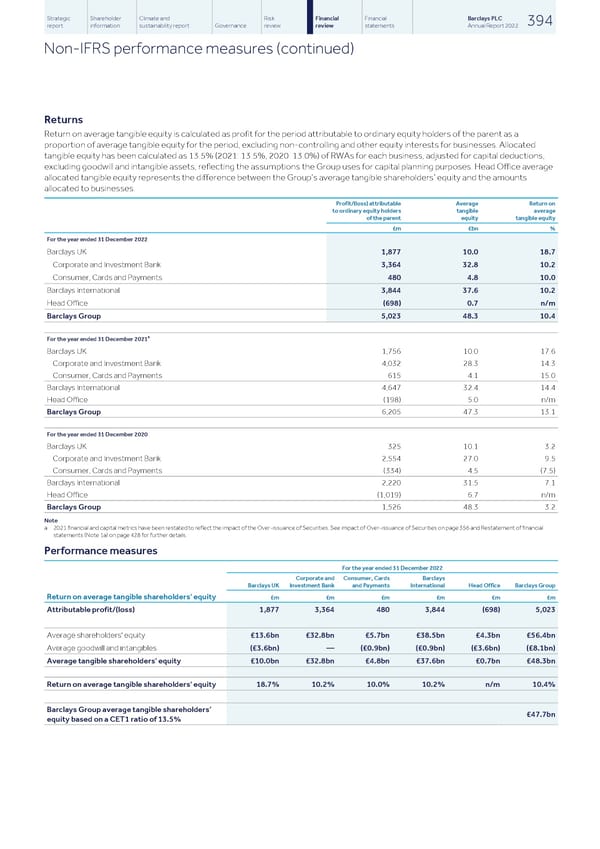
Strategic Shareholder Climate and Risk Financial Financial Barclays PLC 394 report information sustainability report Governance review review statements Annual Report 2022 Non-IFRS performance measures (continued) Returns Return on average tangible equity is calculated as profit for the period attributable to ordinary equity holders of the parent as a proportion of average tangible equity for the period, excluding non-controlling and other equity interests for businesses. Allocated tangible equity has been calculated as 13.5% (2021: 13.5%, 2020: 13.0%) of RWAs for each business, adjusted for capital deductions, excluding goodwill and intangible assets, reflecting the assumptions the Group uses for capital planning purposes. Head Office average allocated tangible equity represents the difference between the Group’s average tangible shareholders’ equity and the amounts allocated to businesses. Profit/(loss) attributable Average Return on to ordinary equity holders tangible average of the parent equity tangible equity £m £bn % For the year ended 31 December 2022 Barclays UK 1,877 10.0 18.7 Corporate and Investment Bank 3,364 32.8 10.2 Consumer, Cards and Payments 480 4.8 10.0 Barclays International 3,844 37.6 10.2 Head Office (698) 0.7 n/m Barclays Group 5,023 48.3 10.4 a For the year ended 31 December 2021 Barclays UK 1,756 10.0 17.6 Corporate and Investment Bank 4,032 28.3 14.3 Consumer, Cards and Payments 615 4.1 15.0 Barclays International 4,647 32.4 14.4 Head Office (198) 5.0 n/m Barclays Group 6,205 47.3 13.1 For the year ended 31 December 2020 Barclays UK 325 10.1 3.2 Corporate and Investment Bank 2,554 27.0 9.5 Consumer, Cards and Payments (334) 4.5 (7.5) Barclays International 2,220 31.5 7.1 Head Office (1,019) 6.7 n/m Barclays Group 1,526 48.3 3.2 Note a 2021 financial and capital metrics have been restated to reflect the impact of the Over-issuance of Securities. See impact of Over-issuance of Securities on page 356 and Restatement of financial statements (Note 1a) on page 428 for further details. Performance measures For the year ended 31 December 2022 Corporate and Consumer, Cards Barclays Barclays UK Investment Bank and Payments International Head Office Barclays Group Return on average tangible shareholders' equity £m £m £m £m £m £m Attributable profit/(loss) 1,877 3,364 480 3,844 (698) 5,023 Average shareholders' equity £13.6bn £32.8bn £5.7bn £38.5bn £4.3bn £56.4bn Average goodwill and intangibles (£3.6bn) — (£0.9bn) (£0.9bn) (£3.6bn) (£8.1bn) Average tangible shareholders' equity £10.0bn £32.8bn £4.8bn £37.6bn £0.7bn £48.3bn Return on average tangible shareholders' equity 18.7% 10.2% 10.0% 10.2% n/m 10.4% Barclays Group average tangible shareholders’ £47.7bn equity based on a CET1 ratio of 13.5%
 Barclays PLC - Annual Report - 2022 Page 395 Page 397