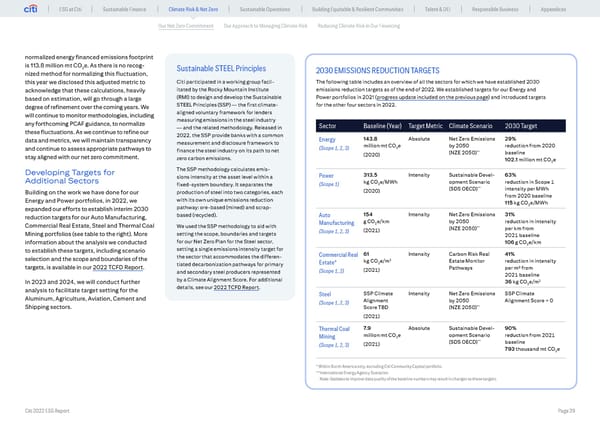
ESG at Citi Sustainable Finance Climate Risk & Net Zero Sustainable Operations Building Equitable & Resilient Communities Talent & DEI Responsible Business Appendices Our Net Zero Commitment Our Approach to Managing Climate Risk Reducing Climate Risk in Our Financing normalized energy financed emissions footprint is 113.8 million mt CO2e. As there is no recog- Sustainable STEEL Principles 2030 EMISSIONS REDUCTION TARGETS nized method for normalizing this fluctuation, this year we disclosed this adjusted metric to Citi participated in a working group facil- The following table includes an overview of all the sectors for which we have established 2030 acknowledge that these calculations, heavily itated by the Rocky Mountain Institute emissions reduction targets as of the end of 2022. We established targets for our Energy and based on estimation, will go through a large (RMI) to design and develop the Sustainable Power portfolios in 2021 (progress update included on the previous page) and introduced targets degree of refinement over the coming years. We STEEL Principles (SSP) — the first climate- for the other four sectors in 2022. will continue to monitor methodologies, including aligned voluntary framework for lenders any forthcoming PCAF guidance, to normalize measuring emissions in the steel industry — and the related methodology. Released in Sector Baseline (Year) Target Metric Climate Scenario 2030 Target these fluctuations. As we continue to refine our 2022, the SSP provide banks with a common data and metrics, we will maintain transparency measurement and disclosure framework to Energy 143.8 Absolute Net Zero Emissions 29% and continue to assess appropriate pathways to (Scope 1, 2, 3) million mt CO2e by 2050 reduction from 2020 finance the steel industry on its path to net ** stay aligned with our net zero commitment. (2020) (NZE 2050) baseline zero carbon emissions. 102.1 million mt CO e 2 Developing Targets for The SSP methodology calculates emis- Additional Sectors sions intensity at the asset level within a Power 313.5 Intensity Sustainable Devel- 63% fixed-system boundary. It separates the (Scope 1) kg CO2e/MWh opment Scenario reduction in Scope 1 (2020) (SDS OECD)** intensity per MWh Building on the work we have done for our production of steel into two categories, each from 2020 baseline Energy and Power portfolios, in 2022, we with its own unique emissions reduction 115 kg CO e/MWh expanded our efforts to establish interim 2030 pathway: ore-based (mined) and scrap- 2 reduction targets for our Auto Manufacturing, based (recycled). Auto 154 Intensity Net Zero Emissions 31% Commercial Real Estate, Steel and Thermal Coal Manufacturing g CO2e/km by 2050 reduction in intensity We used the SSP methodology to aid with ** (Scope 1, 2, 3) (2021) (NZE 2050) per km from Mining portfolios (see table to the right). More setting the scope, boundaries and targets 2021 baseline information about the analysis we conducted for our Net Zero Plan for the Steel sector, 106 g CO2e/km to establish these targets, including scenario setting a single emissions intensity target for the sector that accommodates the differen- Commercial Real 61 Intensity Carbon Risk Real 41% selection and the scope and boundaries of the 2 tiated decarbonization pathways for primary Estate* kg CO2e/m Estate Monitor reduction in intensity targets, is available in our 2022 TCFD Report. (Scope 1, 2) (2021) Pathways per m2 from and secondary steel producers represented 2021 baseline by a Climate Alignment Score. For additional 2 In 2023 and 2024, we will conduct further 36 kg CO2e/m analysis to facilitate target setting for the details, see our 2022 TCFD Report. Steel SSP Climate Intensity Net Zero Emissions SSP Climate Aluminum, Agriculture, Aviation, Cement and (Scope 1, 2, 3) Alignment by 2050 Alignment Score = 0 Shipping sectors. Score TBD (NZE 2050)** (2021) Thermal Coal 7.9 Absolute Sustainable Devel- 90% Mining million mt CO2e opment Scenario reduction from 2021 ** (Scope 1, 2, 3) (2021) (SDS OECD) baseline 793 thousand mt CO2e * Within North America only, excluding Citi Community Capital portfolio. **International Energy Agency Scenarios Note: Updates to improve data quality of the baseline numbers may result in changes to these targets. Citi 2022 ESG Report Page 29
 Global ESG Report 2022 Citi Bookmarked Page 28 Page 30