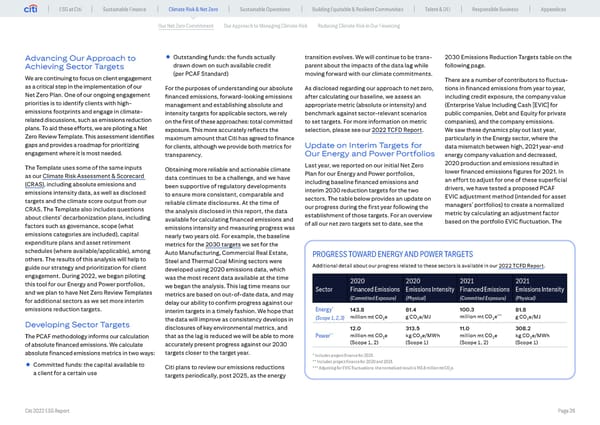
ESG at Citi Sustainable Finance Climate Risk & Net Zero Sustainable Operations Building Equitable & Resilient Communities Talent & DEI Responsible Business Appendices Our Net Zero Commitment Our Approach to Managing Climate Risk Reducing Climate Risk in Our Financing Advancing Our Approach to • Outstanding funds: the funds actually transition evolves. We will continue to be trans- 2030 Emissions Reduction Targets table on the Achieving Sector Targets drawn down on such available credit parent about the impacts of the data lag while following page. We are continuing to focus on client engagement (per PCAF Standard) moving forward with our climate commitments. There are a number of contributors to fluctua- as a critical step in the implementation of our For the purposes of understanding our absolute As disclosed regarding our approach to net zero, tions in financed emissions from year to year, Net Zero Plan. One of our ongoing engagement financed emissions, forward-looking emissions after calculating our baseline, we assess an including credit exposure, the company value priorities is to identify clients with high- management and establishing absolute and appropriate metric (absolute or intensity) and (Enterprise Value Including Cash [EVIC] for emissions footprints and engage in climate- intensity targets for applicable sectors, we rely benchmark against sector-relevant scenarios public companies, Debt and Equity for private related discussions, such as emissions reduction on the first of these approaches: total committed to set targets. For more information on metric companies), and the company emissions. plans. To aid these efforts, we are piloting a Net exposure. This more accurately reflects the selection, please see our 2022 TCFD Report. We saw these dynamics play out last year, Zero Review Template. This assessment identifies maximum amount that Citi has agreed to finance particularly in the Energy sector, where the gaps and provides a roadmap for prioritizing for clients, although we provide both metrics for Update on Interim Targets for data mismatch between high, 2021 year-end engagement where it is most needed. transparency. Our Energy and Power Portfolios energy company valuation and decreased, The Template uses some of the same inputs Last year, we reported on our initial Net Zero 2020 production and emissions resulted in Obtaining more reliable and actionable climate Plan for our Energy and Power portfolios, lower financed emissions figures for 2021. In as our Climate Risk Assessment & Scorecard data continues to be a challenge, and we have an effort to adjust for one of these superficial (CRAS), including absolute emissions and been supportive of regulatory developments including baseline financed emissions and emissions intensity data, as well as disclosed interim 2030 reduction targets for the two drivers, we have tested a proposed PCAF to ensure more consistent, comparable and sectors. The table below provides an update on EVIC adjustment method (intended for asset targets and the climate score output from our reliable climate disclosures. At the time of managers’ portfolios) to create a normalized CRAS. The Template also includes questions the analysis disclosed in this report, the data our progress during the first year following the about clients’ decarbonization plans, including establishment of those targets. For an overview metric by calculating an adjustment factor available for calculating financed emissions and of all our net zero targets set to date, see the based on the portfolio EVIC fluctuation. The factors such as governance, scope (what emissions intensity and measuring progress was emissions categories are included), capital nearly two years old. For example, the baseline expenditure plans and asset retirement metrics for the 2030 targets we set for the schedules (where available/applicable), among Auto Manufacturing, Commercial Real Estate, PROGRESS TOWARD ENERGY AND POWER TARGETS others. The results of this analysis will help to Steel and Thermal Coal Mining sectors were guide our strategy and prioritization for client developed using 2020 emissions data, which Additional detail about our progress related to these sectors is available in our 2022 TCFD Report. engagement. During 2022, we began piloting was the most recent data available at the time 2020 2020 2021 2021 this tool for our Energy and Power portfolios, we began the analysis. This lag time means our Sector Financed Emissions Emissions Intensity Financed Emissions Emissions Intensity and we plan to have Net Zero Review Templates metrics are based on out-of-date data, and may for additional sectors as we set more interim delay our ability to confirm progress against our (Committed Exposure) (Physical) (Committed Exposure) (Physical) emissions reduction targets. interim targets in a timely fashion. We hope that Energy* 143.8 81.4 100.3 81.8 *** the data will improve as consistency develops in (Scope 1, 2, 3) million mt CO2e g CO2e/MJ million mt CO2e g CO2e/MJ Developing Sector Targets disclosures of key environmental metrics, and 12.0 313.5 11.0 308.2 ** million mt CO e kg CO e/MWh million mt CO e kg CO e/MWh The PCAF methodology informs our calculation that as the lag is reduced we will be able to more Power 2 2 2 2 of absolute financed emissions. We calculate accurately present progress against our 2030 (Scope 1, 2) (Scope 1) (Scope 1, 2) (Scope 1) absolute financed emissions metrics in two ways: targets closer to the target year. * Includes project finance for 2021. • Committed funds: the capital available to ** Includes project finance for 2020 and 2021. Citi plans to review our emissions reductions *** Adjusting for EVIC fluctuations, the normalized result is 113.8 million mt CO2e. a client for a certain use targets periodically, post 2025, as the energy Citi 2022 ESG Report Page 28
 Global ESG Report 2022 Citi Bookmarked Page 27 Page 29