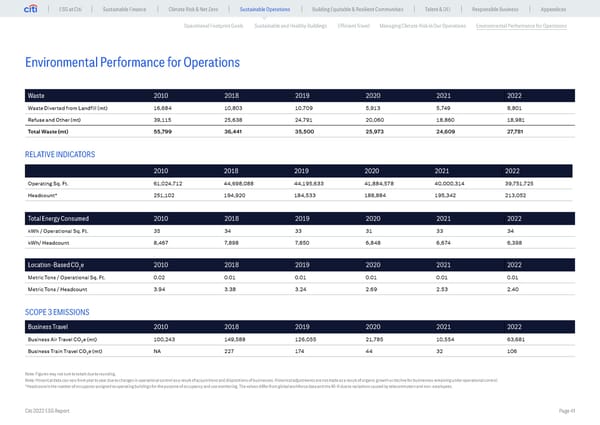
ESG at Citi Sustainable Finance Climate Risk & Net Zero Sustainable Operations Building Equitable & Resilient Communities Talent & DEI Responsible Business Appendices Operational Footprint Goals Sustainable and Healthy Buildings Efficient Travel Managing Climate Risk in Our Operations Environmental Performance for Operations Environmental Performance for Operations Waste 2010 2018 2019 2020 2021 2022 Waste Diverted from Landfill (mt) 16,684 10,803 10,709 5,913 5,749 8,801 Refuse and Other (mt) 39,115 25,638 24,791 20,060 18,860 18,981 Total Waste (mt) 55,799 36,441 35,500 25,973 24,609 27,781 RELATIVE INDICATORS 2010 2018 2019 2020 2021 2022 Operating Sq. Ft. 61,024,712 44,698,088 44,195,633 41,884,578 40,000,314 39,751,725 Headcount* 251,102 194,920 184,533 188,884 195,342 213,052 Total Energy Consumed 2010 2018 2019 2020 2021 2022 kWh / Operational Sq. Ft. 35 34 33 31 33 34 kWh/ Headcount 8,467 7,898 7,850 6,848 6,674 6,398 Location-Based CO e 2010 2018 2019 2020 2021 2022 2 Metric Tons / Operational Sq. Ft. 0.02 0.01 0.01 0.01 0.01 0.01 Metric Tons / Headcount 3.94 3.38 3.24 2.69 2.53 2.40 SCOPE 3 EMISSIONS Business Travel 2010 2018 2019 2020 2021 2022 Business Air Travel CO2e (mt) 100,243 149,588 126,055 21,785 10,554 63,681 Business Train Travel CO2e (mt) NA 227 174 44 32 106 Note: Figures may not sum to totals due to rounding. Note: Historical data can vary from year to year due to changes in operational control as a result of acquisitions and dispositions of businesses. Historical adjustments are not made as a result of organic growth or decline for businesses remaining under operational control. *Headcount is the number of occupants assigned to operating buildings for the purpose of occupancy and use monitoring. The values differ from global workforce data and the 10-K due to variations caused by telecommuters and non-employees. Citi 2022 ESG Report Page 41
 Global ESG Report 2022 Citi Bookmarked Page 40 Page 42