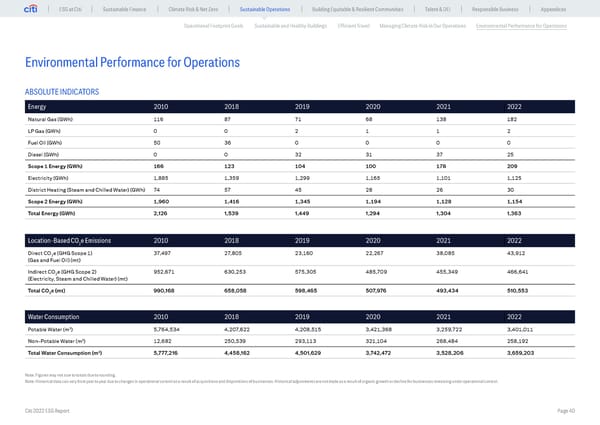
ESG at Citi Sustainable Finance Climate Risk & Net Zero Sustainable Operations Building Equitable & Resilient Communities Talent & DEI Responsible Business Appendices Operational Footprint Goals Sustainable and Healthy Buildings Efficient Travel Managing Climate Risk in Our Operations Environmental Performance for Operations Environmental Performance for Operations ABSOLUTE INDICATORS Energy 2010 2018 2019 2020 2021 2022 Natural Gas (GWh) 116 87 71 68 138 182 LP Gas (GWh) 0 0 2 1 1 2 Fuel Oil (GWh) 50 36 0 0 0 0 Diesel (GWh) 0 0 32 31 37 25 Scope 1 Energy (GWh) 166 123 104 100 176 209 Electricity (GWh) 1,885 1,359 1,299 1,165 1,101 1,125 District Heating (Steam and Chilled Water) (GWh) 74 57 45 28 26 30 Scope 2 Energy (GWh) 1,960 1,416 1,345 1,194 1,128 1,154 Total Energy (GWh) 2,126 1,539 1,449 1,294 1,304 1,363 Location-Based CO e Emissions 2010 2018 2019 2020 2021 2022 2 Direct CO2e (GHG Scope 1) 37,497 27,805 23,160 22,267 38,085 43,912 (Gas and Fuel Oil) (mt) Indirect CO2e (GHG Scope 2) 952,671 630,253 575,305 485,709 455,349 466,641 (Electricity, Steam and Chilled Water) (mt) Total CO2e (mt) 990,168 658,058 598,465 507,976 493,434 510,553 Water Consumption 2010 2018 2019 2020 2021 2022 3 Potable Water (m ) 5,764,534 4,207,622 4,208,515 3,421,368 3,259,722 3,401,011 3 Non-Potable Water (m ) 12,682 250,539 293,113 321,104 268,484 258,192 Total Water Consumption (m3) 5,777,216 4,458,162 4,501,629 3,742,472 3,528,206 3,659,203 Note: Figures may not sum to totals due to rounding. Note: Historical data can vary from year to year due to changes in operational control as a result of acquisitions and dispositions of businesses. Historical adjustments are not made as a result of organic growth or decline for businesses remaining under operational control. Citi 2022 ESG Report Page 40
 Global ESG Report 2022 Citi Bookmarked Page 39 Page 41