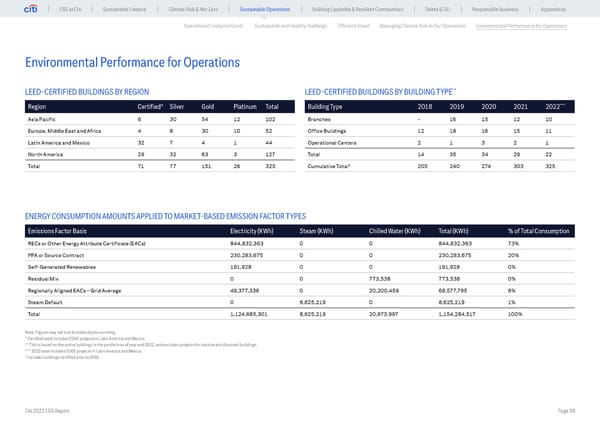
ESG at Citi Sustainable Finance Climate Risk & Net Zero Sustainable Operations Building Equitable & Resilient Communities Talent & DEI Responsible Business Appendices Operational Footprint Goals Sustainable and Healthy Buildings Efficient Travel Managing Climate Risk in Our Operations Environmental Performance for Operations Environmental Performance for Operations ** LEED-CERTIFIED BUILDINGS BY REGION LEED-CERTIFIED BUILDINGS BY BUILDING TYPE Region Certified* Silver Gold Platinum Total Building Type 2018 2019 2020 2021 2022*** Asia Pacific 6 30 54 12 102 Branches – 16 15 12 10 Europe, Middle East and Africa 4 8 30 10 52 Office Buildings 12 18 16 15 11 Latin America and Mexico 32 7 4 1 44 Operational Centers 2 1 3 2 1 North America 29 32 63 3 127 Total 14 35 34 29 22 Total 71 77 151 26 325 Cumulative Total† 205 240 274 303 325 ENERGY CONSUMPTION AMOUNTS APPLIED TO MARKET-BASED EMISSION FACTOR TYPES Emissions Factor Basis Electricity (KWh) Steam (KWh) Chilled Water (KWh) Total (KWh) % of Total Consumption RECs or Other Energy Attribute Certificate (EACs) 844,832,363 0 0 844,832,363 73% PPA or Source Contract 230,283,675 0 0 230,283,675 20% Self-Generated Renewables 191,928 0 0 191,928 0% Residual Mix 0 0 773,538 773,538 0% Regionally Aligned EACs – Grid Average 49,377,336 0 20,200,459 69,577,795 6% Steam Default 0 8,625,219 0 8,625,219 1% Total 1,124,685,301 8,625,219 20,973,997 1,154,284,517 100% Note: Figures may not sum to totals due to rounding. * Certified total includes EDGE projects in Latin America and Mexico. ** This is based on the active buildings in the portfolio as of year end 2022, and excludes projects for inactive and disposed buildings. *** 2022 total includes EDGE projects in Latin America and Mexico. † Includes buildings certified prior to 2018. Citi 2022 ESG Report Page 39
 Global ESG Report 2022 Citi Bookmarked Page 38 Page 40