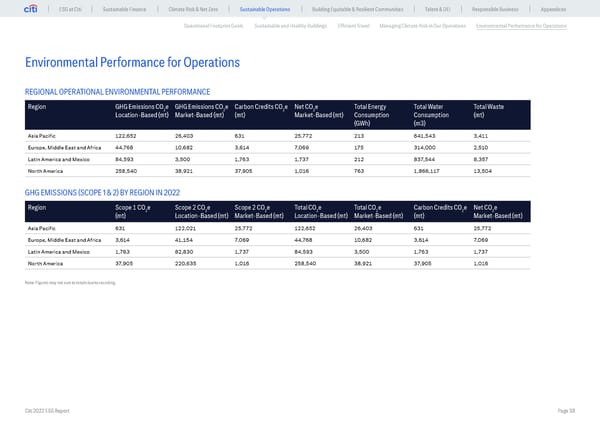
ESG at Citi Sustainable Finance Climate Risk & Net Zero Sustainable Operations Building Equitable & Resilient Communities Talent & DEI Responsible Business Appendices Operational Footprint Goals Sustainable and Healthy Buildings Efficient Travel Managing Climate Risk in Our Operations Environmental Performance for Operations Environmental Performance for Operations REGIONAL OPERATIONAL ENVIRONMENTAL PERFORMANCE Region GHG Emissions CO e GHG Emissions CO e Carbon Credits CO e Net CO e Total Energy Total Water Total Waste 2 2 2 2 Location-Based (mt) Market-Based (mt) (mt) Market-Based (mt) Consumption Consumption (mt) (GWh) (m3) Asia Pacific 122,652 26,403 631 25,772 213 641,543 3,411 Europe, Middle East and Africa 44,768 10,682 3,614 7,069 175 314,000 2,510 Latin America and Mexico 84,593 3,500 1,763 1,737 212 837,544 8,357 North America 258,540 38,921 37,905 1,016 763 1,866,117 13,504 GHG EMISSIONS (SCOPE 1 & 2) BY REGION IN 2022 Region Scope 1 CO e Scope 2 CO e Scope 2 CO e Total CO e Total CO e Carbon Credits CO e Net CO e 2 2 2 2 2 2 2 (mt) Location-Based (mt) Market-Based (mt) Location-Based (mt) Market-Based (mt) (mt) Market-Based (mt) Asia Pacific 631 122,021 25,772 122,652 26,403 631 25,772 Europe, Middle East and Africa 3,614 41,154 7,069 44,768 10,682 3,614 7,069 Latin America and Mexico 1,763 82,830 1,737 84,593 3,500 1,763 1,737 North America 37,905 220,635 1,016 258,540 38,921 37,905 1,016 Note: Figures may not sum to totals due to rounding. Citi 2022 ESG Report Page 38
 Global ESG Report 2022 Citi Bookmarked Page 37 Page 39