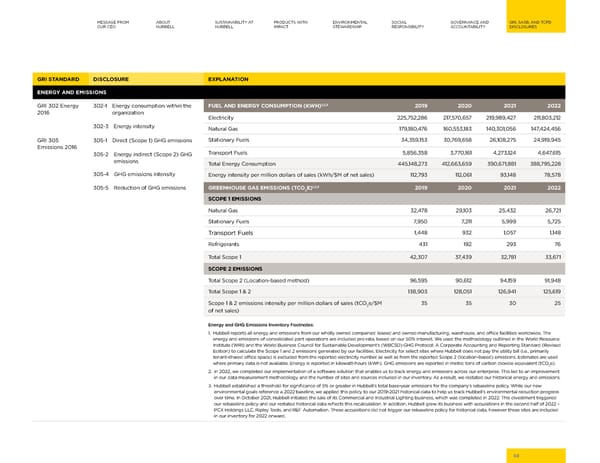
MESSAGE FROM ABOUT SUSTAINABILITY AT PRODUCTS WITH ENVIRONMENTAL SOCIAL GOVERNANCE AND GRI, SASB, AND TCFD OUR CEO HUBBELL HUBBELL IMPACT STEWARDSHIP RESPONSIBILITY ACCOUNTABILITY DISCLOSURES GRI STANDARD DISCLOSURE EXPLANATION ENERGY AND EMISSIONS 1,2,3 GRI 302 Energy 302-1 Energy consumption within the FUEL AND ENERGY CONSUMPTION (KWH) 2019 2020 2021 2022 2016 organization Electricity 225,752,286 217,570,657 219,989,427 211,803,212 302-3 Energy intensity Natural Gas 179,180,476 160,553,183 140,301,056 147,424,456 GRI 305 305-1 Direct (Scope 1) GHG emissions Stationary Fuels 34,359,153 30,769,658 26,108,275 24,919,945 Emissions 2016 305-2 Energy indirect (Scope 2) GHG Transport Fuels 5,856,358 3,770,161 4,273,124 4,647,615 emissions Total Energy Consumption 445,148,273 412,663,659 390,671,881 388,795,228 305-4 GHG emissions intensity Energy intensity per million dollars of sales (kWh/$M of net sales) 112,793 112,061 93,148 78,578 305-5 Reduction of GHG emissions GREENHOUSE GAS EMISSIONS (TCO E)1,2,3 2019 2020 2021 2022 2 SCOPE 1 EMISSIONS Natural Gas 32,478 29,103 25,432 26,721 Stationary Fuels 7,950 7,211 5,999 5,725 Transport Fuels 1,448 932 1,057 1,148 Refrigerants 431 192 293 76 Total Scope 1 42,307 37,439 32,781 33,671 SCOPE 2 EMISSIONS Total Scope 2 (Location-based method) 96,595 90,612 94,159 91,948 Total Scope 1 & 2 138,903 128,051 126,941 125,619 Scope 1 & 2 emissions intensity per million dollars of sales (tCO e/$M 35 35 30 25 2 of net sales) Energy and GHG Emissions Inventory Footnotes: 1. Hubbell reports all energy and emissions from our wholly owned companies’ leased and owned manufacturing, warehouse, and o昀케ce facilities worldwide. The energy and emissions of consolidated joint operations are included pro rata, based on our 50% interest. We used the methodology outlined in the World Resource Institute (WRI) and the World Business Council for Sustainable Development’s (WBCSD) GHG Protocol: A Corporate Accounting and Reporting Standard (Revised Edition) to calculate the Scope 1 and 2 emissions generated by our facilities. Electricity for select sites where Hubbell does not pay the utility bill (i.e., primarily tenant-shared o昀케ce space) is excluded from the reported electricity number as well as from the reported Scope 2 (location-based) emissions. Estimates are used where primary data is not available. Energy is reported in kilowatt-hours (kWh). GHG emissions are reported in metric tons of carbon dioxide equivalent (tCO e). 2 2. In 2022, we completed our implementation of a software solution that enables us to track energy and emissions across our enterprise. This led to an improvement in our data measurement methodology and the number of sites and sources included in our inventory. As a result, we restated our historical energy and emissions. 3. Hubbell established a threshold for signi昀椀cance of 5% or greater in Hubbell’s total base-year emissions for the company’s rebaseline policy. While our new environmental goals reference a 2022 baseline, we applied this policy to our 2019-2021 historical data to help us track Hubbell’s environmental reduction progress over time. In October 2021, Hubbell initiated the sale of its Commercial and Industrial Lighting business, which was completed in 2022. This divestment triggered our rebaseline policy and our restated historical data re昀氀ects this recalculation. In addition, Hubbell grew its business with acquisitions in the second half of 2022 - PCX Holdings LLC, Ripley Tools, and REF Automation. These acquisitions did not trigger our rebaseline policy for historical data, however these sites are included in our inventory for 2022 onward. 68
 Hubbell 2023 Sustainability Report Page 67 Page 69