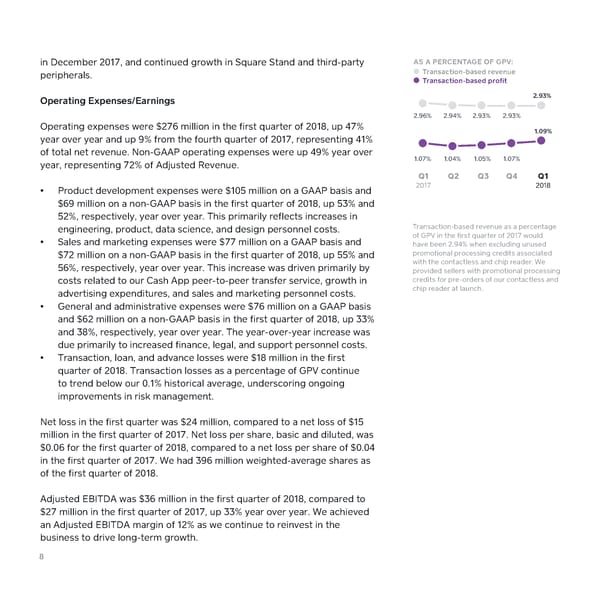
in December 2017, and continued growth in Square Stand and third-party AS A PERCENTAGE OF GPV: peripherals. Transaction-based revenue Transaction-based profit Operating Expenses/Earnings 2.93% 2.96% 2.94% 2.93% 2.93% Operating expenses were $276 million in the first quarter of 2018, up 47% 1.09% year over year and up 9% from the fourth quarter of 2017, representing 41% of total net revenue. Non-GAAP operating expenses were up 49% year over year, representing 72% of Adjusted Revenue. 1.07% 1.04% 1.05% 1.07% Q1 Q2 Q3 Q4 Q1 • Product development expenses were $105 million on a GAAP basis and 2017 2018 $69 million on a non-GAAP basis in the first quarter of 2018, up 53% and 52%, respectively, year over year. This primarily reflects increases in engineering, product, data science, and design personnel costs. Transaction-based revenue as a percentage • Sales and marketing expenses were $77 million on a GAAP basis and of GPV in the first quarter of 2017 would have been 2.94% when excluding unused $72 million on a non-GAAP basis in the first quarter of 2018, up 55% and promotional processing credits associated 56%, respectively, year over year. This increase was driven primarily by with the contactless and chip reader. We provided sellers with promotional processing costs related to our Cash App peer-to-peer transfer service, growth in credits for pre-orders of our contactless and advertising expenditures, and sales and marketing personnel costs. chip reader at launch. • General and administrative expenses were $76 million on a GAAP basis and $62 million on a non-GAAP basis in the first quarter of 2018, up 33% and 38%, respectively, year over year. The year-over-year increase was due primarily to increased finance, legal, and support personnel costs. • Transaction, loan, and advance losses were $18 million in the first quarter of 2018. Transaction losses as a percentage of GPV continue to trend below our 0.1% historical average, underscoring ongoing improvements in risk management. Net loss in the first quarter was $24 million, compared to a net loss of $15 million in the first quarter of 2017. Net loss per share, basic and diluted, was $0.06 for the first quarter of 2018, compared to a net loss per share of $0.04 in the first quarter of 2017. We had 396 million weighted-average shares as of the first quarter of 2018. Adjusted EBITDA was $36 million in the first quarter of 2018, compared to $27 million in the first quarter of 2017, up 33% year over year. We achieved an Adjusted EBITDA margin of 12% as we continue to reinvest in the business to drive long-term growth. 8
 2018 Q1 Shareholder Letter — Square Page 7 Page 9