American Express ESG Report
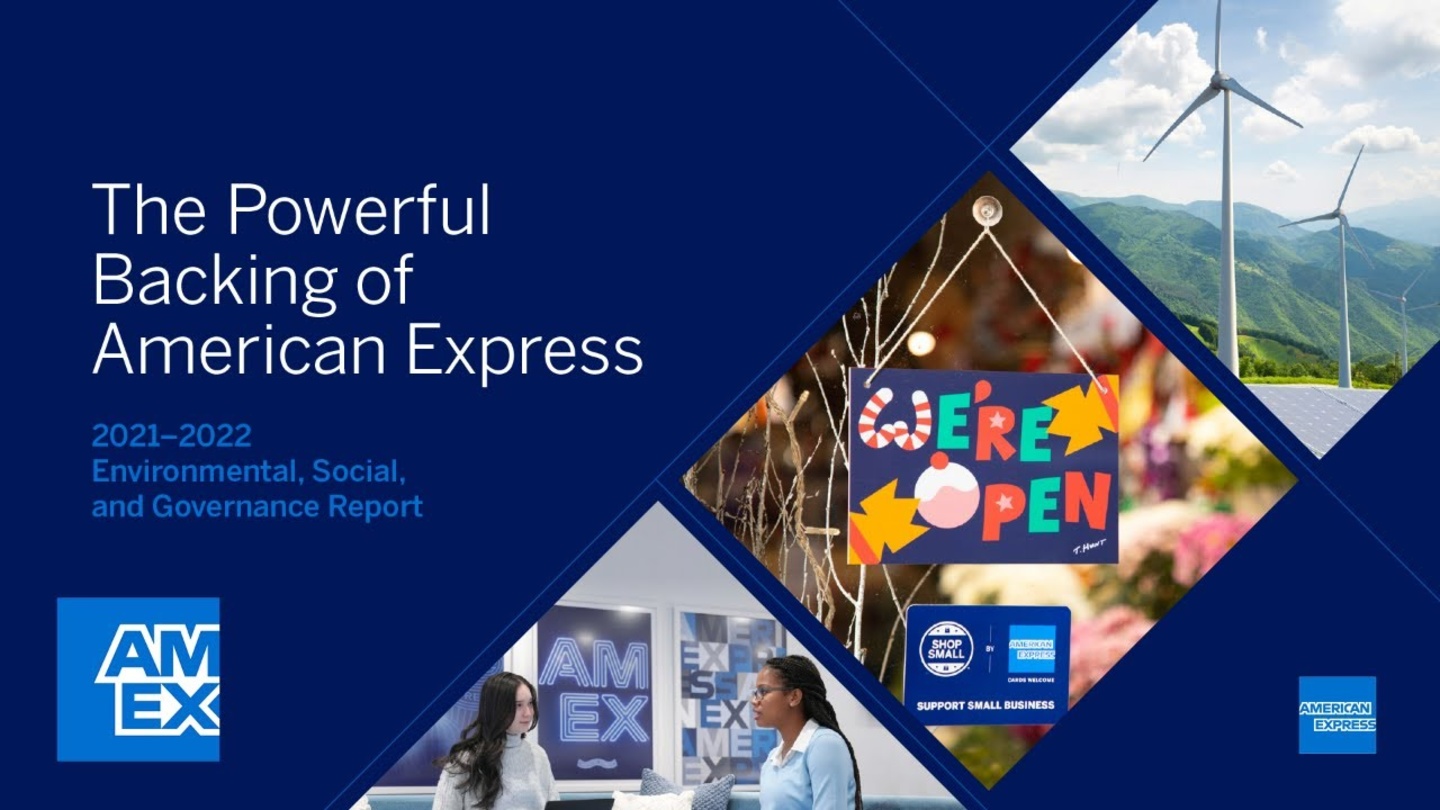
The Powerful Backing of American Express 2021–2022 Environmental, Social, and Governance Report
TABLE OF CONTENTS 3 About This Report 4 A Message From Our Chairman and CEO 8 Our Commitment to ESG 10 Our ESG Objectives and Goals 1 1 Aligning Our Community Giving Priorities to Our ESG Strategy 12 Our Inaugural $1 Billion ESG Bond 13 Responding to Global Events 15 Amex Flex: Our New Way of Working 17 Awards and Recognition 18 Advancing the United Nations Sustainable Development Goals 19 Promoting Diversity, Equity, and Inclusion 20 Our Vision for Promoting Diversity, Equity, and Inclusion 2 1 Progress and Highlights 23 Supporting Our Colleagues, Customers, and Communities 24 Backing Our Colleagues 32 Backing Our Customers and Partners 35 Backing Our Communities 38 Advancing Climate Solutions 39 Our Vision for Advancing Climate Solutions 40 Progress and Highlights 41 Minimizing Our Climate Impact 43 Moving to Net-Zero 48 Backing Our Colleagues 50 Backing Our Customers and Partners 53 Backing Our Communities 56 Building Financial Confidence 57 Our Vision for Building Financial Confidence 58 Progress and Highlights 59 Building Financial Confidence and Resilience for Our Colleagues, Customers, and Communities 60 Backing Our Colleagues 62 Backing Our Customers and Partners 69 Backing Our Communities 76 Our ESG Governance and Operating Responsibly 78 Our Corporate Governance Framework 79 ESG Governance 81 ESG and Executive Compensation 82 Our Business Ethics 84 Data Protection and Privacy 85 Risk Management 86 Responsible Sourcing Throughout the Global Supply Chain 87 Prioritizing Colleagues’ Health, Safety, and Well-being 88 Responsible Lending 89 Supporting Data: Our Commitment to Transparency 93 Workforce Diversity and EEO-1 Data 96 Environmental Performance Data Summary 100 Limited Assurance Statement of GHG Emissions 103 Indexes TCFD Index SASB Index GRI Content Index
ABOUT THIS REPORT This report covers calendar year 2021 and provides qualitative and quantitative information on our approach to managing our Environmental, Social, and Governance (ESG) opportunities and risks. In some cases, we also share highlights from programs and initiatives that were launched in 2022 to provide more up-to-date information to our stakeholders. When we use the terms “American Express,” “company,” “we,” “us,” or “our” in this report, we mean the American Express Company and its subsidiaries, on a consolidated basis, unless we state, or the context implies, otherwise. Reporting guidelines and content This report follows the Global Reporting Initiative (GRI), Sustainability Accounting Standards Board (SASB), and Task Force on Climate-Related Financial Disclosures (TCFD) reporting guidelines with respect to our priority ESG issues. GRI, SASB, and TCFD indexes can be found in the Supporting Data section of the report. In this report, the use of the term “materiality” and other similar terms is intended to reflect our priority ESG issues. We are not using such terms as they are used under the securities or other laws of the United States or any other jurisdiction or as these terms are used in the context of financial statements and financial reporting. We report on ESG issues that pertain to us through this ESG report and the American Express Corporate Sustainability website . Additional information about our company can be found through our Diversity, Equity, and Inclusion (DE&I) Report , submissions to the CDP (formerly Carbon Disclosure Project), in our annual and quarterly reports and our proxy statement on file with the U.S. Securities and Exchange Commission and on the American Express Investor Relations website . Links and references included throughout the report provide direction on where to find additional information. This report includes forward-looking statements within the meaning of the Private Securities Litigation Reform Act of 1995 which are subject to risks and uncertainties. The forward-looking statements, including the company’s aspirational ESG commitments and goals, contain words such as “believe,” “expect,” “anticipate,” “intend,” “plan,” “aim,” “will,” “may,” “should,” “could,” “would,” “likely,” “potential,” “commit,” “continue,” or other similar expressions. Actual results may differ from those set forth in the forward-looking statements due to a variety of factors, including: competition, brand perceptions and reputation; an inability to develop and market value propositions that appeal to Card Members and new customers; the amount and efficacy of investments in product innovations, resources, marketing campaigns and programs; changing customer behaviors, interest in the company’s products, resources and programs, and willingness to access capital provided by the company, spend money at small businesses, and value environmentally and socially responsible products and services; management’s inability to identify suitable suppliers, grantees, partners and community investments and negotiate acceptable terms; the actual amount the company spends with suppliers, on ESG initiatives and to make appropriate salary adjustments, all while implementing operating expense control initiatives; an inability to build partnerships and execute programs with other companies and of partners to meet their obligations to the company; changes in developing standards and certifications; the cost and availability of renewable energy, carbon removal and carbon offset projects, energy attribute certificates, certified paper, and green buildings, and alternatives to single-use plastic; supply chain and market disruption; regulation; potential M&A activity; severe weather conditions, natural disasters and other catastrophic events; changes in the company’s real estate, technology, colleague and community engagement, and risk management strategies; an inability of waste management systems to divert waste to recycling and composting facilities; and changes in economic or business conditions and the company’s ability to grow, improve its financial performance and execute on its strategies. A further description of these and other risks and uncertainties can be found in the company’s Annual Report on Form 10-K for the year ended December 31, 2021 (the “2021 Annual Report”), the company’s Quarterly Report on Form 10-Q for the quarter ended June 30, 2022, and the company’s other filings with the U.S. Securities and Exchange Commission. You are cautioned not to place undue reliance on these forward-looking statements, which speak only as of the date on which they are made. We undertake no obligation to update or revise any forward-looking statements. Data in this report reflect estimates using methodologies and assumptions, which may change in the future as a result of new information or subsequent developments. Statements regarding the company’s future direction and intent are subject to change or withdrawal without notice and represent goals and objectives only. This report includes trademarks, such as American Express®, which are protected under applicable intellectual property laws and are the property of the American Express Company or its subsidiaries. Solely for convenience, our trademarks and trade names referred to in this report may appear without the ® or TM symbols, but such references are not intended to indicate, in any way, that we will not assert, to the fullest extent under applicable law, our rights or the right of the applicable licensor to these trademarks and trade names. 3
A MESSAGE FROM OUR CHAIRMAN AND CEO “ Our strength comes from the impact we can make on people’s lives—or what we call “the powerful backing of American Express”— and our ESG strategy is a natural extension of this.” — STEPHEN J. SQUERI CHAIRMAN AND CHIEF EXECUTIVE OFFICER American Express is built on trust, integrity, and service excellence. Living up to this legacy means doing what is right for our colleagues, customers, and communities. Our strength comes from the impact we can make on people’s lives—or what we call “the powerful backing of American Express”—and our ESG strategy is a natural extension of this. The myriad of challenges facing the world today, many unprecedented in our lifetime, underscore the importance of our powerful backing promise. We are now over two years into navigating the pandemic; the effects of climate change are more apparent than ever; macroeconomic and geopolitical instability is on the rise; and, just in the last few months, we have witnessed the war in Ukraine unfold into a devastating humanitarian crisis. Against this backdrop, we continue to back our colleagues, customers, and communities to drive positive impact. INTRODUCTION PROMOTING DE&I ADVANCING CLIMATE SOLUTIONS BUILDING FINANCIAL CONFIDENCE OUR ESG GOVERNANCE & OPERATING RESPONSIBLY SUPPORTING DATA OUR COMMITMENT TO ESG 4
As the way we live and work has evolved with the pandemic, we have been focused on creating a new work model that supports our colleagues. In March 2022, we officially launched Amex Flex, our new way of working that provides colleagues with the flexibility to work full time in the office, fully virtually, or a hybrid of both. Amex Flex is designed to recapture the creativity and collaboration of working together in person, while also retaining the agility and productivity we were able to achieve in a virtual environment during the pandemic. This approach also enables us to broaden the talent pool we can attract and strengthen retention as we provide colleagues with a compelling value proposition that offers choice, leading benefits, competitive compensation, and opportunities for growth and career advancement. Our colleagues are critical to our success, and they are the driving force behind the impact we make in people’s lives and in the communities we serve. I am exceptionally proud of what we achieved to date on our ESG strategy, thanks to the dedication of our colleagues around the world who bring our company’s purpose to life. Advancing Our ESG Priorities We announced our ESG framework in 2020, centered around three core priorities: Promote Diversity, Equity, and Inclusion (DE&I); Advance Climate Solutions; and Build Financial Confidence . Since then, we have solidified our strategy by developing a clear roadmap to translate our objectives into action. Promote Diversity, Equity, and Inclusion (DE&I) We are continuing to strengthen our culture of inclusion and belonging across the company and providing transparency into our efforts. In 2021, we published our inaugural DE&I Report, which included detailed disclosures on diversity representation among colleagues and our ongoing efforts to maintain a diverse and equitable workplace through inclusive hiring, career growth, retention, and equal pay practices. In addition to sharing our progress across these areas in 2021, in this report we have included additional details related to representation of our ethnically and racially diverse colleagues in the US. We also exceeded $1 billion in spending toward our DE&I Action Plan announced in October 2020. The plan supported our efforts to increase spending with underrepresented-owned suppliers, expanding access to capital and financial education and partnering with nonprofit organizations focused on promoting equality, among other initiatives. To build on this momentum, I am pleased to announce an additional $3 billion—which means we now aim to spend $4 billion in total from late 2020 through 2025—toward our DE&I Action Plan and initiatives globally. The majority of additional spending will continue to be allocated with suppliers. INTRODUCTION PROMOTING DE&I ADVANCING CLIMATE SOLUTIONS BUILDING FINANCIAL CONFIDENCE OUR ESG GOVERNANCE & OPERATING RESPONSIBLY SUPPORTING DATA OUR COMMITMENT TO ESG 5
Advance Climate Solutions We are focused on advancing solutions that address the climate crisis by minimizing our carbon footprint and helping our customers and communities do the same. Last year marked an important step forward for us, as we committed to net-zero emissions by 2035, in alignment with the Science Based Target initiative (SBTi), building on our CarbonNeutral® operations powered by 100% renewable electricity since 2018. To reduce our environmental impact across our global real estate portfolio, we have spent more than $150 million since 2019 on the development of facilities that have received green building certification. In addition to these investments, we have a goal to provide at least $10 million toward philanthropic efforts for climate action as part of our new community giving category: Backing Low-Carbon Communities. We have already pledged over $3 million in grants to support climate and nature-based solutions. Last November, at the UN Climate Change Conference of the Parties (COP26), we joined the World Economic Forum’s Clean Skies for Tomorrow Coalition and Global Future Council on Sustainable Tourism to help promote sustainable travel practices. In addition, during Earth Month 2022, we announced several new low-carbon solutions in line with our 2022 goal. These included new digital tools to help corporate clients better understand and manage their carbon footprint, such as a Carbon Footprint Dashboard and a Carbon Offset Referral Suite. We also announced a goal of having the vast majority of plastic cards issued by American Express made of at least 70% recycled or reclaimed plastic by the end of 2024. We have already begun expanding our offerings to integrate recycled plastic into our cards worldwide, starting with Canada and France. Build Financial Confidence Rooted in our company’s purpose is helping people achieve their aspirations, not only through our differentiated products and services, but also through our investments to strengthen the financial well-being, security, and resilience of our communities. As a longstanding champion of small businesses, we continue to support business owners globally as they navigate new challenges from inflation, supply chain disruptions, and labor shortages, in addition to the ongoing impacts from the pandemic. Our Shop Small campaign is foundational to these efforts. Since 2020, we spent more than $300 million toward campaign initiatives to help jumpstart spending at small businesses. In November 2021, we held our 12th annual Small Business Saturday event, which reached an all-time high of $23.3 billion in estimated consumer spending at small businesses in the US. 1 Consumers reported spending an estimated £598 million at small businesses in the UK on Small Business Saturday held on December 4, 2021, 2 and both campaigns contributed toward our goal to drive $100 billion in consumer spending at small businesses through 2025. We also launched a new community giving category for building financial confidence, “Backing Small,” which supports small businesses by bringing together all our grant programs focused on supporting small business. We have already pledged $17 million to support Backing Small programs, including Inclusive Backing, in partnership with Main Street America, focused on underrepresented and economically vulnerable business-owners, and the second year of our Backing Historic Small Restaurants program across the US in 2022. Our new Backing International Small Restaurants program with the International Downtown Association is expanding our support beyond the US by helping culturally significant, independent restaurants operated by underserved populations and those in economic need in five major cities: London, Mexico City, Sydney, Tokyo, and Toronto. We also deepened our focus on financial literacy, training, and mentoring programs for individuals and business owners through our community giving. Building on our longstanding partnership with Junior Achievement, we plan to offer bespoke financial literacy education and programs to more than 5,000 students in 11 countries, focusing on underrepresented and underserved communities, through JA Worldwide. 1. The American Express 2021 Small Business Saturday Consumer Insights Survey was conducted by Teneo on behalf of American Express and the National Federation of Independent Business (NFIB). The study is a nationally representative sample of 2,426 U.S. adults 18 years of age or older. The sample was collected using an email invitation and an online survey. The study gathered self-reported data and does not reflect actual receipts or sales. It was conducted anonymously on November 28, 2021. The survey has an overall margin of error of +/- 2.0%, at the 95% level of confidence. Projections are based on the current U.S. Census estimates of the U.S. adult population, age 18 years and over. 2. Estimated spend based on data collected from 4000 UK adults polled by Opinium between 5pm on Saturday 4 December 2021 and 10pm on Sunday 5 December 2021. The £598 million figure for national spending calculated using ONS estimation of the UK adult population based on self-reported shopper estimates of spend and does not reflect actual receipts or sales. INTRODUCTION PROMOTING DE&I ADVANCING CLIMATE SOLUTIONS BUILDING FINANCIAL CONFIDENCE OUR ESG GOVERNANCE & OPERATING RESPONSIBLY SUPPORTING DATA OUR COMMITMENT TO ESG 6
In May 2022, we issued our inaugural $1 billion ESG Bond, which we will use to finance new and existing Green and Social projects. This is our first-ever financing instrument dedicated to support our ESG strategy and will serve to advance our programs and promote ESG-related investments. Enhancing Our ESG Governance In addition to progressing on our ESG goals, we have been focused on the governance and disclosures around our ESG strategy and programs. In 2022, we incorporated ESG risks, including climate-related risks, as an emerging risk for the Company within our Enterprise Risk Management framework. To help manage our climate-related risks, in 2021, we became a formal supporter of the Task Force on Climate-Related Financial Disclosures (TCFD) and assessed physical and transition risks to our business in alignment with the TCFD recommendations. Conclusion Over the last two years we have created more opportunities to collaborate and innovate across the enterprise and we have done a significant amount of work to define our ESG priorities and objectives. We also established measurable goals and action plans to achieve them as we continue to execute across each of our three ESG pillars. All of this work has accelerated our progress and put us on a clear path to strengthen our global impact in the coming years. Our work has only just begun. As we look ahead, we will continue to build on our momentum, putting our ESG strategy into action to back our colleagues, customers, and communities and make a positive impact in people’s lives and the world we live in. STEPHEN J. SQUERI CHAIRMAN AND CHIEF EXECUTIVE OFFICER INTRODUCTION PROMOTING DE&I ADVANCING CLIMATE SOLUTIONS BUILDING FINANCIAL CONFIDENCE OUR ESG GOVERNANCE & OPERATING RESPONSIBLY SUPPORTING DATA OUR COMMITMENT TO ESG 7
Our Commitment to ESG 10 Our ESG Objectives and Goals 11 Aligning Our Community Giving Priorities to Our ESG Strategy 12 Our Inaugural $1 Billion ESG Bond 13 Responding to Global Events 15 Amex Flex: Our New Way of Working 17 Awards and Recognition 18 Advancing the United Nations Sustainable Development Goals
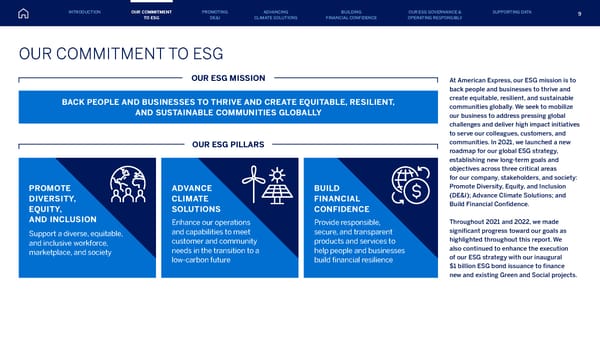
At American Express, our ESG mission is to back people and businesses to thrive and create equitable, resilient, and sustainable communities globally. We seek to mobilize our business to address pressing global challenges and deliver high impact initiatives to serve our colleagues, customers, and communities. In 2021, we launched a new roadmap for our global ESG strategy, establishing new long-term goals and objectives across three critical areas for our company, stakeholders, and society: Promote Diversity, Equity, and Inclusion (DE&I); Advance Climate Solutions; and Build Financial Confidence. Throughout 2021 and 2022, we made significant progress toward our goals as highlighted throughout this report. We also continued to enhance the execution of our ESG strategy with our inaugural $1 billion ESG bond issuance to finance new and existing Green and Social projects. OUR COMMITMENT TO ESG OUR ESG MISSION BACK PEOPLE AND BUSINESSES TO THRIVE AND CREATE EQUITABLE, RESILIENT, AND SUSTAINABLE COMMUNITIES GLOBALLY OUR ESG PILLARS ADVANCE CLIMATE SOLUTIONS Enhance our operations and capabilities to meet customer and community needs in the transition to a low-carbon future BUILD FINANCIAL CONFIDENCE Provide responsible, secure, and transparent products and services to help people and businesses build financial resilience PROMOTE DIVERSITY, EQUITY, AND INCLUSION Support a diverse, equitable, and inclusive workforce, marketplace, and society 9 INTRODUCTION PROMOTING DE&I ADVANCING CLIMATE SOLUTIONS BUILDING FINANCIAL CONFIDENCE OUR ESG GOVERNANCE & OPERATING RESPONSIBLY SUPPORTING DATA OUR COMMITMENT TO ESG
OUR ESG OBJECTIVES AND GOALS Enhance diverse representation, equal opportunity, and an inclusive culture at all levels of the company Meet the needs of underrepresented businesses and consumers and develop more inclusive marketing initiatives Advance racial equality and social justice in our communities • Maintain 100% pay equity across genders globally and across races and ethnicities in the US • Double annual spend with underrepresented-owned suppliers in the US from a 2019 baseline to $750 million by the end of 2024, including increasing spend with Black-owned suppliers to at least $100 million annually • Provide access to capital and financial education to at least 250,000 underrepresented-owned small- and medium-sized businesses in the US from late 2020 through 2024 • Develop more inclusive marketing initiatives, as well as design and build product experiences and programs that better meet the needs of underrepresented consumer and business customers • Provide $50 million in grants from late 2020 through 2024 to nonprofits focused on addressing inequality and promoting social justice, including those led by members of underrepresented groups • Increase the representation of American Express Leadership Academy participants in the US who are from underrepresented groups from 50% in 2019 to 75% by the end of 2024 Minimize our climate impact and manage our climate-related risks and opportunities Enable our customers and partners to transition to a low- carbon economy through the development of new capabilities Support community programs and initiatives to help build more climate resilience and equitable communities • Commit to net-zero emissions by 2035 in alignment with the Science Based Targets initiative (SBTi) 1 • Enhance the management of climate-related risks and opportunities across the business • Pilot low-carbon product innovations, including carbon tracking and offset solutions by the end of 2022 • Provide at least $10 million to support initiatives, partnerships, and programs that address the adverse effects of climate change and pollution on communities from 2021 through 2025 • Engage our colleagues in sustainability initiatives through the Green2Gether program Empower individuals to build and maintain their financial well-being through products, services, tools, and education, while providing robust account security Strengthen the financial security and money management capacity of small businesses through products, services, campaigns, and initiatives Help build resilient communities through grants, programs, and initiatives that support economic empowerment and equity • Provide access to credit to at least 4 million individuals from underrepresented populations from 2021 through 2025 • Provide at least 5 million individuals with tools, resources, and educational content to improve financial well-being from 2021 through 2025 • Support small businesses, including by reaching $100 billion in spending by consumers at small, independently owned retailers or restaurants on Small Business Saturday and during other Shop Small campaigns from 2021 through 2025 2 • Invest $500 million to build more resilient and equitable communities from 2021 through 2025 1. American Express is following the methodology of the SBTi for our commitment to net-zero by 2035, which covers all Scope 1 and 2 emissions and a minimum of two-thirds of total Scope 3 emissions in conformance with the GHG Protocol Corporate Value Chain (Scope 3) Accounting and Reporting Standard. 2. Based on spend as reported by consumers in surveys commissioned by American Express (not actual receipts or sales). BUILD FINANCIAL CONFIDENCE PROMOTE DIVERSITY, EQUITY, AND INCLUSION ADVANCE CLIMATE SOLUTIONS 10 INTRODUCTION PROMOTING DE&I ADVANCING CLIMATE SOLUTIONS BUILDING FINANCIAL CONFIDENCE OUR ESG GOVERNANCE & OPERATING RESPONSIBLY SUPPORTING DATA OUR COMMITMENT TO ESG
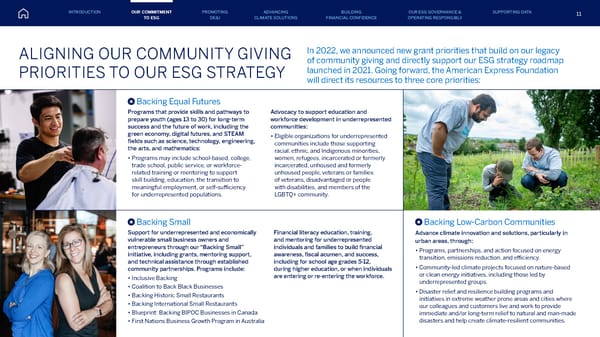
ALIGNING OUR COMMUNITY GIVING PRIORITIES TO OUR ESG STRATEGY In 2022, we announced new grant priorities that build on our legacy of community giving and directly support our ESG strategy roadmap launched in 2021. Going forward, the American Express Foundation will direct its resources to three core priorities: Backing Small Support for underrepresented and economically vulnerable small business owners and entrepreneurs through our “Backing Small” initiative, including grants, mentoring support, and technical assistance through established community partnerships. Programs include: • Inclusive Backing • Coalition to Back Black Businesses • Backing Historic Small Restaurants • Backing International Small Restaurants • Blueprint: Backing BIPOC Businesses in Canada • First Nations Business Growth Program in Australia Financial literacy education, training, and mentoring for underrepresented individuals and families to build financial awareness, fiscal acumen, and success, including for school age grades 5-12, during higher education, or when individuals are entering or re-entering the workforce. Backing Low-Carbon Communities Advance climate innovation and solutions, particularly in urban areas, through: • Programs, partnerships, and action focused on energy transition, emissions reduction, and efficiency. • Community-led climate projects focused on nature-based or clean energy initiatives, including those led by underrepresented groups. • Disaster relief and resilience building programs and initiatives in extreme weather prone areas and cities where our colleagues and customers live and work to provide immediate and/or long-term relief to natural and man-made disasters and help create climate-resilient communities. Backing Equal Futures Programs that provide skills and pathways to prepare youth (ages 13 to 30) for long-term success and the future of work, including the green economy, digital futures, and STEAM fields such as science, technology, engineering, the arts, and mathematics: • Programs may include school-based, college, trade school, public service, or workforce- related training or mentoring to support skill building, education, the transition to meaningful employment, or self-sufficiency for underrepresented populations. Advocacy to support education and workforce development in underrepresented communities: • Eligible organizations for underrepresented communities include those supporting racial, ethnic, and Indigenous minorities, women, refugees, incarcerated or formerly incarcerated, unhoused and formerly unhoused people, veterans or families of veterans, disadvantaged or people with disabilities, and members of the LGBTQ+ community. 11 INTRODUCTION PROMOTING DE&I ADVANCING CLIMATE SOLUTIONS BUILDING FINANCIAL CONFIDENCE OUR ESG GOVERNANCE & OPERATING RESPONSIBLY SUPPORTING DATA OUR COMMITMENT TO ESG
OUR INAUGURAL $1 BILLION ESG BOND In May 2022, American Express completed its first-ever ESG bond offering, maturing in 2029. We intend that an amount equivalent to the net proceeds of the $1 billion ESG bond will be allocated toward new and/or existing eligible projects in the Green and Social categories, as directed by the newly developed American Express Sustainable Financing Framework , which is aligned with the company’s global ESG strategy. Projects in the Green category include those related to green buildings, energy efficiency improvements and renewable energy, and the circular economy, such as expenditures related to updating American Express Cards to reclaimed or recycled plastics. Projects in the Social category include socioeconomic advancement and empowerment initiatives, such as expenditures and programs designed to drive economic growth among diverse groups through the procurement of products and services from diverse suppliers and vendors at least 51% owned by members of diverse populations, independently certified through a qualified agency. Other projects in the Social category include merchant support programs like our Shop Small campaign, financial empowerment programs, including support of the ByBlack platform to verify businesses as majority-owned by Black individuals, and community investments such as programs to enhance access to essential services and affordable housing. All net proceeds from the sustainable financing are expected to be fully allocated to eligible projects within two years of the date of issuance. Part I Introduction Part II Sustainable Financing Framework Part III Appendix Part IV Disclaimers The Powerful Backing of American Express April 2022 Sustainability Financing Framework Learn more by reading our newly developed American Express Sustainability Financing Framework , which is aligned with our global ESG strategy. 12 INTRODUCTION PROMOTING DE&I ADVANCING CLIMATE SOLUTIONS BUILDING FINANCIAL CONFIDENCE OUR ESG GOVERNANCE & OPERATING RESPONSIBLY SUPPORTING DATA OUR COMMITMENT TO ESG
RESPONDING TO GLOBAL EVENTS Our ESG strategy also guides our response to global events, including our support for community resilience and equity. SUPPORTING HUMANITARIAN RELIEF EFFORTS IN UKRAINE In light of the attacks on the Ukrainian people, we have taken several actions to support our colleagues, customers, and the humanitarian relief efforts in the region. For example, we teamed up with Hilton to donate up to one million hotel room nights in hotels across Europe to support Ukrainian refugees and first responders who are helping them. We also enabled our US Consumer, Small Business, and Corporate Card Members who are enrolled in the Membership Rewards® program to use their Membership Rewards to support select charities that are providing humanitarian relief efforts in Ukraine and affected parts of Europe and matched the dollar value of their contributions made using points with PayPal Giving Fund through June 15, 2022. We are continuing to match colleague donations through the American Express Match program. We also provided $1 million in aid to the following organizations that are providing assistance to impacted populations: • $250,000 to the International Rescue Committee (IRC) to provide necessary resources where they are needed most, including to those who have fled their homes. • $250,000 to the International Medical Corps (IMC), which has deployed mobile medical teams to provide essential emergency and primary health services, mental health and psychosocial support services, and COVID-19 awareness and prevention services to help keep affected populations safe from the pandemic. • $250,000 to the American Red Cross to support coordinated relief efforts by the International Federation of Red Cross and Red Crescent Societies and other Red Cross partners who are responding to urgent needs and providing technical assistance on the ground. • $250,000 toward UNICEF’s emergency appeal to support children and families as the crisis escalates with life-saving programs, safe water, emergency health, hygiene, education aid, and other immediate help for those in need of support. BACKING OUR COMMUNITIES WITH $1 BILLION+ TOWARD CHARITABLE CAUSES Since creating the American Express Foundation in 1954, we have provided more than $1 billion to charitable causes around the world through the Foundation and our Corporate Giving Program. In 2021, we provided $38 million in charitable giving globally, including grants from our company, the American Express Foundation, our Center for Community Development, and gift-matching programs. See our 2021 Community Giving Grants List to learn more about our American Express Foundation and company charitable giving in 2021. $1B+ 13 INTRODUCTION PROMOTING DE&I ADVANCING CLIMATE SOLUTIONS BUILDING FINANCIAL CONFIDENCE OUR ESG GOVERNANCE & OPERATING RESPONSIBLY SUPPORTING DATA OUR COMMITMENT TO ESG
PROVIDING POWERFUL BACKING THROUGHOUT THE PANDEMIC We have provided support to our colleagues, customers, and communities over the last two years of the COVID-19 pandemic. For colleagues, this included: • Providing coverage of out-of-pocket medical and pharmacy costs related to COVID-19 testing and treatment for colleagues enrolled in our US medical plans. • Up to 16 hours of paid time off for obtaining COVID-19 vaccines and boosters. • Partnering with departments of health and hospitals in the US and India to host onsite vaccine clinics for our colleagues, families, and contractors. For customers: • We continued to help merchant partners do business while keeping their own customers and staff safe. • For businesses, we raised contactless transaction thresholds to reduce physical contact at points of sale and reminded merchants that we do not require them to collect Card Members’ signatures. In the communities we serve: • We provided more than $11 million in philanthropic support for COVID-19 relief efforts since the start of the pandemic through 2021, delivering financial support to nonprofits worldwide working on the front lines of the ongoing global crisis. One of these partners was (RED), which we’ve highlighted below. In 2021, we joined forces with (RED) to support equitable access to testing, treatment, and vaccines in response to the impact of COVID-19 in the world’s poorest countries. To shine a spotlight on the campaign, we partnered with (RED) to launch CODE (RED) alongside the reopening of Broadway, with Lin-Manuel Miranda joining American Express at a special performance of the hit musical “Hamilton.” CODE (RED): A POWERFUL PARTNERSHIP FOR PUBLIC HEALTH We provided Card Members with the option to use Membership Rewards points to make donations through PayPal’s Pay with Rewards feature to help provide COVID-19 testing, treatment, and vaccines for people most in need. We also donated $250,000 to COVID-19 relief efforts championed by (RED) and its partners, Fund for the Global Fund, and COVAX, and matched employee contributions to the campaign. Community support during the COVID-19 pandemic has remained a priority. We provided more than $11 million in philanthropic support for COVID-19 relief efforts since the start of the pandemic through 2021. $11M+ COVID-19 relief efforts 14 INTRODUCTION PROMOTING DE&I ADVANCING CLIMATE SOLUTIONS BUILDING FINANCIAL CONFIDENCE OUR ESG GOVERNANCE & OPERATING RESPONSIBLY SUPPORTING DATA OUR COMMITMENT TO ESG
AMEX FLEX: OUR NEW WAY OF WORKING AMEX FLEX HAS THREE WORK DESIGNATIONS Our colleagues remained productive during the pandemic, which required us to become even more agile in how we work, and our new Amex Flex model is designed to continue this trend while leveling the playing field for colleagues across jobs and locations. In-person connections at the office will also continue to play an important role in American Express’ future. We believe that being together in person has benefits, including spontaneous connections and idea sharing, team bonding and camaraderie, workspaces designed for creativity and collaboration, and more opportunities for mentorship, in-person coaching, and networking. In March 2022, we officially launched Amex Flex, our new way of working where colleagues can work in the office, at home, or can take a hybrid approach that combines both. Amex Flex is designed to leverage the best of both in-person and remote work and to enable colleagues to have greater flexibility in their personal and professional lives. ONSITE ONSITE COLLEAGUES WORK IN THE OFFICE 4-5 DAYS PER WEEK. THIS OPTION APPLIES TO LIMITED SELECT ROLES THAT CAN ONLY BE PERFORMED IN AN OFFICE, THOSE WHO CANNOT PERFORM THEIR ROLES REMOTELY, OR FOR ANYONE WHO WANTS TO BE IN THE OFFICE EVERY DAY. HYBRID HYBRID COLLEAGUES WORK A MIX OF IN-OFFICE AND VIRTUAL DAYS, COMING INTO THE OFFICE ABOUT TWO DAYS PER WEEK ON AVERAGE. LEADERS AND COLLEAGUES MAY PLAN COMMON DAYS FOR IN-PERSON CONNECTION, COLLABORATION, AND EVENTS. FULLY VIRTUAL VIRTUAL COLLEAGUES WORK EXCLUSIVELY OR FOR THE VAST MAJORITY OF DAYS FROM HOME. To back our colleagues during this transition, we are: • Phasing-in Amex Flex and avoiding a “one-size-fits-all" approach • Surveying our colleagues to garner feedback • Remaining flexible to meet the needs of our colleagues • Deploying our real estate, technology, and medical teams to help create a welcoming and safe office environment • Conducting informational and re-orientation sessions on topics such as the ongoing health resources we are offering • Introducing new office technologies to enhance the workplace experience and make it easy to collaborate with colleagues, such as equipping conference and huddle rooms with high-definition videoconferencing technology • Adding new technology benefits that provide colleagues the opportunity to order company-issued hardware and software to support working from home, regardless of their work designation 15 INTRODUCTION PROMOTING DE&I ADVANCING CLIMATE SOLUTIONS BUILDING FINANCIAL CONFIDENCE OUR ESG GOVERNANCE & OPERATING RESPONSIBLY SUPPORTING DATA OUR COMMITMENT TO ESG
Kicking off Amex Flex We have launched Amex Flex in 18 countries. 3 3. As of June 1, 2022 Offering flexibility has always been a part of our culture. In fact, before the pandemic around 20% of our US workforce was virtual. Since we announced Amex Flex, the majority of our colleagues in the US have chosen hybrid schedules, opting to spend their time between in-office and virtual days, coming into the office about two days per week, while more than 40% have opted to be fully virtual, a percentage that has doubled over the last two years. As part of Amex Flex, all colleagues, except for those who are required to work onsite, will have the opportunity to work up to 30 days per calendar year from a location other than their primary work location. Our first office sites to adopt Amex Flex were in the UK and the US in the first quarter of 2022. Since then, offices in 18 countries in total have started Amex Flex. 16 INTRODUCTION PROMOTING DE&I ADVANCING CLIMATE SOLUTIONS BUILDING FINANCIAL CONFIDENCE OUR ESG GOVERNANCE & OPERATING RESPONSIBLY SUPPORTING DATA OUR COMMITMENT TO ESG
AWARDS AND RECOGNITION Our commitment to be a great place to join, stay, and grow a career continues to earn us industry awards and recognition. Here are some of the recognitions from 2021 and 2022 that make us proud. • Anita Borg Top Companies for Women Technologists • Bloomberg’s Gender-Equality Index (since 2016) • Human Rights Campaign Corporate Equality Index— 100% score (since 2004) • Forbes America’s Best Employers for Diversity—ranked #24 • Forbes Best Companies to Work for in Spain—ranked #1 • FORTUNE 100 Best Companies to Work For—ranked #8 • FORTUNE 100 Best Workplaces for Millennials—ranked #9 • FORTUNE 100 Best Workplaces for Women—ranked #2 • FORTUNE Best Workplaces in Financial Services & Insurance—ranked #3 • FORTUNE Best Workplaces in New York—ranked #1 • FORTUNE World’s Most Admired Companies— ranked #13 • Great Place to Work: Best Workplaces for Parents— ranked #21 • Great Place to Work: Best Workplaces in Italy— ranked #2 • JUST Capital—JUST 100 List • Newsweek and Statista America’s Most Responsible Companies—ranked #13 • PEOPLE 2021 Companies that Care—ranked #48 • Working Families Top 10 Employers in the UK • Seramount 100 Best Companies—ranked top 10 • Seramount Companies for Dads CDP (CLIMATE) A- FTSE4GOOD INDEX SERIES MSCI (ESG) RATING AA SUSTAINALYTICS ESG RISK RATING Low Risk THIRD-PARTY ESG RATINGS We monitor our performance across several environmental, social, and governance-related ratings and rankings. Below are highlights from our most recent ratings: 17 INTRODUCTION PROMOTING DE&I ADVANCING CLIMATE SOLUTIONS BUILDING FINANCIAL CONFIDENCE OUR ESG GOVERNANCE & OPERATING RESPONSIBLY SUPPORTING DATA OUR COMMITMENT TO ESG
ADVANCING THE UNITED NATIONS SUSTAINABLE DEVELOPMENT GOALS (SDG s ) We believe our actions can contribute positively to achieving the UN’s 2030 Agenda for Sustainable Development. We map our corporate and ESG initiatives and programs to the 17 United Nations Sustainable Development Goals (SDGs) and believe our work contributes most to the following 11 SDGs: 3 GOOD HEALTH AND WELL-BEING 4 QUALITY EDUCATION 5 GENDER EQUALITY 7 AFFORDABLE AND CLEAN ENERGY 8 DECENT WORK AND ECONOMIC GROWTH 9 INDUSTRY INNOVATION AND INFRASTRUCTURE 10 REDUCED INEQUALITIES 11 SUSTAINABLE CITIES AND COMMUNITIES 12 RESPONSIBLE CONSUMPTION AND PRODUCTION 13 CLIMATE ACTION 17 PARTNERSHIPS FOR THE GOALS 18 INTRODUCTION PROMOTING DE&I ADVANCING CLIMATE SOLUTIONS BUILDING FINANCIAL CONFIDENCE OUR ESG GOVERNANCE & OPERATING RESPONSIBLY SUPPORTING DATA OUR COMMITMENT TO ESG
20 Our Vision for Promoting Diversity, Equity, and Inclusion 21 Progress and Highlights 23 Supporting Our Colleagues, Customers, and Communities 24 Backing Our Colleagues 32 Backing Our Customers and Partners 35 Backing Our Communities Promoting Diversity, Equity, and Inclusion
STRATEGIC OBJECTIVES GOALS • Provide $50 million in grants by the end of 2024 to nonprofits focused on addressing inequality and promoting social justice, including those led by members of underrepresented groups • Increase the representation of American Express Leadership Academy participants in the US who are from underrepresented groups from 50% in 2019 to 75% by the end of 2024 • Double annual spend with underrepresented-owned suppliers in the US from a 2019 baseline to $750 million by the end of 2024 and increase spend with Black-owned suppliers to at least $100 million annually. We expect the ongoing progress towards this goal and the cumulative spend with underrepresented-owned suppliers from late 2020 through 2025 will comprise a significant portion of the $4 billion we aim to spend toward DE&I initiatives over this period. • Provide access to capital and financial education to at least 250,000 underrepresented-owned small- and medium-sized business in the US from late 2020 through 2024 • Develop more inclusive marketing initiatives, as well as design and build product experiences and programs that better meet the needs of underrepresented consumer and business customers • Maintain 100% pay equity across genders globally and across races and ethnicities in the US Enhance diverse representation, equal opportunity, and an inclusive culture at all levels of the company Meet the needs of underrepresented businesses and consumers and develop more inclusive marketing initiatives Advance racial equality and social justice in our communities OUR VISION FOR PROMOTING DIVERSITY, EQUITY, AND INCLUSION SUPPORT A DIVERSE, EQUITABLE, AND INCLUSIVE WORKFORCE, MARKETPLACE, AND SOCIETY INTRODUCTION PROMOTING DE&I ADVANCING CLIMATE SOLUTIONS BUILDING FINANCIAL CONFIDENCE OUR ESG GOVERNANCE & OPERATING RESPONSIBLY SUPPORTING DATA OUR COMMITMENT TO ESG 20
100% Maintained 100% pay equity across genders globally and across races and ethnicities in the US for the 2nd consecutive year 76% of US participants in the American Express Leadership Academy in 2021 were from underrepresented groups, exceeding our goal of 75% by 2024 More than $14 million in grants provided to nonprofits focused on addressing inequality and promoting social justice, including those led by members of underrepresented groups, since announcing our goal of $50 million in October 2020 as part of our DE&I Action Plan $14M+ Spent more than $1 billion since announcing our DE&I Action Plan in October 2020 through March 2022 and announced an additional $3 billion toward DE&I initiatives through 2025 $1B+ Published inaugural DE&I Report in 2021 and continued to enhance transparency, including by providing additional data on hiring, promotions, and retention by race and ethnicity in this report INAUGURAL DE&I REPORT #8 on FORTUNE 100 Best Companies to Work For Progress and Highlights INTRODUCTION PROMOTING DE&I ADVANCING CLIMATE SOLUTIONS BUILDING FINANCIAL CONFIDENCE OUR ESG GOVERNANCE & OPERATING RESPONSIBLY SUPPORTING DATA OUR COMMITMENT TO ESG 21
Strategy Into Action: Exceeding $1 Billion of Spend Toward Our DE&I Action Plan, Announcing an Additional $3 Billion When we announced our $1 billion Diversity, Equity, and Inclusion (DE&I) Action Plan in October of 2020, we sought to build on our foundation of supporting diverse representation and equal opportunities for our colleagues, customers, and communities. That legacy includes a longstanding commitment to fostering an inclusive and welcoming workplace that reflects the diversity of our communities, promoting equal economic opportunity for our diverse customer base and business partners, and supporting community initiatives focused on advancing equality and social justice. As of March 2022, we exceeded $1 billion in spending since October 2020 toward our DE&I Action Plan, ahead of schedule. Our investments included spending with underrepresented-owned suppliers, expanding access to capital and financial education for underrepresented-owned small businesses, supporting partnerships with nonprofit organizations focused on promoting equality and social justice, and investments in pay equity. $4B toward DE&I Building on our progress, we now plan to spend an additional $3 billion toward DE&I initiatives—for an ambition to spend $4 billion in total from late 2020 through the end of 2025. The majority of additional spend will continue to be allocated to underrepresented-owned suppliers. Global investments outside the United States may include initiatives like Blueprint: Backing BIPOC Businesses, ™ a mentorship and grant program designed to support the advancement of Black, Indigenous, or People of Color (BIPOC) business owners in Canada. Launched last year, 100 Blueprint recipients own and operate small businesses in cities across Canada and represent a wide range of industries, including agriculture, consulting services, and technology solutions. INTRODUCTION PROMOTING DE&I ADVANCING CLIMATE SOLUTIONS BUILDING FINANCIAL CONFIDENCE OUR ESG GOVERNANCE & OPERATING RESPONSIBLY SUPPORTING DATA OUR COMMITMENT TO ESG 22
SUPPORTING OUR COLLEAGUES, CUSTOMERS, AND COMMUNITIES At American Express, we work to create an inclusive culture in the workplace, where our colleagues feel welcome and supported to reach their full potential; the marketplace, where businesses and consumers have equal economic opportunities; and society, where equality is supported and diversity is celebrated. We bring our DE&I vision to life by embedding diversity, equity, and inclusion in our company culture and operations, executing on the priorities and goals we set for ourselves, and holding our company and leaders accountable for progress on and achievement of those goals. INTRODUCTION PROMOTING DE&I ADVANCING CLIMATE SOLUTIONS BUILDING FINANCIAL CONFIDENCE OUR ESG GOVERNANCE & OPERATING RESPONSIBLY SUPPORTING DATA OUR COMMITMENT TO ESG 23
We are committed to delivering a great colleague experience at American Express. We seek to foster an inclusive environment where colleagues can grow and develop in ways that are unique and meaningful to them and have the backing and flexibility they need to bring their authentic selves to work and thrive in their professional and personal lives. Based on the findings from our 2021 annual Colleague Experience Survey, we are continuing our focus on strong enterprise leadership and agile decision-making in the way we work. In the spring of 2022, we launched Amex Flex, a hybrid work model that is designed to recapture in-person connections, collaboration, and relationship building, while also retaining the flexibility and efficiencies of working virtually. Learn more in Amex Flex: Our New Way of Working in the Our Commitment to ESG section of this report. We are focused on creating an inclusive and welcoming culture where colleagues feel that they belong, that their contributions are highly valued, and that their voices are heard. Through our 14 Colleague Networks globally, we are providing our colleagues with opportunities to engage, share common experiences, support each other’s development, and give back to their communities. BACKING OUR COLLEAGUES In our 2021 annual Colleague Experience Survey, 90% of survey participants said they would recommend American Express as a great place to work. 90% INTRODUCTION PROMOTING DE&I ADVANCING CLIMATE SOLUTIONS BUILDING FINANCIAL CONFIDENCE OUR ESG GOVERNANCE & OPERATING RESPONSIBLY SUPPORTING DATA OUR COMMITMENT TO ESG 24
2021 Global workforce representation We have established recruitment, hiring, and promotion practices to attract, develop, and retain a diverse workforce. Our focus is on fostering an inclusive and equitable culture for all colleagues. 50 % BOARD OF DIRECTORS DEMOGRAPHICS 2 57 % Racial/ Ethnic Diversity 29 % 7 % 64 % Gender Diversity 71 % 29 % 2021 SENIOR VICE PRESIDENTS & ABOVE 3 53 % 53 % 1. Based on data for the 2021 U.S. Employer Information Report (EEO-1) submission for Black/African American, Hispanic/Latino, Asian, Native American, or Alaskan Native, Native Hawaiian, or Pacific Islander, and two or more races. 2. Based on self-identified characteristics. Data is following our 2022 annual meeting. 39.1 % Women (Global) 9.1 % Black/ African American (US) 15.2 % Asian (US) 5.3 % Hispanic/Latinx (US) Our full US Workforce Employer Information Report (EEO-1) data can be found in the Supporting Data section. A Focus on Our Global Workforce Diversity From hiring and onboarding to growing careers, we seek to foster an inclusive environment where colleagues can grow and thrive in ways that are unique and meaningful to them and have the backing and flexibility they need to deliver their best. 2021 WORKFORCE HIGHLIGHTS OF OUR EXECUTIVE COMMITTEE WERE WOMEN OR FROM DIVERSE RACES AND ETHNIC BACKGROUNDS OF OUR BOARD MEMBERS WERE WOMEN OR FROM DIVERSE RACES AND ETHNIC BACKGROUNDS 10 MEN 4 WOMEN OF OUR US WORKFORCE WERE FROM DIVERSE RACES AND ETHNIC BACKGROUNDS 1 OF OUR TOTAL GLOBAL WORKFORCE WERE WOMEN 3. As of year-end 2021; based on the U.S. EEO-1 job categories. 4 BLACK/AFRICAN AMERICAN 1 HISPANIC/ LATINX 9 WHITE Since 2015, American Express has been included on the Bloomberg Gender-Equality Index (GEI). The GEI highlights public companies committed to disclosing their efforts to support gender equality through policy development, representation, and transparency. INTRODUCTION PROMOTING DE&I ADVANCING CLIMATE SOLUTIONS BUILDING FINANCIAL CONFIDENCE OUR ESG GOVERNANCE & OPERATING RESPONSIBLY SUPPORTING DATA OUR COMMITMENT TO ESG 25
Hiring, promotions, and retention To help inform and improve our diversity, equity, and inclusion practices, we track our hiring, promotions, and talent retention rates, including for gender globally and for race and ethnicity in the US. As part of our commitment to ongoing transparency, we’re providing additional detailed disclosures in this year’s report, including disaggregated representation data by race and ethnicity in the US as shown in the table below. 2021 HIRING, PROMOTIONS, AND RETENTION RATES Women Globally Men Globally US Asian 5 US Black or African American 5 US Hispanic or Latinx 5 US Other 5, 6 US White 5 New Colleague Hires 53% 47% 20% 23% 16% 3% 36% Colleague Promotions 52% 48% 27% 8% 11% 3% 51% Colleague Retention 87% 84% 83% 81% 86% 82% 86% Maintaining 100% pay equity We regularly review our compensation practices to ensure colleagues in the same job, level and location are compensated fairly regardless of gender globally, and race and ethnicity in the United States. In 2021, for the second consecutive year, we achieved 100% pay “equity”—meaning no statistical differences in pay—across genders globally and across races and ethnicities in the US. Our pay equity achievement is supported by compensation policies, processes, and practices designed to pay colleagues in all roles and at all levels based on performance and other business-related criteria, making appropriate salary adjustments where needed. As part of the evaluation of our pay practices and reward structure, we have conducted annual pay equity reviews with independent experts since 2017. Since 2019, this analysis has covered our entire global colleague population across genders globally and across races and ethnicities in the US, assessing pay on a statistical basis and considering key factors that influence compensation, including but not limited to tenure, role, level, geography, and performance. In 2021, we began disclosing the “raw median pay gap” for women globally and for diverse colleagues in the United States. This metric compares differences in raw median base pay, with no adjustments for factors such as role, level, tenure, performance, or geography. In 2021, the median pay for women globally at American Express was 106.7% of the median pay for men. The median pay for racially/ethnically diverse colleagues in the US was 95.2% of that for white colleagues. 7 We believe our pay equity review provides a more accurate and comprehensive picture of our compensation practices overall because it provides a more granular view that considers many important factors known to affect an individual’s compensation. For this reason, we use pay equity as the standard we hold ourselves accountable to. We remain committed to maintaining 100% pay equity for colleagues across genders globally and across races and ethnicities in the US by continuing our annual pay equity review process. 7. US racially/ethnically diverse colleagues based on US EEO-1 categories including Black or African American, Hispanic or Latino, Asian, Native American, or Alaskan Native, Native Hawaiian or Pacific Islander, and two or more races. 4. As of year-end 2021; based on the U.S. EEO-1 job categories. Some percentages do not sum due to rounding. 5. Race/ethnicity based on self-identified information. Less than 1% of new colleague hires did not disclose their race or ethnicity in 2021. 6. Includes colleagues that self-identify as Native American or Alaskan Native, Native Hawaiian or Pacific Islander, or two or more races. 2021 US WORKFORCE DIVERSITY 4 Racial/ Ethnic Diversity 19.5 % 13.3 % 50.2 % 3.1 % 13.8 % Gender Diversity 44.7 % 55.3 % MEN WOMEN ASIAN BLACK/AFRICAN AMERICAN HISPANIC/LATINX WHITE OTHER INTRODUCTION PROMOTING DE&I ADVANCING CLIMATE SOLUTIONS BUILDING FINANCIAL CONFIDENCE OUR ESG GOVERNANCE & OPERATING RESPONSIBLY SUPPORTING DATA OUR COMMITMENT TO ESG 26
Workplace awards and recognition We attribute our success to the more than 64,000 colleagues who drive our business. We’re proud that our efforts to provide an environment where a diverse workforce can thrive has garnered outside recognition, from our highest-ever ranking of #8 on FORTUNE’s 100 Best Companies to Work For to LinkedIn naming us one of the top 10 companies to grow your career in the UK, to GirlCode® naming us to the “Top 10 Diversity and Inclusion Power List” for 2022, to the Human Rights Campaign naming us to their Best Places to Work for LGBTQ+ Equality list in 2022. Learn more in Awards and Recognition in the Our Commitment to ESG section. Diversifying talent through strategic partnerships We have established over 30 partnerships to help us broaden our reach and support our enterprise objectives to recruit new talent and retain high performing colleagues. One of our key partners is PowertoFly (PTF), an organization focused on connecting underrepresented talent to companies. Through our engagement efforts, PTF supports our global hiring efforts across multiple talent segments and levels of the organization. “ American Express has partnered with PowerToFly since 2017 to help build and retain their inclusive and diverse workplace in the US, UK, and India. Together, we’ve targeted talent segments including Tech, Finance, Sales & Marketing, and Risk & Analytics through events, virtual job fairs, sponsorship of PowerToFly’s Diversity Reboot Summit series, and more. Our partnership has only strengthened throughout the years, and we look forward to what’s to come!” – KRISTINA TEPPO , CUSTOMER SUCCESS MANAGER AT POWERTOFLY PowerToFly INTRODUCTION PROMOTING DE&I ADVANCING CLIMATE SOLUTIONS BUILDING FINANCIAL CONFIDENCE OUR ESG GOVERNANCE & OPERATING RESPONSIBLY SUPPORTING DATA OUR COMMITMENT TO ESG 27
2021 Colleague Experience Survey 85 % of participants indicated that they feel valued as a colleague at American Express 91 % of participants responded that they feel supported by their leader in making decisions about their well-being Belonging and inclusion at American Express To support our efforts to create an inclusive and welcoming culture for our colleagues, we introduced two trainings in 2020: a “Strengthening Our Culture of Belonging and Inclusion” course and a “Belonging at Amex” workshop. We supplemented these trainings with conversations and informational sessions on how colleagues can contribute to a culture of inclusion. Throughout, colleagues had access to numerous resources on leading inclusively, having meaningful conversations, and making their voices heard. To further help colleagues feel a sense of belonging, we have 14 Colleague Networks, with over 100 chapters worldwide, for sharing common experiences and interests: • Asian Network at American Express (ANA) • Black Engagement Network (BEN) • Christian Network (SALT) • Disability Awareness Network (DAN) • Families at American Express Network • Generations Network (NextGen) • Hispanic Origin & Latin American Network (HOLA) • Jewish Network (CHAI) • Muslim Network (PEACE) • PRIDE+ Network • Veterans Network (VET) • Virtual Office Network • Women in Technology Network (WIT) • Women’s Interest Network (WIN) In addition to our Colleague Networks, we have nine Diversity, Equity, and Inclusion Councils across Business Units and in office locations to address local priorities. EXPANSIVE AND IMPACTFUL FAMILY SUPPORT For US colleagues who use adoption, surrogacy, or egg/sperm donors, we offer reimbursement that covers expenses up to $35,000—for up to two events, with a lifetime maximum of $70,000. Those who undergo reproductive treatments are eligible for up to $35,000 in medical assistance. “ We adopted our son and in fact, Amex has been there for us since day one and throughout every step of the way,” says Sean B., an analyst in our Global Risk and Compliance department. “The company’s family planning and assistance program provided us with the financial support to adopt earlier than what we thought was possible. Additionally, the family concierge benefit helped us throughout the adoption process and is a resource we continue to use when we need childcare.” “ The dependent care flexible spending account has also provided comfort financially,” Sean added, “which has especially been helpful during these current times when we’re doing the best we can in a lot of situations that are entirely new and the challenges we’ve had to navigate around due to COVID.” This support continues after colleagues welcome their new family members. Under our gender-neutral parental leave policy, eligible colleagues in the United States can take up to 20 weeks parental leave with full base pay, whether they’re welcoming a child through pregnancy, adoption, or surrogacy. We also provide six to eight weeks of additional leave if medically necessary. We also provide colleagues in Canada, the UK, and the US access to in-home or center- based childcare when their regular arrangements fall through, as well as connection with 24/7 consultants who can help arrange in-home care for an adult loved one recovering from an illness or injury. INTRODUCTION PROMOTING DE&I ADVANCING CLIMATE SOLUTIONS BUILDING FINANCIAL CONFIDENCE OUR ESG GOVERNANCE & OPERATING RESPONSIBLY SUPPORTING DATA OUR COMMITMENT TO ESG 28
Backing women colleagues In 2021, women represented more than half of our workforce worldwide, and approximately four out of 10 senior executives were women. We are invested in engaging, retaining, and backing our women colleagues and helping them realize their professional potential through initiatives and programs that help them grow, develop, and thrive. For example, in India, we have established more than 20 small peer group “Lean In Circles” designed to build connection and new skills. Through customized training and partnerships with external organizations, we offer colleagues a variety of meaningful learning and development opportunities. In 2020, we launched the Ambition Project in partnership with The New York Women’s Foundation to encourage our women colleagues to fully embrace their ambition and support the ambitions of others. In 2022, we once again partnered with the New York Women’s Foundation for a global study on women’s relationship with ambition, both in their careers and personal lives—and their confidence in achieving success after a global pandemic. Amidst a rapidly changing workforce, women remain ambitious, and we continue to proudly back their aspirations. Backing colleagues with disabilities We are committed to providing colleagues with an inclusive work environment, from accessibility tools on the job to benefits that support a healthy work-life balance. In 2021, we enabled closed captioning as a standard for virtual livestream events to make broadcast content more accessible. We also launched enhanced accessibility features for online meetings, such as closed captioning, screen reader notifications, and the ability to change chat font size. These represent just a few of the resources and best practices we’ve made available to colleagues across the enterprise. To advance our disability inclusion initiatives, we’re now members of the Inclusion Works community as part of our Disability:IN partnership, in which we collaborate with disability inclusion experts to implement best practices in this space. We’ve continued our membership in the Valuable 500 in the UK, which enlists companies to keep disability inclusion on the leadership agenda and make a commitment to action. Within our company, our Disability Awareness Network (DAN) plays an important role in creating a sense of belonging and community among our colleagues with seen and unseen disabilities and raising awareness for disability inclusion. For International Day of Persons with Disabilities in December 2021, DAN brought together authors, advocates, entrepreneurs, mental health experts, and our colleagues from India, Spain, the UK, and beyond under the common theme of “Recognize More: Proudly Backing Disability Inclusion.” This virtual event was an opportunity to drive inclusion of people with disabilities by demonstrating support and helping educate allies on how best to partner with their colleagues with disabilities. In 2022, nearly 4,000 colleagues around the world joined our enterprise-wide International Women’s Day events live, featuring American Express leaders and external guests, in addition to 30 local events. For example, our Japan Women’s Network organized an event with a guest speaker on the topic of how to “Design Your Ambition.” INTRODUCTION PROMOTING DE&I ADVANCING CLIMATE SOLUTIONS BUILDING FINANCIAL CONFIDENCE OUR ESG GOVERNANCE & OPERATING RESPONSIBLY SUPPORTING DATA OUR COMMITMENT TO ESG 29
Backing Black and African American colleagues A culture of belonging gains strength when colleagues worldwide have opportunities to make their voices heard, listen, learn, and build their skills for inclusive leadership. Heritage months and cultural moments provided valuable occasions to spark these conversations and connections. For instance, Black Engagement Network (BEN) chapters across Canada and the United States celebrated Black History Month with a variety of events, open to all colleagues, under the theme of “Say It Loud.” BEN, in partnership with its executive committee sponsors, also promoted networking and development for vice presidents and above. Executive BEN held its sixth Global Forum in June 2021. The forum brought together 72 Black leaders from across the company, our CEO and Executive Committee members, and host Anré Williams, CEO, American Express National Bank and Group President of Enterprise Services. Attendees gained exposure to new perspectives, networked, honed their leadership skills, and helped shape plans for driving change for our Black colleagues. In 2022, we made Juneteenth, also known as Black Independence Day, a company holiday in the US, giving colleagues the day to learn, celebrate, and reflect. Juneteenth is a reminder of both the progress that has been made and the work still left to be done to ensure all people have equal opportunities to achieve dignity, happiness, and success. Backing Hispanic and Latinx colleagues During Hispanic and Latinx Heritage Month, our Hispanic Origin and Latin American Colleague Network (HOLA), hosted global events focused on “Amplifying the Impact: Proudly Backing Hispanic and Latinx Achievement.” Our theme showcased our commitment to celebrating our Hispanic and Latinx colleagues—appreciating who they are, acknowledging the strength they bring to our organization, and amplifying the lasting impact of their accomplishments. Backing Asian, Asian American, and Pacific Islander colleagues During Asian Pacific American Heritage Month in 2022, we celebrated the rich cultural diversity of our colleagues with the theme “Make Culture Shine: Proudly Backing All Asian Communities.” We also hosted a conversation titled “American Express Voices” with some of our Asian Network Amex leaders about bringing their whole selves to work and telling their stories. Names are often tied to heritage and culture, and we took the opportunity during Asian Pacific American Heritage Month in 2021 to introduce a new pronunciation feature in our company Slack channel where colleagues can list the phonetic spelling of their names. We also published an internal colleague feature titled “What’s in a Name?” and encouraged colleagues to ask and learn about each other’s names so we can all get to know each other on a deeper level. INTRODUCTION PROMOTING DE&I ADVANCING CLIMATE SOLUTIONS BUILDING FINANCIAL CONFIDENCE OUR ESG GOVERNANCE & OPERATING RESPONSIBLY SUPPORTING DATA OUR COMMITMENT TO ESG 30
Backing LGBTQ+ inclusion In 2021, our PRIDE+ Colleague Network developed a powerful theme in honor of Pride Month to continue driving a message of inclusion to our colleagues around the globe “Live Beyond Labels: Proudly Backing All of You” and engaged colleagues in enterprise-wide conversations. In October 2021, we announced that we commenced an exclusive three-year principal partnership with the Sydney Gay and Lesbian Mardi Gras and that we will partner with Sydney WorldPride in 2023. As principal partner, we will work alongside the Sydney Gay and Lesbian Mardi Gras and Sydney WorldPride teams to coordinate a festival of events across Greater Sydney that celebrate our diverse LGBTQ+ communities, which include the iconic Mardi Gras Fair Day. These partnerships build upon our support of LGBTQ+ communities, including our membership with Open for Business—a coalition of companies making the economic and business case for LGBTQ+ inclusion in companies around the world. We also received Silver status in the 2022 Australian Workplace Equality Index (AWEI). Backing our service members and veterans The Amex Veterans Network (VET) was launched in 2012 and supports our colleagues who are currently serving in the military, are veterans, have friends or family in the military, or just want to show their support for our troops. In 2021, American Express, in partnership with VET, provided a $50,000 grant to American Corporate Partners (ACP), a national nonprofit organization focused on helping returning veterans and active-duty spouses find their next careers through one- on-one mentoring, networking, and online career advice. Learn more about our support for veteran-owned small businesses in Inclusive Backing for Veterans . 18 YEARS AND COUNTING OF LEADING LGBTQ+ BENEFITS AND PRACTICES The Human Rights Campaign Foundation’s Corporate Equality Index is the national benchmarking tool on corporate policies, practices, and benefits pertinent to LGBTQ+ colleagues. Each year since 2004, American Express has scored 100% on this index. Additionally, in 2022, we were named to their list of Best Places to Work for LGBTQ+ Equality. INTRODUCTION PROMOTING DE&I ADVANCING CLIMATE SOLUTIONS BUILDING FINANCIAL CONFIDENCE OUR ESG GOVERNANCE & OPERATING RESPONSIBLY SUPPORTING DATA OUR COMMITMENT TO ESG 31
Raising the bar for supply chain diversity Successful strategies and innovative products and services require diverse perspectives and contributions. For these reasons, American Express has a goal to increase spending with underrepresented-owned suppliers who provide us with professional services, marketing, and beyond. To build a more diverse, inclusive supply chain, we consider at least one diverse vendor for each request for proposal. We track and measure our annual spend with certified business enterprises run by underrepresented owners and operators, including: • Minority-owned Business Enterprises (MBE) • Black-owned Businesses • Women-owned Business Enterprises (WBE) • LGBT-owned Business Enterprises (LGBTE) • Veteran’s Business Enterprises (VBE) • Service-Disabled Veteran’s Business Enterprises (SDVBE) • Disability-owned Business Enterprises (DOBE) • Small Business Enterprises/8(a)/HUBZone firms BACKING OUR CUSTOMERS AND PARTNERS American Express seeks to meet the needs of under represented businesses and consumers and develop more inclusive marketing initiatives. We are also focused on our efforts to help underrepresented-owned businesses through our supplier diversity program. In 2021, we introduced more than 65 new underrepresented- owned suppliers to grow our program and in 2022 started working with select suppliers to begin tracking diverse supplier spend within their own supply chains. Our supplier diversity partners include: • Disability: IN • Financial Services Roundtable for Supplier Diversity (FSRSD) • Minority Supplier Development UK (MSDUK) • National LGBT Chamber of Commerce (NGLCC) • National Minority Supplier Development Council (NMSDC) • National Veterans Business Development Council (NVBDC) • Supply Nation • US Black Chambers • WEConnect International • Women’s Business Enterprise National Council (WBENC) In October 2020, we announced a goal to double our annual spend with underrepresented-owned suppliers in the United States from a 2019 baseline to $750 million by the end of 2024, including increasing spend with Black-owned suppliers to at least $100 million annually. In 2021, we not only made progress toward this goal, but also exceeded our initial expectations for the year, as shown in the graphic below. SUPPLIER DIVERSITY: BY THE NUMBERS $100M $72M $50M 2021 Target 2021 Actual 2024 Goal US Black-owned Annual Spend 2021 Target Exceeded! 237 Underrepresented-owned Suppliers in 2021 US Underrepresented- owned Annual Spend 2021 Target Exceeded! $750M $550M $500M 2021 Target 2021 Actual 2024 Goal Learn more about our Backing Small initiatives in the Backing Small for Underrepresented and Economically Vulnerable Small Business Owners section. INTRODUCTION PROMOTING DE&I ADVANCING CLIMATE SOLUTIONS BUILDING FINANCIAL CONFIDENCE OUR ESG GOVERNANCE & OPERATING RESPONSIBLY SUPPORTING DATA OUR COMMITMENT TO ESG 32
Extending our reach through grants and community investment In 2021, we provided $20 million to Accion Opportunity Fund, a nonprofit Community Development Financial Institution and small business lender, to expand access to loans for historically underfunded small businesses in the United States, including those owned by underrepresented groups. Learn more about our investments in the communities we serve in Backing Our Communities in the Building Financial Confidence section. Joining forces for more inclusive travel In March 2022, we proudly announced our global platinum- level sponsorship of the International LGBTQ+ Travel Association (IGLTA), a global leader in advancing LGBTQ+ travel and have signed a multi-year agreement to join IGLTA. IGLTA provides information and resources for LGBTQ+ travelers and expands LGBTQ+ tourism globally by demonstrating its significant social and economic impact. This partnership supports diversity, equity, and inclusion in the travel industry by enriching our Card Members’ journeys through inclusive travel choices and practices. Backing our customers with purpose-driven travel options Our customers are traveling with more purpose and seeking to have a positive impact on the places they visit. According to our Global Travel Trends report, 81% of respondents reported that they want to travel to destinations where they can immerse themselves in the local culture and 81% of respondents want the money they spend while traveling to go back to the local community. 8 To help our customers navigate purpose-driven travel options and experience destinations in a more meaningful way, American Express Travel is partnering with Kensington Tours to launch bespoke itineraries in countries around the world geared toward cultural exchange and supporting the local economies. Our initial launch features customizable tours for Denmark, Kenya, Peru, South Africa, and Vietnam available for US Platinum Card Members to book exclusively through American Express Travel. By leveraging existing partnerships and cultivating new ones, American Express Travel is identifying new thoughtful travel options that align with what our customers value. 8. Methodology: Amex Trendex online poll was conducted by Morning Consult between February 3–11, 2022, among a national sample of 2,000 travelers in the US and 1,000 travelers in Japan, Australia, Mexico, India, UK, and Canada who have a household income of at least $70K and defined as adults who typically travel by air at least once a year. Results from each country survey have a margin of error of plus or minus 3 percentage points. INTRODUCTION PROMOTING DE&I ADVANCING CLIMATE SOLUTIONS BUILDING FINANCIAL CONFIDENCE OUR ESG GOVERNANCE & OPERATING RESPONSIBLY SUPPORTING DATA OUR COMMITMENT TO ESG 33
Connecting underrepresented-owned businesses to capital and support As part of our ESG strategy to Promote Diversity, Equity, and Inclusion, we have a goal to provide at least 250,000 underrepresented-owned small- and medium-sized US businesses access to capital and financial education from late 2020 through 2024. We’re progressing toward this goal by delivering educational resources, expanded access to credit and loans, grants, marketing support, and more. For nine years, we’ve partnered with Women Impacting Public Policy and the US Small Business Administration to help boost the prospects of women entrepreneurs to gain government contracts. Our ChallengeHER program offers free training webinars, workshops, mentoring, and direct access to government buyers and local partner resources. From 2013 through the end of 2021, this initiative has hosted 170 webinars and facilitated over 4,800 meetings between women-owned small businesses and government officials. In 2021, there were more than 2,300 total attendees for ChallengeHER webinars. We also hosted Contract Connections for the ninth year at the 2021 Business Class LIVE virtual event for small business owners, connecting many underrepresented-owned small business suppliers with large corporate and government buyers in one-on-one sessions. We continued to offer small business owners’ access to Business Class, a platform offering customized business education resources. We also maintained our support of Minority- and Women-Owned Business Enterprises (MWBEs) as part of our capital markets funding and share repurchase programs. In 2021, we engaged four MWBEs for underwriting and share repurchases, and through May of 2022, we engaged six such MWBEs. We have a goal to provide at least 250,000 underrepresented-owned small- and medium- sized US businesses access to capital and financial education from late 2020 through 2024. 2024 250K INTRODUCTION PROMOTING DE&I ADVANCING CLIMATE SOLUTIONS BUILDING FINANCIAL CONFIDENCE OUR ESG GOVERNANCE & OPERATING RESPONSIBLY SUPPORTING DATA OUR COMMITMENT TO ESG 34
BACKING OUR COMMUNITIES Advancing racial equality and social justice in our communities starts with our business ethics and extends through our partnerships, grants, and community investments worldwide. Investing in organizations that are addressing inequality and promoting social justice To support DE&I efforts in the communities where we live and work, we have a goal to provide $50 million in grants from late 2020 through 2024 to nonprofits focused on addressing inequality and promoting social justice, including those led by members of underrepresented groups. Since late 2020, we’ve provided more than $14 million in grants so far to these organizations. Some examples of the initiatives we supported in 2020–2021 include: • Social purpose leadership training for diversity organizations, including Hispanics in Philanthropy, Public Allies, the Council of Urban Professionals Institute, Americans for Indian Opportunity, National Urban League, and Leadership Education for Asian Pacifics (LEAP) • Leadership programs that support women leaders in the nonprofit sector, including with The New York Women’s Foundation • The New York City LGBTQ+ Historic Sites Project, run by the Fund for the City of New York • Development programs supporting visually impaired leaders with the American Foundation for the Blind • Initiatives with the First Nations Development Institute addressing the immediate and economic needs of Native American communities disproportionately impacted by COVID-19 and food insecurity Backing equal futures We support organizations that are reducing economic, health, educational, and racial disparities through our new Backing Equal Futures grantmaking pillar. In 2021, this support included grants to the NAACP Legal Defense & Educational Fund, The Hispanic Scholarship Fund, and NAF (formerly the National Academy Foundation). In addition, we’ve also established strategic partnerships with organizations such as United Negro College Fund (UNCF), the Thurgood Marshall Fund, and HBCU Connect to provide career readiness programming and access to internships and full-time career opportunities to Historically Black College and University (HBCU) students and alumni. BACKING LGBTQ+ YOUTH IN OUR COMMUNITY American Express has supported the Trevor Project since 2019. As the world’s largest suicide prevention and mental health organization for LGBTQ+ young people, the Trevor Project works to save young lives by providing support through free and confidential suicide prevention and mental health programs. The organization also runs TrevorSpace, the world’s largest safe space social networking site for LGBTQ+ youth, and operates innovative education, research, and advocacy programs. Our grant funding of $250,000 is supporting the Trevor Project’s international expansion of crisis services to Mexico and an LGBTQ+ advocacy strategy in the United States. Through this strategy, the Trevor Project aims to meet vulnerable LGBTQ+ youth with life-saving support across multiple fronts. INTRODUCTION PROMOTING DE&I ADVANCING CLIMATE SOLUTIONS BUILDING FINANCIAL CONFIDENCE OUR ESG GOVERNANCE & OPERATING RESPONSIBLY SUPPORTING DATA OUR COMMITMENT TO ESG 35
Cultivating a more diverse generation of future leaders American Express has invested approximately $100 million since 2007 to help more than 165,000 social purpose leaders reach their potential. The American Express Leadership Academy builds the personal, business, and leadership skills of emerging nonprofit and social purpose leaders through multi-day trainings. In 2021, we continued to support our partners and participants by hosting 11 virtual programs for over 500 leaders from 11 countries. We also pledged to increase the representation of individuals from underrepresented groups among US participants from 50% in 2019 to 75% by 2024. We have already exceeded our goal, achieving 76% participation by individuals from underrepresented groups in 2021. In 2021, we joined with NinetyToZero, an initiative focused on combating the 90% racial wealth gap between white and Black Americans, which is expected to complement and build upon our 2020 partnership with OneTen, an organization whose mission is to hire, promote, and advance one million Black individuals who do not have a four-year degree into family-sustaining careers over the span of 10 years. We also participate in the Business Roundtable’s Multiple Pathways Initiative (MPI), which seeks to reform companies’ hiring and talent management practices to emphasize the value of skills, rather than just degrees, and to improve equity, diversity, and workplace culture. American Express has invested approximately $100 million since 2007 to help more than 165,000 social purpose leaders reach their potential. $100M INTRODUCTION PROMOTING DE&I ADVANCING CLIMATE SOLUTIONS BUILDING FINANCIAL CONFIDENCE OUR ESG GOVERNANCE & OPERATING RESPONSIBLY SUPPORTING DATA OUR COMMITMENT TO ESG 36
RECOGNITION FOR OUR COMMITMENT TO HISPANIC AND LATINX COMMUNITIES “ I’m proud that we put our service ethic to work to empower local leaders and organizations, like the Hispanic Federation, that are tackling some of society’s toughest challenges. Making a positive difference in the lives of our customers, business partners, and our communities, is something we take very seriously. It’s what drives us.” – MONIQUE HERENA , CHIEF COLLEAGUE EXPERIENCE OFFICER, AMERICAN EXPRESS “ For over 20 years, American Express has supported Latino causes by providing funds to help prepare Latino youth for long-term educational success, offering disaster relief assistance in times of trouble, and promoting the economic stability of Latino communities. Beyond financial support, American Express is a true partner to our communities.” – FRANKIE MIRANDA , THE HISPANIC SCHOLARSHIP FUND, PRESIDENT AND CEO, HISPANIC FEDERATION American Express was recognized with the Hispanic Federation’s 2022 Corporate Leadership Award in recognition of our track record of supporting Hispanic and Latinx causes in the areas of giving, volunteerism, and diversity. We have a long-standing partnership with the Hispanic Federation and in 2021 alone, we committed $2 million over four years to support the Hispanic Federation’s Latino Capacity Building Institute and its COVID-19 Emergency Assistance Fund—initiatives that are helping Latino nonprofits grow and respond to pressing community needs. We also committed $1 million over four years to support The Hispanic Scholarship Fund, with youth leadership initiatives, college education, and mentoring programs. Supporting vital community services for underrepresented groups in Australia American Express backs communities through local action on a global scale. For example, as the pandemic impacted education worldwide, many children, especially from under - represented groups, faced the risk of being left behind. We helped address this situation for Australia’s Aboriginal and Torres Strait Islander communities by supporting the Australian Literacy and Numeracy Foundation to continue delivering its Early Language & Literacy Program through digital innovations, enabling over 1,500 children to date to make critical progress in their oral language and early literacy development. The program is one of the many ways we back this community and demonstrates our commitment to reconciliation as part of our Reconciliation Action Plan. Chief Colleague Experience Officer, Monique Herena, accepting this year’s Corporate Leadership Award from the Hispanic Federation INTRODUCTION PROMOTING DE&I ADVANCING CLIMATE SOLUTIONS BUILDING FINANCIAL CONFIDENCE OUR ESG GOVERNANCE & OPERATING RESPONSIBLY SUPPORTING DATA OUR COMMITMENT TO ESG 37
39 Our Vision for Advancing Climate Solutions 40 Progress and Highlights 41 Minimizing Our Climate Impact 43 Moving to Net-Zero 48 Backing Our Colleagues 50 Backing Our Customers and Partners 53 Backing Our Communities Advancing Climate Solutions
Learn more about our 2025 operational environmental goals that cover energy and water use, waste generation, green building certifications, phaseout of single-use plastics, and sourcing paper responsibly on page 44. 1. American Express is following the methodology of the SBTi for our commitment to net-zero by 2035, which covers all Scope 1 and 2 emissions and a minimum of two-thirds of total Scope 3 emissions in conformance with the GHG Protocol Corporate Value Chain (Scope 3) Accounting and Reporting Standard. STRATEGIC OBJECTIVES GOALS • Provide at least $10 million to support initiatives, partnerships, and programs that address the adverse effects of climate change and pollution on communities from 2021 through 2025 • Engage our colleagues in sustainability initiatives through the Green2Gether program • Pilot low-carbon product innovations, including carbon tracking and offset solutions by the end of 2022 • Commit to net-zero emissions by 2035 in alignment with the Science Based Targets initiative (SBTi) 1 • Enhance the management of climate-related risks and opportunities across our business Minimize our climate impact and manage our climate-related risks and opportunities Enable our customers and partners to transition to a low-carbon economy through the development of new capabilities Support community programs and initiatives to help build more climate-resilient and equitable communities OUR VISION FOR ADVANCING CLIMATE SOLUTIONS ENHANCE OUR OPERATIONS AND CAPABILITIES TO MEET CUSTOMER AND COMMUNITY NEEDS IN THE TRANSITION TO A LOW-CARBON FUTURE INTRODUCTION PROMOTING DE&I ADVANCING CLIMATE SOLUTIONS BUILDING FINANCIAL CONFIDENCE OUR ESG GOVERNANCE & OPERATING RESPONSIBLY SUPPORTING DATA OUR COMMITMENT TO ESG 39
56% As of year-end 2021, approximately 56% of our operations have achieved green building certifications toward our 60% goal by 2025 4 Set a goal to have the vast majority of plastic cards issued by American Express be made of at least 70% recycled or reclaimed plastic by the end of 2024 $3.1M in grants pledged toward our $10 million philanthropic goal to back low-carbon communities by 2025 4. Green building certified percentage is represented by the total square footage of leased or owned facilities actively occupied by American Express (excluding parking lot square footage) certified under a global or locally recognized third-party environmental building rating system as meeting their performance criteria (LEED, BREEAM, NABERS, GreenMark, HQE and Effinergie+). Committed to net-zero emissions by 2035 in alignment with the SBTi 2 2035 Became a TCFD Supporter and conducted qualitative climate risk analyses aligned with TCFD recommendations Progress and Highlights 100% Carbon neutral operations powered by 100% renewable electricity since 2018 3 3. Achieved carbon neutral operations for Scope 1 (direct emissions from sources owned or controlled by American Express), Scope 2 (indirect market-based emissions), and Scope 3 (waste and employee business travel, including third-party air, rail and rental cars) emissions through renewable energy credits, carbon offsets, and reduced GHG emissions. Operations include all our managed facilities, field sites, and data centers. Managed facilities are individual properties operationally managed by our global real estate team and housing critical business functions. Field sites are individual properties that are not operationally managed by our global real estate team but directly by our business units. They are typically smaller sites, less than 30,000 square feet (including airport lounges, foreign exchange kiosks, and sales offices) that are owned or leased by American Express. For more detailed data on our consumption of electricity, renewable energy, and Scope 1, 2, and 3 emissions, please see the Environmental Performance Data Summary and Limited Assurance Statement of GHG Emissions in the Supporting Data: Our Commitment to Transparency section at the end of this report. 2. American Express is following the methodology of the SBTi for our commitment to net-zero by 2035, which covers all Scope 1 and 2 emissions and a minimum of two-thirds of total Scope 3 emissions in conformance with the GHG Protocol Corporate Value Chain (Scope 3) Accounting and Reporting Standard. 70% INTRODUCTION PROMOTING DE&I ADVANCING CLIMATE SOLUTIONS BUILDING FINANCIAL CONFIDENCE OUR ESG GOVERNANCE & OPERATING RESPONSIBLY SUPPORTING DATA OUR COMMITMENT TO ESG 40
MINIMIZING OUR CLIMATE IMPACT We believe we have a role to play in supporting the transition to a low-carbon economy and have been working toward advancing climate solutions on multiple fronts: Advancing climate solutions starts with our own operations. Since 2018, we have been a CarbonNeutral® company, powered by 100% renewable electricity across our global operations. 5 To build on these efforts, in 2021 we committed to net-zero emissions by 2035 in alignment with the Science Based Targets initiative (SBTi). We are also working to enhance the management of our climate-related risks and opportunities across our business and became a formal supporter of the Task Force on Climate-Related Financial Disclosures (TCFD). In 2020 and 2021, we conducted a qualitative climate risk scenario analysis to assess physical and transition risks to our business related to climate change in alignment with the TCFD. We assessed transition risks associated with current and emerging regulations, technology advances, and market and reputational impacts and identified opportunities, including developing new low-carbon products and services for customers. Additionally, ESG risks–in particular climate risk–have been included as an emerging risk for the company, and are part of our Enterprise Risk Management (ERM) framework. Climate-related risks are currently managed as part of our ERM process. The Risk Committee of our Board of Directors provides oversight of our ERM framework, processes, and methodologies, and approves our ERM policy, which governs risk governance, risk oversight, and risk appetite. Read more in the TCFD Index at the end of this report. 5. Achieved carbon neutral operations for Scope 1 (direct emissions from sources owned or controlled by American Express), Scope 2 (indirect and market-based emissions), and Scope 3 (waste and employee business travel) emissions through renewable energy credits, carbon offsets, and reduced GHG emissions. Operations include all our managed facilities, field sites, and data centers). For more detailed data on our consumption of electricity, renewable energy, and Scope 1, 2, and 3 emissions, please see the Environmental Performance Data Summary and Limited Assurance Statement of GHG Emissions in the Supporting Data section. • Minimizing the climate impact of our operations • Managing our climate-related risks and opportunities • Developing new capabilities for our customers and partners • Supporting community programs and initiatives to help build more climate- resilient and equitable communities INTRODUCTION PROMOTING DE&I ADVANCING CLIMATE SOLUTIONS BUILDING FINANCIAL CONFIDENCE OUR ESG GOVERNANCE & OPERATING RESPONSIBLY SUPPORTING DATA OUR COMMITMENT TO ESG 41
We have also continued to leverage programs like Green2Gether to engage our colleagues in sustainability initiatives. For our customers and partners, we set a goal to pilot new low-carbon product innovations by the end of 2022. We’ve made progress toward this goal, including piloting carbon tracking solutions for corporate clients, launching new recycled plastic cards in Canada and France, and partnering with Delta Air Lines on cards made from 70% reclaimed plastic that received a certification as a CarbonNeutral® product in accordance with The CarbonNeutral Protocol. To support more climate-resilient and equitable communities, we launched a goal to provide at least $10 million from 2021 through 2025 to support initiatives, partnerships, and programs that address the adverse effects of climate change and pollution on communities. Read on to learn how we’ve progressed, and what we still aim to do, in order to: • Minimize our climate impact • Manage our climate-related risks and opportunities • Develop new capabilities to enable our customers and partners to transition to a low-carbon economy • Support community programs and initiatives to help build more climate-resilient and equitable communities In May 2022, we closed our first-ever ESG bond issuance. We intend that an amount equivalent to the net proceeds of the $1 billion ESG bond will be allocated toward projects in the Green and Social categories, including investments in green buildings and initiatives supporting a circular economy. JOINING FORCES FOR LOW-CARBON COMMUNITIES Advancing climate solutions globally requires a collaborative approach, so in April and May 2022, we announced new partnerships with nonprofits. Through grants to American Forests, C40 Cities, National Park Foundation, and Earthwatch Institute, we plan to fund projects and initiatives to support nature-based solutions and sustainability efforts in local communities, particularly in urban areas. Partnering with these organizations is another important step in our objective to advance climate solutions. Read more in Our Inaugural $1 billion ESG Bond. INTRODUCTION PROMOTING DE&I ADVANCING CLIMATE SOLUTIONS BUILDING FINANCIAL CONFIDENCE OUR ESG GOVERNANCE & OPERATING RESPONSIBLY SUPPORTING DATA OUR COMMITMENT TO ESG 42
In 2019, we set a goal to have 60% of the total square footage of leased or owned facilities actively occupied by American Express be green building certified by 2025. Since the beginning of 2019, we have spent more than $150 million on the development of facilities that have received green building certifications. MOVING TO NET-ZERO We support the shift toward a low-carbon economy, in line with the science-based recommendations of the Intergovernmental Panel on Climate Change. In 2021, we maintained CarbonNeutral® certification across our global operations, including offices, field sites, and data centers, in accordance with the CarbonNeutral Protocol, a leading third-party framework, and our operations remained powered by 100% renewable electricity. 6 Following on these steps, we have committed to net-zero emissions by 2035 in alignment with the Science-Based Targets initiative (SBTi). 7 We made this commitment based on the SBTi’s most ambitious level of climate action, to limit global warming to 1.5 degrees Celsius above pre-industrial levels. In signing on to the Business Ambition for 1.5°C and the UN Race to Zero Campaign, American Express is among a growing roster of more than 1,400 companies setting targets to the 1.5°C goal. Since our operations are already carbon neutral, we will focus on our supply chain and work with our vendors, encouraging them to establish their own science-based emissions reduction targets and track, reduce, and eventually neutralize their operational greenhouse gas (GHG) emissions. 2025 operational environmental goals In 2019, we set operational environmental goals for 2025 that cover energy and water use, waste generation, green building certifications, the phaseout of single-use plastics, and responsible paper sourcing; in 2021, we made progress on these goals. However, our reductions in energy, waste, and water were also greatly impacted by office closures due to the pandemic and we expect usage to increase as colleagues return to the office. While progress toward our operational environmental goals will not be linear, we expect to continue to make important advances to meet them over the next few years. 6. Operations include all our managed facilities, field sites, and data centers. Managed facilities are individual properties operationally managed by our global real estate team and housing critical business functions. Field sites are individual properties that are not operationally managed by our global real estate team but directly by our business units. They are typically smaller sites, less than 30,000 square feet (including airport lounges, foreign exchange kiosks, and sales offices), that are owned or leased by American Express. The company’s goal to remain carbon neutral covers Scope 1 (direct emissions from sources owned or controlled by American Express), Scope 2 (indirect location-based and market-based emissions), Scope 3 emissions (Category 5 waste generated in operations and Category 6 business travel) through renewable energy credits, carbon offsets, and reduced GHG emissions. 7. American Express is following the methodology of the SBTi for our commitment to net-zero by 2035, which covers all Scope 1 and 2 emissions and a minimum of two-thirds of total Scope 3 emissions in conformance with the GHG Protocol Corporate Value Chain (Scope 3) Accounting and Reporting Standard. $150M+ INTRODUCTION PROMOTING DE&I ADVANCING CLIMATE SOLUTIONS BUILDING FINANCIAL CONFIDENCE OUR ESG GOVERNANCE & OPERATING RESPONSIBLY SUPPORTING DATA OUR COMMITMENT TO ESG 43
8. Operations include all our managed facilities, field sites, and data centers. Managed facilities are individual properties operationally managed by our global real estate team and housing critical business functions. Field sites are individual properties that are not operationally managed by our global real estate team but directly by our business units. They are typically smaller sites, less than 30,000 square feet (including airport lounges, foreign exchange kiosks, and sales offices), that are owned or leased by American Express. The company’s goal to remain carbon neutral covers Scope 1 (direct emissions from sources owned or controlled by American Express), Scope 2 (indirect location-based and market-based emissions), Scope 3 emissions (Category 5 waste generated in operations and Category 6 business travel) through renewable energy credits, carbon offsets, and reduced GHG emissions. For more detailed data on our Scope 1, 2, and 3 emissions, please see the Environmental Performance Data Summary and Limited Assurance Statement of GHG Emissions in the Supporting Data: Our Commitment to Transparency section at the end of this report. 9. Energy use reduction since 2011 calculations are based only on managed facilities where metered data is available which represents 6,786,897ft2 and 99,856 MWh of energy consumption in 2021 and excludes field sites, managed sites with estimated data, and data centers not operationally managed by our global real estate team. 10. The waste data is reported only for managed facilities where measured data is available. This represents approximately 67% (4,781,326 ft2) of the globally managed facilities footprint in 2021. 11. Definition of zero-waste is aligned with the US Green Building Council’s standard of a minimum of 90% waste diversion from landfills to achieve zero-waste certification. 12. Green building certified percentage is represented by the total year-end square footage certified out of total year-end building square footage. This includes leased or owned facilities actively occupied by American Express (excluding parking lot square footage) that have achieved certification under a global or locally recognized third-party environmental building certification system as meeting their performance criteria (LEED, BREEAM, NABERS, GreenMark, HQE, and Effinergie+). Energy & Emissions Remain carbon neutral across our operations 8 Continue to power our operations with 100% renewable electricity 8 Reduce energy use by 35% across our managed facilities compared to 2011 9 Waste & Recycling Divert 60% of office waste from landfills from our managed facilities 10 Achieve zero waste certification for US headquarters 11 Reduce waste generated from our managed facilities by 10% per colleague compared to 2019 In 2021, our operations continued to be impacted by office closures due to COVID-19, implementation of best practices to support health and safety during the pandemic, and adoption of more flexible work arrangements for our colleagues. Because these changes impacted performance on our operational environmental goals against our 2019 pre-pandemic baseline, we have temporarily suspended reporting our performance against these three goals and we are reviewing our methodologies in relation to these changes. Water Reduce water use from managed facilities by 10% per colleague compared to 2019 Sourcing Eliminate single-use plastics across our operations Source 100% of direct marketing, customer communications, and office paper from certified responsibly managed forests Green Buildings Achieve green building certifications for 60% of our operations 12 Progress on our 2025 operational environmental goals Achieved—carbon neutral since 2018 Achieved—100% renewable electricity since 2018 Exceeded Target 57% 35% On Track Target 54% 60% On Track Target 56% 60% On Track Target 32% ≥90% On Track Target 96% 100% Making progress in energy efficiency and Scope 1, 2, and 3 emissions In 2021, we continued to implement energy efficiency initiatives including lighting retrofits, HVAC equipment upgrades, and new building control systems, which are expected to save approximately 1,500 MWh of energy use per year. Due to these measures and the reduction in energy demand due to temporary work-from-home arrangements, energy consumption in the facilities we manage in 2021 decreased by approximately 57% compared to our 2011 baseline. We use several measures in addition to energy efficiency measures to help mitigate GHG emissions from our global operations, including onsite solar electricity generation, energy attribute certificates (EACs), and carbon offsets. Since 2018, we have powered our global operations with 100% renewable electricity. In 2021, we produced approximately 561 MWh of renewable solar electricity at our North Carolina data center and Brighton, UK office and we purchased 202,170 MWh of EACs. EACs verify the production of renewable electricity in an amount equivalent to the total electricity consumption and we purchase in alignment with the technical guidance from RE100, a global coalition of leading businesses committed to using 100% renewable electricity. We also purchased 22,770 MTCO2e of carbon offsets in 2021, including wind power development, reforestation, and forest conservation projects. These projects offset our emissions from activities such as fuel consumption, as well as Scope 3 emissions from colleague business travel, and the waste generated in our operations. For more detailed data on our consumption of electricity, renewable energy, water, and waste, please see the Environmental Performance Data Summary and Limited Assurance Statement of GHG Emissions in the Supporting Data section at the end of this report. 2025 Environmental Goals 2021 Performance INTRODUCTION PROMOTING DE&I ADVANCING CLIMATE SOLUTIONS BUILDING FINANCIAL CONFIDENCE OUR ESG GOVERNANCE & OPERATING RESPONSIBLY SUPPORTING DATA OUR COMMITMENT TO ESG 44
Data centers are critical to the smooth operation of our business. They also represent approximately 850,000 square feet of our building space and in 2021 used approximately 114,826 MWh—around 55% of the electricity that powers our operations. Our data centers produce 40% of our total Scope 1 and Scope 2 carbon emissions. Solar panels on our North Carolina data center generated approximately 546 MWh of solar electricity in 2021, and energy efficiency measures across all our data centers have saved an estimated 3,600 MTCO2e in 2021. Our data centers report a power usage effectiveness (PUE) 13 of 1.62 for our production data center, 14 1.59 for our redundancy data center, 15 and 1.72 for our testing data center. At our data center in Gurgaon, India, we implemented several energy efficiency and sustainability measures in 2021, including installing high-performance thermal insulation that meets India’s Energy Conservation Building Code (ECBC) standards and reduces external heat gain, and equipping the UPS (Uninterruptable Power Supply) system with high-efficiency modular units. RENEWABLE ENERGY AND INCREASING ENERGY EFFICIENCY AT OUR DATA CENTERS 13. The PUE is the total overall utility load divided by the total load needed to support the data halls. We collect data from strategic metering devices within our building systems as well as our Energy Performance Management System (EPMS) which reports real-time PUE data. 14. Primary Data Center for Daily BAU (business-as-usual) activities 15. Disaster Recovery Data Center for Production Data Center Optimizing our workspaces As we work to reduce our energy use, maintain carbon neutrality, and find ways to reduce the environmental impact of our real estate footprint, we strive to design, build, and operate facilities that consume less resources, emit fewer greenhouse gases, and improve the quality of the indoor environment for our colleagues’ well-being. We seek to follow sustainability best practices, including the U.S. Green Building Council’s Leadership in Energy and Environmental Design (LEED) certification program and other international green building standards including BREEAM, NABERS, GreenMark, HQE, and Effinergie+. In 2021, 25 of our facilities in 14 countries, representing approximately 56% of our global real estate portfolio, have achieved green building certifications, progress that puts us closer to meeting our goal of achieving green building certifications for 60% of our operations in 2025. 16 Green Building Certifications (%) 50% 55% 56% 2021 2020 2019 The rooftop solar at our North Carolina data center LEED New Construction Gold Certified data center in North Carolina 16. Green building certified percentage is represented by the total year-end square footage certified out of total year-end building square footage. This includes leased or owned facilities actively occupied by American Express (excluding parking lot square footage) that have achieved certification under a global or locally recognized third-party environmental building certification system as meeting their performance criteria (LEED, BREEAM, NABERS, GreenMark, HQE, and Effinergie+). INTRODUCTION PROMOTING DE&I ADVANCING CLIMATE SOLUTIONS BUILDING FINANCIAL CONFIDENCE OUR ESG GOVERNANCE & OPERATING RESPONSIBLY SUPPORTING DATA OUR COMMITMENT TO ESG 45
We work to improve the sustainability and comfort of our office with ergonomic furniture and sustainable construction materials based on LEED standards. We also allocate workspace and remote work capabilities in ways designed to offer our colleagues flexibility and to use our real estate efficiently. Balancing sustainability and safety during the COVID-19 pandemic As detailed earlier in this section, we made substantial progress against our operational environmental goals for 2025. However, our reductions in energy, waste, and water across our global operations continued to be impacted by office closures due to COVID-19, health and safety best practices during the pandemic, and adoption of more flexible work arrangements for our colleagues. Because these changes impacted performance on our operational environmental goals against our 2019 pre-pandemic baseline, we have temporarily suspended reporting our performance against our colleague waste and water and single-use plastics goals and we are reviewing our methodologies in relation to these changes. Building attendance remained very low worldwide through 2021. Following best practices to support colleague health and safety during the pandemic, we removed reusable items from our cafeterias. In 2020 and 2021, to ensure we followed best practices to support health and safety during the pandemic and as a result of COVID-19-related building closures, we temporarily suspended tracking performance against our single-use plastic goal across our operations. As colleagues return to the office and water usage, energy usage, and waste generation increase, we will examine data and building attendance to give us more accurate insights into our performance against pre-pandemic baselines. Engaging, educating, and making improvements to decrease water use In 2019, we set a goal to reduce water consumption at our managed facilities by 10% per colleague by 2025. We are working toward this goal through colleague engagement and education and building design, such as low-flow fixtures and automatic water faucets in our newly-opened office building in Phoenix. In 2021, we consumed 166,171 cubic meters across our global operations, 72% lower than 2019 and substantially impacted by office closures and work-from-home arrangements due to the pandemic. Sharpening our focus on waste reduction and management Four of our 2025 operational environmental goals are designed to reduce and divert landfill-bound waste and to phase out single-use plastics. We launched several initiatives in 2019 to support these goals, including a composting program at our New York headquarters. We have had to adapt some of these activities to meet COVID-19-related safety protocols, including the reintroduction of single-use paper cups in our floor pantries, although we have nevertheless seen a reduction in total waste generation, due in large part to office closures and work-from-home arrangements. In 2021, we diverted 54% from landfills compared to 52% in 2020. Find more water and waste data in the Environmental Performance Data Summary at the end of this report. INTRODUCTION PROMOTING DE&I ADVANCING CLIMATE SOLUTIONS BUILDING FINANCIAL CONFIDENCE OUR ESG GOVERNANCE & OPERATING RESPONSIBLY SUPPORTING DATA OUR COMMITMENT TO ESG 46
ALIGNING CLIMATE EFFORTS TO GLOBAL BEST PRACTICES We aim to align our efforts with global best practices among the numerous standards and frameworks that have emerged for measuring climate impact and action and promoting accountability for businesses. In addition to our commitment to net-zero emissions by 2035 in alignment with the Science Based Targets initiative, we joined the Business Ambition for 1.5°C and Race to Zero, established by the UN to rally leadership for a zero-carbon recovery. We are also a member of RE100, a global initiative of large businesses committed to using 100% renewable electricity. Further, we became a formal supporter of the Task Force on Climate-Related Financial Disclosures (TCFD), whose recommendations inform how we assess physical and transition risks and opportunities for our business. Learn more about how we are assessing and managing climate risk in the TCFD Index. Maintaining resiliency and business continuity To maintain resiliency and business continuity in our offices and data centers we factor climate-related physical risks into our short-, medium-, and long-term real estate strategies. One of our newer buildings in Sunrise, Florida, for example, is designed to withstand Category 5 hurricanes and major flooding events. In addition, we evaluate qualitative climate- related transition risks that may impact our global operations, including current and emerging regulations. These climate- related risks influence our operational strategy and we have identified opportunities to minimize these risks, including by maintaining carbon neutrality and continuing to invest in energy efficiency projects and renewable electricity. Operating an environmentally and socially responsible supply chain In 2021, we sourced 96% of our direct marketing, customer communications, and office paper from certified responsibly managed forests, working toward a goal of 100% in 2025. We’re committed to working with suppliers who share our values regarding diversity, ethical sourcing, and responsible operations, including environmental sustainability, human rights, and gender equality. Learn more about our responsible procurement practices in Responsible Sourcing Throughout the Global Supply Chain. Find more detail about our paper sourcing in the Environmental Performance Data Summary at the end of this report. Paper from Certified Responsibly Managed Forests Direct marketing, customer communications, and office paper 96 % INTRODUCTION PROMOTING DE&I ADVANCING CLIMATE SOLUTIONS BUILDING FINANCIAL CONFIDENCE OUR ESG GOVERNANCE & OPERATING RESPONSIBLY SUPPORTING DATA OUR COMMITMENT TO ESG 47
BACKING OUR COLLEAGUES Engaging our colleagues through Green2Gether Engaging our colleagues in sustainability initiatives through the Green2Gether program is an important goal of our ESG strategy, and we engage thousands of our colleagues during the year, offering workplace climate education, waste and energy reduction efforts, and volunteer opportunities with non-profit partners. Volunteer-led Green2Gether activities range from beach cleanups to recycling drives to innovative virtual Earth Day campaigns during the COVID-19 pandemic. Every April during Earth Month, colleagues around the world can participate in dozens of company-sponsored activities, such as recycling drives, online lectures, community clean-ups, and sustainability awareness campaigns. In 2021, we engaged colleagues virtually to support the planting of 100,000 trees in partnership with The Nature Conservancy’s Plant a Billion Trees campaign, funding approximately 210,000 trees in total since 2017. In 2022, colleagues have engaged in environmentally-focused in-person and/or virtual volunteer activities and events with The Central Park Conservancy, United Way of Salt Lake City, South Downs National Park (UK), PRIDE+ Network, Compass Group, Catchafire, and others. CONNECTING OUR COLLEAGUES TO CLIMATE SOLUTIONS AND THE GREAT OUTDOORS The National Park Foundation’s Service Corps programs support essential preservation projects in national parks across the US. Through a new multi- year partnership, we’re providing a total of $1 million in funding over the next three years to support the Service Corps program, building on over $5.7 million in funding to the National Park Foundation since 2015. In partnership with the Ocean Conservancy and International Coastal Cleanup, American Express colleagues collected approximately 24,000 pounds of marine debris globally from 2018 to 2022. Colleagues participated in beach cleanups and other initiatives across seven countries, including Australia, Italy, Japan, Malaysia, the Philippines, Spain, and the US. INTRODUCTION PROMOTING DE&I ADVANCING CLIMATE SOLUTIONS BUILDING FINANCIAL CONFIDENCE OUR ESG GOVERNANCE & OPERATING RESPONSIBLY SUPPORTING DATA OUR COMMITMENT TO ESG 48
BRANCHING OUT OUR SUSTAINABILITY ACTIVITIES IN MEXICO AND LATIN AMERICA We have partnered with Reforestamos México, A.C. since 2016 on volunteering efforts to support conservation efforts across Mexico. Most recently, we have assisted Reforestamos in its actions to conserve more than 200 hectares of forests across five communities. From 2019 to 2021, colleagues participated in reforestation efforts including planting 4,000 native trees and performing maintenance on fire breaks in the Nevado de Toluca Protected Natural Area. We also supported efforts to scale nature-based climate solutions. In 2021, we provided funding to the Latin American Seminar on Forest Entrepreneurship and Investment. The virtual event brought together 800 forestry entrepreneurs, investors, and attendees from government and academia from 16 countries in Latin America to identify nature-based solutions to address climate change. Colleagues also engage in supporting our Advance Climate Solutions goals by developing and implementing innovative programs, including Shop with Purpose initiative during Earth Month 2022. Helping Card Members “Shop with Purpose” During Earth Month Each year, American Express hosts a number of innovation challenges which give colleagues around the world the opportunity to pitch new ideas. New York-based colleagues, Christina Glynn, Director of Business Development—Future of Membership, Amex Digital Labs and Paul Collins, Director of Strategy and Business Planning, Global Commercial Services saw their idea to help customers shop at conscious-minded companies become a reality this year. Glynn and Collins believed there was an opportunity to support our sustainability efforts by highlighting merchants who share our values and bringing new offers to our Card Members. To help customers “Shop with Purpose,” Glynn and Collins developed and launched a curated collection of offers from Certified B Corp™ companies like Avocado Green Mattress, Stumptown Coffee Roasters and Vestiaire Collective, and other brands committed to making a difference. Featured throughout Earth Month in 2022, eligible US Consumer and Small Business Card Members were able to earn rewards for spend on eligible purchases with these merchants. Christina Glynn and Paul Collins saw their “Shop with Purpose” innovation challenge idea become a reality this year INTRODUCTION PROMOTING DE&I ADVANCING CLIMATE SOLUTIONS BUILDING FINANCIAL CONFIDENCE OUR ESG GOVERNANCE & OPERATING RESPONSIBLY SUPPORTING DATA OUR COMMITMENT TO ESG 49
Innovating low-carbon products and services Our customers and partners want to understand their environmental impact, reduce their carbon footprint, and play a part in the transition to a low-carbon economy. Across the company, we’re enhancing our capabilities to support them. For our corporate clients, we offer tools such as our Carbon Offset Referral Suite. The suite launched in June 2022 and provides US corporate customers with a curated list of carbon offset providers who can help them manage their footprint via offset solutions that include investments in large-scale carbon removal and reduction projects and avoidance projects. This year, we’re developing new offerings as we work toward our goal to pilot low-carbon product innovations by the end of 2022. With our Shop with Purpose program, which won our enterprise-wide Innovation Challenge in 2020, we provided customers with special promotions through Amex Offers with select Certified B Corp ™ companies and other brands committed to making a difference during Earth Month in 2022. BACKING OUR CUSTOMERS AND PARTNERS As climate action increases in importance for our customers and partners, we’re exploring new ways to deliver responsible products and services, help our customers make informed decisions, and promote responsible travel and conscientious consumption. To reinforce this, in 2021, we set a goal to pilot low-carbon product innovations by the end of 2022. 17. Methodology: This Amex Trendex online poll was conducted by Morning Consult between February 3-11th, 2022 among a national sample of 2,000 US and 1,000 travelers in Japan, Australia, Mexico, India, UK, and Canada who have a household income of at least $70K and defined as adults who typically travel by air at least once a year. Results from each market’s survey have a margin of error of plus or minus 3 percentage points. 18. American Express’ Carbon Footprint Tool calculations are derived by applying selected conversion factors to spending made with the following American Express Corporate products: Corporate Card, Business Travel Account, Corporate Meeting Card, Corporate Purchasing Card, Buyer Initiated Payments, vPayments and Amex Go. The estimated information provided by the Carbon Footprint Tool is for generalized informational purposes only and does not constitute financial, tax, accounting, legal or other professional advice on any subject matter. Product names and features may vary by country, and not all products or features are available in all countries. According to the latest Amex Trendex, a trend report from American Express, 76% of consumers surveyed feel a greater urgency to address climate change than they did a year ago, and 84% of consumers surveyed agree they would like to better understand their carbon footprint. 17 76% We currently make our Carbon Footprint Dashboard available to certain commercial clients to help track estimated carbon emissions associated with their employees’ air travel. We are now expanding this tool to include additional categories of spend—including ground transportation, hotel stays, restaurants, and retail—helping corporate clients better understand their carbon footprint so they can find opportunities to manage carbon emissions. 18 INTRODUCTION PROMOTING DE&I ADVANCING CLIMATE SOLUTIONS BUILDING FINANCIAL CONFIDENCE OUR ESG GOVERNANCE & OPERATING RESPONSIBLY SUPPORTING DATA OUR COMMITMENT TO ESG 50
Promoting a circular economy and expanding recycled plastic cards To reduce the company’s consumption of virgin plastic, in 2019, we launched the first American Express Card manufactured primarily from reclaimed plastic collected from beaches and coastal communities. Since then, we have set a goal for the vast majority of plastic cards issued by American Express be made from at least 70% recycled or reclaimed plastic by the end of 2024. By achieving this goal, we can help avoid nearly 160,000 pounds of virgin plastic from being used annually. To support this goal, we have already begun expanding our offerings to integrate recycled plastic into our card materials. In summer 2021, we launched our first card made from recycled PVC in Canada. In 2022, we announced that France will become the first market to shift to recycled plastic for almost all of our plastic cards. Additionally, as an example of collaboration with our strategic partners to collectively support our sustainability goals, we partnered with Delta Air Lines on the Delta SkyMiles American Express Cards made from 70% reclaimed plastic that achieved CarbonNeutral® product certification. In 2019, we launched our Card Take Back Program that enables US Card Members to return both plastic and non-plastic cards by mail for recycling. Since the launch of the program, we’ve recycled more than 1.3 million cards, including cards returned by Card Members. 19. “Electronic” includes payments received via phone, online, Auto Pay, third-party remits and wire transfers 20. Includes Global Consumer, Global Small Business and US Corporate Card Members More than 1.3 million cards recycled since 2019, including cards returned by Card Members through our Card Take Back Program in the US 1.3M+ Increasing paperless payments and statements In 2021, 95% of Card Member payments were electronic 19 and 66% of statements were paperless, 20 up from 94% and 61%, respectively, in 2020. INTRODUCTION PROMOTING DE&I ADVANCING CLIMATE SOLUTIONS BUILDING FINANCIAL CONFIDENCE OUR ESG GOVERNANCE & OPERATING RESPONSIBLY SUPPORTING DATA OUR COMMITMENT TO ESG 51
Partnering to create a sustainable, low-carbon future for travel Travel is a key part of our services and heritage. Our ESG efforts in this area start at home by offsetting our carbon footprint associated with employee business travel— including third-party air, rail, and rental cars. To reduce the impact of executive travel, for example, we continue to scale up our use of Sustainable Aviation Fuel (SAF) in our corporate jet fleet. In 2021, we partnered with the World Economic Forum on several initiatives. As a member of the World Economic Forum’s Global Future Council on Sustainable Tourism, we are working with government, business, and academic leaders to advance innovation on inclusive and sustainable tourism. We are also a member of the World Economic Forum’s Clean Skies for Tomorrow Coalition, which supports efforts to transition to sustainable aviation fuel and achieve carbon neutral air travel across the aviation sector. We also signed on to the Clean Skies for Tomorrow 2030 Ambition Statement, to accelerate the supply and use of sustainable aviation fuel technologies to reach 10% of the global jet aviation fuel supply by 2030. Additionally, through our Global Insights and Advisory Team, we offer our large and global corporate customers data-driven insights into the changes in business travel due to the pandemic, data that can help benchmark their existing travel polices against their peers and reporting on considerations on the environmental impact of business travel generally. BOOM SUPERSONIC: INVESTING AND PARTNERING TO SUPPORT SUSTAINABLE TRAVEL In March 2021, our Ventures team announced our strategic investment in this innovative aerospace company Boom Supersonic, which is seeking to build a supersonic and sustainable airliner. Our backing is expected to help fund the continued development of the Overture, Boom’s flagship product. The Overture is anticipated to be able to run on up to 100% sustainable aviation fuel, including biofuels manufactured using renewable materials, and other low-carbon fuel technologies. We also became a founding member of the Boom Sustainable Travel Forum, a partnership to forge relationships and exchange ideas with the private sector, NGOs, and industry experts, which convened for the first time at the inaugural Net Good Summit in November 2021. 21. Methodology: Amex Trendex online poll conducted by Morning Consult between February 3-11, 2022 among a national sample of 2,000 travelers in the US and 1,000 travelers in Japan, Australia, Mexico, India, UK, and Canada who have a household income of at least $70,000 and defined as adults who typically travel by air at least once a year. Results from each country survey have a margin of error of plus or minus 3 percentage points. In our 2022 Global Travel Trends Report, 78% of respondents stated that they want to have a positive impact on the community they are visiting. 21 We signed on to the Clean Skies for Tomorrow 2030 Ambition Statement, to accelerate the supply and use of sustainable aviation fuel technologies to reach 10% of the global jet aviation fuel supply by 2030. 10% INTRODUCTION PROMOTING DE&I ADVANCING CLIMATE SOLUTIONS BUILDING FINANCIAL CONFIDENCE OUR ESG GOVERNANCE & OPERATING RESPONSIBLY SUPPORTING DATA OUR COMMITMENT TO ESG 52
BACKING OUR COMMUNITIES We seek to advance climate solutions through programs and initiatives that help build more climate-resilient and equitable communities. In 2021, we set a goal to provide at least $10 million in support by the end of 2025 for initiatives, partnerships, and programs that address the adverse effects of climate change and pollution on communities. To support this goal, we launched a new community giving priority: Backing Low-Carbon Communities. Community giving to advance low-carbon and nature-based solutions Backing Low-Carbon Communities grants support nature-based solutions, community-led climate initiatives, and disaster response and resilience efforts in local communities, particularly in urban areas. Since last year’s announcement of our philanthropic commitment of $10 million by 2025, we have provided $3.1 million in grants to help back low-carbon communities, including grants to: American Forests t o support its Tree Equity program by bringing more native and climate-resilient trees to four US cities where American Express has offices: Phoenix, New York, Salt Lake City, and Sunrise, Florida. The grant will provide support to help identify and increase local tree nurseries, plant urban forests, and create entry-level jobs to help historically marginalized populations transition into the tree care industry. Additionally, the grant will help expand Tree Equity Score to its first international location, a tool that indicates whether neighborhoods have enough trees for everyone to experience their health, economic and, climate benefits. “ We are grateful for the incredible commitment American Express has made to support Tree Equity and climate resiliency in cities. The work we’re doing together will boost the supply of trees that communities need to equitably cool and cleanse the air in their neighborhoods and create local jobs in the process, even giving us the capacity to expand this work to other countries.” – JAD DALEY , PRESIDENT AND CEO OF AMERICAN FORESTS In 2022, we announced $3.1 million in grants to American Forests, the National Park Foundation, Save the Children UK, C40 Cities, and Earthwatch Institute to support nature-based solutions and sustainability efforts in local communities, particularly in urban areas. $3.1M TOWARD OUR $10 MILLION COMMITMENT INTRODUCTION PROMOTING DE&I ADVANCING CLIMATE SOLUTIONS BUILDING FINANCIAL CONFIDENCE OUR ESG GOVERNANCE & OPERATING RESPONSIBLY SUPPORTING DATA OUR COMMITMENT TO ESG 53
National Park Foundation to support service corps programs over the next three years. These programs will deliver job opportunities for young people from underrepresented backgrounds and identities to experience careers in the outdoors. Service Corps members will engage in essential preservation projects that help alleviate the effects of climate change in national parks across the US. Save the Children U.K. to support its Adolescent Skills for Successful Transition program to educate youth on sustainable practices and products and fund the development of its Green Climate Fund pipeline to develop youth-led climate adaptation projects. Learn more in Supporting Climate Action Globally. C40 Cities to fund its efforts to develop consumption-based emissions inventories in New York City and London to inform a suite of actions to incentivize more sustainable consumption in collaboration with people and businesses. The project is also expected to pioneer new ways for other cities to measure emissions from urban consumption. Announced in May 2022 by New York City Mayor Eric Adams and C40 Chair and Mayor of London, Sadiq Khan, this partnership will help both cities in delivering C40’s Good Food Declaration by providing data and insights to increase access to nutritious food and reduce food waste. Earthwatch Institute to fund the planting of a Tiny Forest in the United Kingdom, helping to mitigate the impacts of climate change and enhance biodiversity. The grant will also provide planting, maintenance, and monitoring volunteer opportunities to our colleagues and support the creation of a Climate Change Master Class for our colleague base. The class, led by scientists, will provide education and tools to help our colleagues reduce the impacts of climate change. Supporting resilient communities globally We continued to fund disaster relief and response efforts around the world, as we have for many years. To build on these efforts, we are providing support for disaster relief and resilience building programs and initiatives to help create climate-resilient communities in extreme weather prone areas and cities where our colleagues and customers live and work. These grants aim to build capacity for mitigating the impacts of climate change, focusing on areas such as land management, water stewardship, climate resilience and adaptation, and education. RALLYING INTO ACTION AFTER EXTREME WEATHER EVENTS As extreme weather events disrupted communities worldwide throughout 2021, we were there to help with more than $650,000 for disaster response, working with organizations such as the Red Cross, Feeding America, and the International Medical Corps. Our support focused on addressing the immediate needs of those who have been injured or displaced, providing temporary shelter and meals for first responders and affected families, distributing clean-up supplies, and connecting affected people to mental health support, COVID-19 supplies, and other assistance. INTRODUCTION PROMOTING DE&I ADVANCING CLIMATE SOLUTIONS BUILDING FINANCIAL CONFIDENCE OUR ESG GOVERNANCE & OPERATING RESPONSIBLY SUPPORTING DATA OUR COMMITMENT TO ESG 54
Through these partnerships and resources, we backed communities in need in connection with the following extreme weather events and natural disasters: • Floods devastated Germany and Western Europe • Multiple tornadoes swept across the Midwest and Southern US • Winter storms resulted in widespread power outages in Texas • Hurricane Ida brought catastrophic wind damage, rain, flooding, and dangerous tornadoes to the US Gulf Coast and Northeast • Wildfires in California destroyed hundreds of homes and businesses and forced citizens across the state to evacuate • A 7.2 magnitude earthquake resulted in widespread damage and left thousands in need of support in Haiti We engage our colleagues by matching eligible colleague contributions toward disaster relief through the American Express Match program, recommending charities, and connecting US colleagues to information about becoming an American Red Cross disaster response volunteer. In Sierra Leone, Save the Children U.K. is conducting research in 20 highly climate-vulnerable communities along the coastline. The goal is to provide ideas to enhance opportunities for innovation and sustainable income generation in the coastal community. A special emphasis is to ensure women and youth have access to new skills, networks, markets, and institutions to become more climate-resilient and enhance sustainable development. SUPPORTING CLIMATE ACTION GLOBALLY To help fight the impact of climate change on the most vulnerable populations across Asia and Africa, we have partnered with Save the Children U.K. to develop and execute programs that engage youth to help reduce food insecurity exacerbated by climate change, support climate-resilient economic development and skills training through green job opportunities, and strengthen early warning systems to help these communities better prepare for extreme weather events. As part of these activities, we announced a $600,000 grant to support Adolescent Skills for Successful Transition, an educational program on sustainable practices and products, and to fund the development of a Green Climate Fund pipeline for youth-led climate adaptation projects. INTRODUCTION PROMOTING DE&I ADVANCING CLIMATE SOLUTIONS BUILDING FINANCIAL CONFIDENCE OUR ESG GOVERNANCE & OPERATING RESPONSIBLY SUPPORTING DATA OUR COMMITMENT TO ESG 55
57 Our Vision for Building Financial Confidence 58 Progress and Highlights 59 Building Financial Confidence and Resilience for Our Colleagues, Customers, and Communities 60 Backing Our Colleagues 62 Backing Our Customers and Partners 69 Backing Our Communities Building Financial Confidence
OUR VISION FOR BUILDING FINANCIAL CONFIDENCE PROVIDE RESPONSIBLE, SECURE, AND TRANSPARENT PRODUCTS AND SERVICES TO HELP PEOPLE AND BUSINESSES BUILD FINANCIAL RESILIENCE 1. Based on spend as reported by consumers in surveys commissioned by American Express (not actual receipts or sales). STRATEGIC OBJECTIVES GOALS • Invest $500 million to build more resilient and equitable communities from 2021 through 2025 • Support small businesses, including by reaching $100 billion in spending by consumers at small, independently-owned retailers or restaurants on Small Business Saturday and during other Shop Small campaigns from 2021 through 2025 1 • Provide access to credit to at least four million individuals from underserved or underrepresented populations from 2021 through 2025 • Provide at least five million individuals with tools, resources, and educational content to improve financial well-being from 2021 through 2025 Empower individuals to build and maintain their financial well-being through products, services, tools, and education while providing robust account security Strengthen the financial security and money management capacity of small businesses through products, services, campaigns, and initiatives Help build resilient communities through grants, programs, and initiatives that support economic empowerment and equity INTRODUCTION PROMOTING DE&I ADVANCING CLIMATE SOLUTIONS BUILDING FINANCIAL CONFIDENCE OUR ESG GOVERNANCE & OPERATING RESPONSIBLY SUPPORTING DATA OUR COMMITMENT TO ESG 57
$11M+ Provided more than $11 million in philanthropic support for COVID-19 relief efforts since the start of the pandemic pledged to Backing Small grant programs to support thousands of small businesses $17M $23.3B in reported spending by US consumers on Small Business Saturday in 2021 3 4.5M enrolled users of MyCredit Guide, a free service that gives consumers access to their credit scores, along with tools and information to help them take charge of their credit, as of May 2022 3. The American Express 2021 Small Business Saturday Consumer Insights Survey was conducted by Teneo on behalf of American Express and the National Federation of Independent Business (NFIB). The study is a nationally representative sample of 2,426 US adults 18 years of age or older. The sample was collected using an email invitation and an online survey. The study gathered self-reported data and does not reflect actual receipts or sales. It was conducted anonymously on November 28, 2021. The survey has an overall margin of error of +/- 2.0%, at the 95% level of confidence. Projections are based on the current US Census estimates of the US adult population, age 18 years and over. 2. The Nilson Report, February 2022. 15 YEARS Maintained the lowest US fraud rates among major credit card networks for 15 consecutive years 2 $265M in community development loans and investments through the American Express Center for Community Development in 2021 Progress and Highlights INTRODUCTION PROMOTING DE&I ADVANCING CLIMATE SOLUTIONS BUILDING FINANCIAL CONFIDENCE OUR ESG GOVERNANCE & OPERATING RESPONSIBLY SUPPORTING DATA OUR COMMITMENT TO ESG 58
BUILDING FINANCIAL CONFIDENCE AND RESILIENCE FOR OUR COLLEAGUES, CUSTOMERS, AND COMMUNITIES At American Express, building financial confidence—for our colleagues, our customers, and in our communities—is a natural extension of our role as a global financial services leader and is a core pillar of our ESG strategy. Our efforts to build financial confidence start at home with our colleagues. Through competitive benefits, financial support such as additional contributions to US colleagues’ retirement accounts, and skill-building opportunities like our Harvard Leadership Edge program, we are helping our colleagues build their financial confidence and resilience. For our customers, we’re empowering individuals to build and maintain their financial well-being through products and services, such as MyCredit Guide and Score Goals and our new all-digital US consumer checking account. We also continue to support local small businesses through initiatives like Shop Small and Small Business Saturday. In our communities, we are helping build resilience through grants, programs, and initiatives that support economic empowerment and equity. We are expanding our reach into our communities through partnerships, such as our Backing Small grant programs that support economically vulnerable small business owners, and an expanded global partnership with Junior Achievement Worldwide to provide financial literacy education and training to students in 11 countries. Through our American Express Center for Community Development (CCD), we provided $265 million in community development loans and investments in 2021 that supported small business needs, job creation and retention, and affordable housing. We are excited to share progress against our goals and highlights from our new and longstanding programs. You’ll also learn about how we are addressing common challenges within our industry, from strengthening data privacy and security to protecting our customers against fraud. Read on to learn more about how we have been helping our colleagues, customers, and communities build financial confidence. INTRODUCTION PROMOTING DE&I ADVANCING CLIMATE SOLUTIONS BUILDING FINANCIAL CONFIDENCE OUR ESG GOVERNANCE & OPERATING RESPONSIBLY SUPPORTING DATA OUR COMMITMENT TO ESG 59
Building financial knowledge and providing planning resources Whether planning for college, buying a home, or budgeting daily expenses, smart saving pays off. We help our colleagues build their knowledge and skills for all life stages through our global Smart Saving programs. In the US, this includes financial planning coaching sessions and workshops, retirement webinars, and on-demand access to financial education resources, as well as offers for savings on everyday expenses. Through our financial planning partner, Goldman Sachs Ayco Personal Financial Management (Ayco), we provide US colleagues access to Ayco’s Financial Wellness program which includes a digital platform, one-on-one guidance from a financial coach as well as financial planning webinars offered throughout the year. We connect US colleagues to digital tools and resources to help their financial decision-making on topics ranging from debt management, benefits, retirement, investing, tax planning, and estate planning. US Colleagues can also track their income and spending habits and work with a coach to make goals and a plan to achieve them. We also partnered with certain of our colleague networks in 2021 and held network-specific workshops to educate, encourage coaching sessions, and promote the platform. For the third consecutive year, we helped our US colleagues manage their student debt through the SAVEtember and Smart Saving Student Debt Programs. These programs provided 300 colleagues with student debt a $500 cash award once they completed a financial wellness assessment and attended a financial well-being webinar on managing student loan debt. Through the American Express Scholarship Program, we also help American Express colleagues in the US and Canada fund their children’s undergraduate college education through scholarship awards based on financial need that range from $2,000 to $4,000 per year. In 2021, these scholarships totaled over $365,000. BACKING OUR COLLEAGUES Building financial confidence starts at home, with our colleagues. INTRODUCTION PROMOTING DE&I ADVANCING CLIMATE SOLUTIONS BUILDING FINANCIAL CONFIDENCE OUR ESG GOVERNANCE & OPERATING RESPONSIBLY SUPPORTING DATA OUR COMMITMENT TO ESG 60
Encouraging retirement savings Retirement funds are a great way to build financial confidence for the future. For US colleagues, we match 100% of 401(k) contributions up to 6% of total pay after six months of service, and all matching contributions are immediately vested. For 2021, US new hires were automatically enrolled at 3% of total pay, with a 1% automatic annual increase up to 10% of total pay. For 2022, US new hires are automatically enrolled at 6% of total pay. Those previously enrolled at 3%, will be brought up to 6%, and will continue with an annual automatic increase of 1% up to 10% of total pay. Resources that keep careers growing Professional growth and development are another important aspect of financial confidence. Our investment here starts with opportunities for colleagues to learn on the job, build cross-functional skills, and grow in their careers through a defined, collaborative process for performance management. Colleagues have access to a wide variety of resources: career coaching, mentoring, professional networking, and rotation opportunities, as well as courses on demand and with classroom-style instruction. Since 2018, our New People Leader Program, for example, has helped more than 3,000 first-time managers through the executive level prepare for their new roles. When analysts, team leaders, managers, and directors sought hands-on, customized ways to build their leadership skills, we responded with Harvard Leadership Edge. Based on colleague feedback, this eight-week program is grounded in our Leadership Behaviors, with self-guided lessons colleagues can apply on the job. Over 1,500 colleagues enrolled in our first 2021 offering of Harvard Leadership Edge. We also made available to colleagues LinkedIn Learning, a platform that provides quick and easy access to thousands of online courses and videos. The platform offers lessons in seven languages on topics including leadership, business skills, technology, and personal development. ~1M Colleagues viewed nearly 1 million LinkedIn Learning videos in 2021. In 2021, 94% of US colleagues took advantage of our retirement plan, up from 93% in 2020. 94 % Over 1,500 colleagues enrolled in our first 2021 offering of Harvard Leadership Edge, a hands-on, customized eight-week program for building leadership skills. INTRODUCTION PROMOTING DE&I ADVANCING CLIMATE SOLUTIONS BUILDING FINANCIAL CONFIDENCE OUR ESG GOVERNANCE & OPERATING RESPONSIBLY SUPPORTING DATA OUR COMMITMENT TO ESG 61
Expanding our long-term efforts to back small businesses Supporting small businesses worldwide through Shop Small We launched Small Business Saturday in 2010 to help independent retailers and restaurants gain more customers in the wake of the financial crisis. Over the past 12 years, the campaign has evolved into a tradition for consumers and merchants across the United States. US consumers reported spending an estimated $163 billion 4 at small businesses on Small Business Saturday since the movement started, and 2021 marked a record year, with an 18% increase in total estimated projected spending from 2020. 5 Shop Small has grown into a global, year-round movement. To address the challenges of the pandemic, we strengthened our support even more. In 2020, we committed more than $200 million to jumpstart spending at small businesses, and in 2021 committed $100 million to our Let’s Go Shop Small campaign. 6 Small Business Saturday’s impact expands beyond the merchants and individuals making purchases on one particular day. In the American Express 2021 Small Business Saturday Consumer Insights Survey, 70% of survey respondents reported that Small Business Saturday makes them want to encourage others to shop at small, independently owned retailers, too. 7 4. This spend statistic is an aggregate of the average spend as reported by consumers who shopped small on Small Business Saturday in surveys commissioned by American Express reporting spend habits on Small Business Saturday since 2012. It does not reflect actual receipts or sales. Each such survey was conducted online among a nationally representative sample of US adults. The data was projected from the samples based on then-current US Census estimates of the US adult population (18+). 5. The American Express 2020 Small Business Saturday Consumer Insights Survey was conducted by Teneo on behalf of American Express and the National Federation of Independent Business (NFIB). The study is a nationally representative sample of 2,572 US adults 18 years of age or older. The sample was collected using an email invitation and an online survey. The study gathered self-reported data and does not reflect actual receipts or sales. It was conducted anonymously on November 29, 2020. The survey has an overall margin of error of +/- 2.0%, at the 95% level of confidence. Projections are based on the current US Census estimates of the US adult population, age 18 years and over. 6. Our commitment of up to $200 million in 2020 supported a Card Member offer and the associated marketing campaign to encourage American Express Card Members in select countries around the globe to Shop Small in their local communities and online. Our commitment of more than $100 million supported Card Member offers, as well as marketing to encourage customers in select countries to support small businesses in 2021. 7. The American Express 2021 Small Business Saturday Consumer Insights Survey was conducted by Teneo on behalf of American Express and the National Federation of Independent Business (NFIB). The study is a nationally representative sample of 2,426 US adults 18 years of age or older. The sample was collected using an email invitation and an online survey. The study gathered self-reported data and does not reflect actual receipts or sales. It was conducted anonymously on November 28, 2021. The survey has an overall margin of error of +/- 2.0%, at the 95% level of confidence. Projections are based on the current US Census estimates of the US adult population, age 18 years and over. 8. Spending based on the American Express 2020 and 2021 Small Business Saturday Consumer Insights Survey. BACKING OUR CUSTOMERS AND PARTNERS We are focused on strengthening the financial security and money management capacity of small businesses through products, services, campaigns, and initiatives, and empowering individuals to build and maintain their financial well-being through products, services, tools, and education, while providing robust account security. On Small Business Saturday 2021, US consumers reported spending an estimated $23.3 billion at independent retailers and restaurants, up from an estimated $19.8 billion in 2020, the highest projected spending to date. 8 INTRODUCTION PROMOTING DE&I ADVANCING CLIMATE SOLUTIONS BUILDING FINANCIAL CONFIDENCE OUR ESG GOVERNANCE & OPERATING RESPONSIBLY SUPPORTING DATA OUR COMMITMENT TO ESG 62
Our small business resources also responded to specific challenges and needs outside the United States. • In Japan, we collaborated with a delivery platform on discount offers, used crowd- funding to drive support for small restaurants impacted by the pandemic, and provided sanitization tool kits to help small business owners welcome their customers safely. • In the UK, consumers reported spending an estimated £598 million at small businesses on Small Business Saturday, held December 4, 2021. 9 • In Canada, approximately 145,000 Card Members enrolled in Shop Small offers, driving 582,000 redemptions at more than 90,000 merchants in 2021. • In Australia, American Express has given $24 million and more than 1.5 billion points back to Card Members through Shop Small offers from 2013 through 2021. MAKING A BIG IMPACT FOR LOCAL BUSINESSES WORLDWIDE Our flagship Shop Small campaign encourages consumers worldwide to support their local independent businesses. To address the challenges of the pandemic, we committed more than $100 million to encourage customers to support small businesses as part of our Let’s Go Shop Small campaign in 2021. In the UK, for example, our research showed that targeted social media drove UK consumers to spend more with small businesses. To connect consumers and merchants, we created an online map and shared Social Spotlights of four independent businesses in London. Overall, UK consumers reported spending an estimated £598 million at small businesses on Small Business Saturday in the UK. 9 In Australia, thousands of businesses took part in Shop Small, including many micro- businesses. “The resilience that Australian small business operators have shown throughout the COVID-19 crisis has been extraordinary. And it’s encouraging to see consumers, big business, and government rallying to back the sector, but now is not the time for complacency,” says Lisa Belcher, Vice President of Small and Medium Enterprises for American Express in Australia. “That’s why Shop Small is returning to remind shoppers that if they want to see these businesses survive, they have to take action and spend with them regularly.” 9. Estimated spend based on data collected from 4,000 UK adults polled by market research agency Opinium between 5pm on Saturday 4 December 2021 and 10pm on Sunday 5 December 2021. The £598 million figure for national spending calculated using ONS estimation of the UK adult population based on self-reported shopper estimates of spend and does not reflect actual receipts or sales. INTRODUCTION PROMOTING DE&I ADVANCING CLIMATE SOLUTIONS BUILDING FINANCIAL CONFIDENCE OUR ESG GOVERNANCE & OPERATING RESPONSIBLY SUPPORTING DATA OUR COMMITMENT TO ESG 63
Educational resources to support small business growth Our global network of Customer Care Professionals is just one way we have our customers’ backs. Small and mid-size firms often lack the time, tools, and resources to pursue business growth opportunities or gain new skills and expertise. Business Advocacy programs such as Business Class address this need through lifestyle-like content and experiences, including articles, events, video series, Instagram Live content, and more—all available to business owners at no cost. In 2021, we debuted the first season of a new video series called Business Class: The Series that takes viewers around the world and across industries to learn real-life lessons from fellow entrepreneurs. Episodes explore different ways to approach everyday business challenges including leadership, finance, marketing, strategy, and managing growth. We made learning interactive with two new seasons of “Office Hours”—casual and informative conversations taking place live on Instagram, where entrepreneurs and experts answer business owners’ questions and offer advice. To help thousands of small businesses owners network and grow their capital and customers budgets, we hosted our annual free, Business Class LIVE event, where they virtually connected with and learned from leading thinkers, business executives, and entrepreneurs. Our powerful backing for the restaurant community In 2019 we acquired the restaurant booking platform Resy and together we help restaurant businesses thrive. Throughout the pandemic, we supported independent restaurants by providing fee relief and digital tools to help them run their businesses, data-based insights to help restaurants plan smarter, marketing and programming to back the restaurant community, and incentives for Card Members to order take out. As the impacts of the pandemic continued in 2021, American Express and Resy responded with a series of initiatives to drive customers to small independent restaurants to help with their recovery and long-term growth. In February 2021, we launched the Order In, Help Out campaign that encouraged consumers to make #TakeoutTuesday a weekly occurrence and introduced new dining offers on certain American Express Cards. In 2022, we followed up with “Every Resy Counts,” a reservation drive as part of the Shop Small campaign that encouraged millions of people across the country to dine at independent restaurants in March 2022. The “Every Resy Counts” initiative is part of our broader “Let’s Grab a Table” Shop Small marketing campaign which was focused on bringing attention and support to independent restaurants throughout the United States. To help these restaurants rally their customers, we created complimentary toolkits with content, social media posts, signage, and more, as well as specially curated offers, and videos and articles from industry experts to help them grow and manage their businesses. “ The industry is starting to see the effect of the past two years. And that’s when companies like Amex and Resy step up huge to say, this has to change. We have to be there for the industry.” – CHRIS SHEPHERD, JAMES BEARD AWARD-WINNING CHEF AND CO-FOUNDER OF SOUTHERN SMOKE Learn more about how we are supporting restaurants in Backing Small for Underrepresented and Economically Vulnerable Small Business Owners. INTRODUCTION PROMOTING DE&I ADVANCING CLIMATE SOLUTIONS BUILDING FINANCIAL CONFIDENCE OUR ESG GOVERNANCE & OPERATING RESPONSIBLY SUPPORTING DATA OUR COMMITMENT TO ESG 64
Helping individuals improve their financial health with confidence Building financial confidence opens doors for people to enrich their lives. One of our ESG objectives is to empower individuals to build and maintain their financial well-being through products, services, tools, and education. In fall 2021, we announced two new goals: to provide access to credit to at least four million individuals from underserved or underrepresented populations from 2021 through 2025, and provide at least five million individuals with tools, resources, and educational content to improve financial well-being from 2021 through 2025. We seek to make available financial education resources and financial literacy programs to young people, first-time credit users, and experienced credit users who want to improve their financial management skills. Our efforts are also focused on product transparency, responsible marketing, non-discrimination throughout the credit lifecycle, and robust privacy and security programs. Expanding our reach in financial management and education With MyCredit Guide and Score Goals, we helped millions manage their credit. Free to all consumers on our website, MyCredit Guide provides one-stop access to a user’s VantageScore® 3.0 credit score, as well as a detailed TransUnion personal credit report and a credit score simulator to see how actions like paying down debt or opening a new account could affect their score. Users can also sign up for instant email alerts for any changes in their credit reports. Through our US-based Credit Intel Financial Education Center, we help consumers enhance their knowledge about building credit, understanding credit reports, and understanding different types of credit cards, features, and benefits. The site shows how credit scores work—and how to improve them. 4.5M As of May 1, 2022, MyCredit Guide had more than 4.5 million enrolled users. In 2021, the Credit Intel site attracted 2.8 million unique visitors—up from 1.1 million in 2020. INTRODUCTION PROMOTING DE&I ADVANCING CLIMATE SOLUTIONS BUILDING FINANCIAL CONFIDENCE OUR ESG GOVERNANCE & OPERATING RESPONSIBLY SUPPORTING DATA OUR COMMITMENT TO ESG 65
JOINING FORCES WITH INNOVATIVE STARTUPS To connect people worldwide to new and innovative ways of building their financial confidence, Amex teamed up with Zogo Financial Education. When college student Bolun Li realized how little his peers knew about financial literacy topics like taxes and insurance deductibles, he responded with a solution tailored specifically for his generation: Zogo Financial Education, an app designed to make financial education about debt repayment, health insurance, homebuying and more, fun. In 2021, we partnered with Zogo on a pilot program to offer custom-tailored content and additional incentives embedded within the app’s gamified experience. This joint effort provided Gen Z users with an opportunity to gain valuable financial literacy skills toward their financial well-being. Amex Ventures also invested in the startup BodesWell in 2020, and American Express and BodesWell later co-developed and launched the pilot product My Financial Plan in 2021, a self-service financial planning tool designed to give Card Member users a complete picture of their financial health and help them make and work toward major life goals, such as buying a house or retirement. The pilot launched in July 2021 and has provided select American Express Card Members with the opportunity to try out My Financial Plan, to see how income, assets, expenses, liabilities, and cash flow come together for planning life events. Helping global consumers gain access to credit in the US Many newcomers to the United States lack access to US credit due to their international credit histories being “stopped at the border.” Since 2019, we’ve been backing the efforts of San Francisco-based fintech Nova Credit to address this problem. Nova Credit’s Credit Passport® seamlessly and securely integrates into the American Express online card application process, enabling applicants’ credit records from certain international credit reporting agencies to be instantly translated into a US-equivalent credit report and score in just a few clicks allowing American Express to make an application decision. This industry-first integration has helped thousands of newcomers from Australia, Canada, India, Mexico, and the UK access their credit reports and get approved for an American Express Card. In December 2021, we expanded the application’s reach to people from four more countries: Brazil, Dominican Republic, Kenya, and Nigeria. “ Our work with American Express over the past two years has shown us the sheer impact access to financial services has on newcomers. Nova Credit now has the ability to help even more newcomers experience financial success as they navigate the tumultuous process of immigration— supporting our ultimate mission for newcomers to arrive and thrive.” –MISHA ESIPOV, CO-FOUNDER, AND CEO OF NOVA CREDIT INTRODUCTION PROMOTING DE&I ADVANCING CLIMATE SOLUTIONS BUILDING FINANCIAL CONFIDENCE OUR ESG GOVERNANCE & OPERATING RESPONSIBLY SUPPORTING DATA OUR COMMITMENT TO ESG 66
Cybersecurity and customer privacy Our customers trust us with their valuable financial and personal information. • Data protection: Our Data Protection and Privacy Principles guide how we collect, use, store, share, transmit, delete, or otherwise process customers’ personal data. With cybersecurity threats on the rise, we continue to enhance our information security program. Our information security program is designed to identify risks and protect the confidentiality, integrity, and availability of our data, as well as our information systems. We also maintain an enterprise-wide incident response program. • Privacy: Our Privacy Statement describes how we collect, use, and share data when customers use our online or mobile products and services, and the choices they can make related to marketing, sharing, and targeted advertising. We inform our customers about the personal information we collect, and the choices they have related to the sharing of personal information, through product-specific privacy notices. Our website’s Privacy Center also provides US customers with transparent, simple-to-use resources. Merchants who used our Enhanced Authorization process to identify parties on the other end of a financial transaction typically saw fewer false positives and fraud reduction of up to 60%. We enhance our monitoring tools, controls, and policies for fraud detection and prevention with our “closed loop” relationships with Card Members and merchants. We have access to information at both ends of the card transaction and build algorithms and other analytical tools designed to identify and reduce fraud. Our integrated payments platform allows us to analyze information on Card Member spending while respecting Card Member preferences and protecting Card Member and merchant data in compliance with applicable policies and legal requirements. Continued advancement in fraud prevention American Express maintains industry-leading fraud rates among major card networks through practices that engage customers and merchants, respond to escalating threats, leverage new technologies, and more. We ran a Card Member Fraud Education campaign in 2020 and 2021 that used social media to teach customers how to stay vigilant against attempts to steal online login credentials, card details, and other personally identifiable information. For businesses, our wholly-owned subsidiary Accertify launched Refund Abuse Protection in 2021, which is designed to help merchants mitigate fraudulent refund requests. This complements and augments the capabilities of Digital Identity, which Accertify introduced in 2020 to help businesses address fraudulent online account openings and takeovers. Across payment channels, we continue to invest in more secure connections and authentication mechanisms. For our US customers, we deploy behavioral analytics that can help identify and stop fraud during the application process. Protecting our customers American Express has maintained the lowest US fraud rates among major card networks for the past 15 years, according to the February 2022 Nilson Report. 15 YEARS INTRODUCTION PROMOTING DE&I ADVANCING CLIMATE SOLUTIONS BUILDING FINANCIAL CONFIDENCE OUR ESG GOVERNANCE & OPERATING RESPONSIBLY SUPPORTING DATA OUR COMMITMENT TO ESG 67
view and understand how our offers will work in practice, including the risks, controls, and monitoring associated with end-to-end execution, including fulfillment and servicing. We regularly review marketing offers and credit decisions and investigate the root causes of customer complaints and continue to review and enhance our processes and controls related to our sales practices and business conduct generally. Fair lending and financing: We have a global compliance program that includes governance processes, board reporting, monitoring, testing, and analytics. This includes risk assessments on fair lending and consumer practices. To strengthen accountability, we conduct regular colleague trainings on compliance with applicable laws and regulations, such as Equal Credit Opportunity Act and Unfair, Deceptive, or Abusive Acts or Practices in the United States. We work with clients on debt repayment through a variety of financial relief options, from temporarily lowered annual percentage rates to waived fees. We may also refer Card Members to nonprofit credit counseling services as needed. Learn more about our data protection, privacy, and responsible lending practices in the Our ESG Governance and Operating Responsibly section. Leading customer support and services Our efforts to build financial confidence are also reflective of our company vision to provide the world’s best customer service every day. We back our offerings with a service network of colleagues and partner Customer Care Professionals and Travel Counselors around the world. Our customer service network is also powered by colleagues and partners who work in support areas such as digital tools, learning, capabilities, fulfillment, and analytics. Responsible sales and marketing: Our marketing programs are subjected to multiple layers of review across business units that are designed to make our offers clear, simple, and easy to understand. We strive to consider all reasonable interpretations from a customer’s or prospect’s point of • Ranked #1 in J.D. Power 2021 US Credit Card Satisfaction Study for 11th time in the last 15 years • Ranked #1 for our mobile app and website in the J.D. Power 2021 US Online & Mobile App Credit Card Satisfaction Studies RANKED # 1 INTRODUCTION PROMOTING DE&I ADVANCING CLIMATE SOLUTIONS BUILDING FINANCIAL CONFIDENCE OUR ESG GOVERNANCE & OPERATING RESPONSIBLY SUPPORTING DATA OUR COMMITMENT TO ESG 68
BACKING OUR COMMUNITIES Building financial confidence is important in the communities where we live, work, and operate. To this end, we’ve created goals to support economic empowerment and equity through grants, programs, and initiatives. We’re proud of our progress so far. Toward our goal of investing $500 million in building more resilient and equitable communities from 2021 through 2025, we have underwritten $265 million in community development loans and investments in 2021 through The American Express Center for Community Development (CCD). These funds support small business needs, job creation and retention, and affordable housing, including the development of more than 1,900 units of affordable housing. We also continue to expand our Backing Small initiative, including $17 million in funds committed through 2024 to support underrepresented and economically vulnerable small business owners and entrepreneurs and includes grant programs, mentoring support, and technical assistance through established community partnerships. Programs include: • The Coalition to Back Black Businesses • Backing Historic Small Restaurants • Backing International Small Restaurants • Inclusive Backing • Blueprint: Backing BIPOC Businesses in Canada • First Nations Business Growth Program in Australia • Backing underrepresented-owned businesses: American Express and the US Black Chambers, Inc. worked together to expand ByBlack with the launch of the first national certification program exclusively for Black-owned businesses. First created as an extensive directory of Black-owned businesses, this no-cost digital platform now unlocks more ways to reach new customers and secure contracts for Black-owned businesses across the United States. ByBlack provides businesses an approved accreditation and enables consumers and other companies to easily find US-based Black-owned businesses. The Coalition to Back Black Businesses (CBBB), founded in partnership with the U.S. Chamber of Commerce Foundation and four national Black chambers, is now in its third year. In February 2022, amid supply-chain disruptions and the continuing pandemic, we announced that an additional 491 Black-owned small businesses across 39 states were each awarded a $5,000 grant as part of our multi-year, $10 million commitment and are eligible to apply for enhancement grants of $25,000 annually. 10. Based on survey conducted in Q4 2021 by the U.S. Chamber of Commerce Foundation A CONTINUING COMMITMENT TO BACK BLACK BUSINESSES 50% of grantees saw an increase in sales revenue in the second half of 2021 after receiving a Coalition to Back Black Businesses grant, compared to 33% of Black-owned businesses who did not receive a grant. 10 50% INTRODUCTION PROMOTING DE&I ADVANCING CLIMATE SOLUTIONS BUILDING FINANCIAL CONFIDENCE OUR ESG GOVERNANCE & OPERATING RESPONSIBLY SUPPORTING DATA OUR COMMITMENT TO ESG 69
Backing Small for underrepresented and economically vulnerable small business owners Our Backing Small grant programs help build inclusive economic growth and empowerment in our communities by supporting capital, financial education, literacy programs, mentoring, and training for underrepresented and economically vulnerable small business owners and individuals. Highlights include: • Backing Historic Small Restaurants: This campaign supports restaurants that contribute to their neighborhood’s unique history and identity as they face ongoing challenges resulting from the pandemic. To qualify, restaurants must be small and/or independently owned, located in a historic building or neighborhood, and have been in business for at least 25 years. We first launched this initiative in February 2021, working with the National Trust for Historic Preservation to help small restaurants that have contributed to the fabric of their communities so they can better serve their customers, financially recover, and grow their businesses. In March 2022, we announced a second round of Backing Historic Small Restaurants with the National Trust for Historic Preservation to award $40,000 grants to another 25 historic small restaurants throughout the United States. • Backing International Small Restaurants: This new grant program with the International Downtown Association Foundation brought our support for small restaurants to the international stage, supporting independent restaurants in London, Mexico City, Sydney, Tokyo, and Toronto with community significance, operated by underserved populations or in economic need. Through our Backing Small initiative, we provide financial support and resources to economically vulnerable small business owners. INTRODUCTION PROMOTING DE&I ADVANCING CLIMATE SOLUTIONS BUILDING FINANCIAL CONFIDENCE OUR ESG GOVERNANCE & OPERATING RESPONSIBLY SUPPORTING DATA OUR COMMITMENT TO ESG 70
BACKING COMMUNITY CAFÉS IN BRIXTON AND ‘REBEL IN THE KITCHEN’ IN MEXICO As part of the Dine Local program, run by the International Downtown Association and Brixton BID, and supported by American Express, 10 independent Brixton restaurants received £5,000 grants to make critical improvements to drive their business forward. Among the recipients is Lounge Brixton, which is supporting local artists by expanding its live performance space; Papa’s Café, a park-based community cafe serving local residents; and family-run restaurant Banh Banh Café, that plans to use the grant money to install new kitchen equipment. In March 2022, the IDA and the Placemaking México Foundation, supported by American Express, announced ten restaurants in Mexico that would receive the equivalent of $7,500 in Mexican pesos for adjustments and renovations to support their operations as part of the Backing International Small Restaurants program. One of the recipients is Doña Vero. Located at Colonia La Roma Sur, the eponymously named restaurant is a Mexican kitchen concept that combines pre-Hispanic and traditional flavors together with exotic and nutritional ingredients. The restaurant, run by its namesake, brings inclusion to gastronomy, running special tastings for people with disabilities and supporting local causes and businesses. INTRODUCTION PROMOTING DE&I ADVANCING CLIMATE SOLUTIONS BUILDING FINANCIAL CONFIDENCE OUR ESG GOVERNANCE & OPERATING RESPONSIBLY SUPPORTING DATA OUR COMMITMENT TO ESG 71
INTRODUCTION Section 4 Section NAME 3 Section NAME 7 Section 2 Section 6 Section NAME 1 38 • Inclusive Backing: Our Inclusive Backing grant program, in partnership with Main Street America, will provide 330 grants of $5,000 each to small business owners located in older or historic commercial districts across the country. The program will give priority to businesses that have been disproportionately impacted by the pandemic and give preference to businesses owned by underrepresented groups, including people of color, people with disabilities, women, and others. SUPPORTING ECONOMICALLY VULNERABLE SMALL BUSINESSES In February 2022, we launched the second of four grant cycles as part of the Inclusive Backing grant program in partnership with Main Street America. “Services that Back Us” will support small businesses in the personal service industry in the US that were deeply affected by the pandemic as early shutdowns and changing consumer behavior impacted foot traffic and revenue. The program awarded 75 personal service industry small businesses in older or historic commercial districts with a $5,000 grant to be used toward critical needs such as physical and digital improvements, new equipment, technology, and training to support their financial recovery and growth. The Inclusive Backing grant program with Main Street America will provide more than 300 grants of $5,000 each throughout 2022 over four cycles, including the “Services that Back Us” cycle described above. The program will give preference to businesses owned by underrepresented groups, including members of the LGBTQ+ community, people with disabilities, Veterans, women, and people of color. Learn more about some of the small business owners that we supported through this program in Inclusive Backing for AAPI-Owned Small Businesses. INTRODUCTION PROMOTING DE&I ADVANCING CLIMATE SOLUTIONS BUILDING FINANCIAL CONFIDENCE OUR ESG GOVERNANCE & OPERATING RESPONSIBLY SUPPORTING DATA OUR COMMITMENT TO ESG 72
INCLUSIVE BACKING FOR VETERANS “ I am a retired U.S. Army and Pennsylvania Army National Guardsman and together, my wife and I created our business as a mom-and-pop hoagie shop. Most sandwich shops around here are franchises, so we wanted to bring something special to our local community. Community to us is everything—we have customers who travel hours to our shop because they heard about us from a friend and customers can buy a meal and place it on our “pay it forward” board which will go toward the less fortunate. But between the pandemic and the current challenges met by inflation, this Inclusive Backing grant has been incredibly encouraging. A portion of the grant will be used to build a wheelchair ramp so we can offer a more inclusive environment and additional funds will be used toward insulation and re-siding to make the shop more energy efficient because with costs continuing to rise, we need to save money where we can.” – ROBERT CAPONE, CO-OWNER OF CAPONE’S HOAGIES IN NEWKIRK, OKLAHOMA Inclusive Backing for AAPI-Owned Small Businesses Our Inclusive Backing grant program, in partnership with Main Street America, is part of our Backing Small initiative to support small business owners. In February 2022, we announced the first 75 grant recipients who identified as members of the Asian American and Pacific Islander (AAPI) community or persons with disabilities. Four of these small business owners who are members of the AAPI community shared what these grants mean for their businesses. “ This is a grant that will help us keep our doors open while we continue to serve our community,” says James Dong, Owner of Last Minute Gear in San Francisco. Arianne Wing talked about being able to carry on the heritage of the L.T. Sue & Co. Tea Room & Emporium, her family’s multigenerational restaurant in Hanford, California’s China Alley Historic District. For Irene Tsukada Simonian—Owner of the Bunkado gift shop in Los Angeles’ Little Tokyo, the grant “validates all of the hard work that I put into this as well as my parents and my aunt and uncle who started this business.” “ It’s encouragement. It’s recognition,” says Ming-Yu Wu, Owner of the Wicked BAO restaurant in Fernandina Beach, Florida. “It means that someone out there is supporting the AAPI community.” INTRODUCTION PROMOTING DE&I ADVANCING CLIMATE SOLUTIONS BUILDING FINANCIAL CONFIDENCE OUR ESG GOVERNANCE & OPERATING RESPONSIBLY SUPPORTING DATA OUR COMMITMENT TO ESG 73
FACILITATING ACCESS TO MENTORS AND MORE IN CANADA For small businesses, mentorship can be a valuable tool for solving difficult business challenges—and it’s a resource that many Black, Indigenous, and People of Color (BIPOC) entrepreneurs in Canada lack. In a survey we commissioned of Canadian business owners, close to half (48%) of BIPOC respondents reported that they lacked mentors to help solve difficult business challenges, compared to just 32% of white entrepreneurs. 11 We responded with the Blueprint: Backing BIPOC Businesses ™ mentorship and grant program. The mentorship program, made possible by a grant from the American Express Foundation, brought in seasoned mentors and subject-matter experts to talk about topics ranging from strategic planning and leadership to operations management and financial modeling. One hundred participants from British Columbia to Newfoundland took part in group workshops, one-on-one coaching, and small group learning sessions. “ As a Black entrepreneur, I’ve always struggled with not only raising capital but finding a mentor and other BIPOC entrepreneurs to connect with,” says Harry Julmice, Owner of the Montreal-based content and production agency Never Was Average. “Through the Blueprint program, I’m hopeful that the mentorship component will help me save time, resources, and energy by providing me with the tools, guidance, and support I need to achieve my goals and build a sustainable business,” he adds. “ Women make up such a small percentage of Canadians working in the construction sector, and one of my goals is to help reduce some of those barriers to entry,” says Miyoko Oikawa, Owner of Toronto-based construction consulting company Building Energy Matters. “The mentor I’ve been matched with is assisting me in my development as an industry leader, and I’m confident that guidance will help me pay it forward with supporting other women in the industry.” We supplemented this effort with $10,000 grants for each of the 100 participants to fuel the growth of their business. In addition, all eligible businesses among the program’s 1,000-plus applicants received access to the “Launchpad for Blueprint” online skills development platform. Each one of the 100 participants received a $10,000 grant to fuel the growth of their business. $10K 11. This survey was conducted by The Nielsen Company on behalf of American Express from April 9 to April 29, 2021, among 1,124 Canadian business owners or partners in small or medium enterprises, 596 of which self-identify as Black, Indigenous or a Person of Color (BIPOC) and 528 of which self-identify as white. INTRODUCTION PROMOTING DE&I ADVANCING CLIMATE SOLUTIONS BUILDING FINANCIAL CONFIDENCE OUR ESG GOVERNANCE & OPERATING RESPONSIBLY SUPPORTING DATA OUR COMMITMENT TO ESG 74
Funding homes and inclusive real estate development Housing is key to community resilience and financial confidence. Our contributions to the Equitable Path Forward loan fund provide capital, grants, and program support to BIPOC and other historically marginalized developers in the real estate and community development industry. The CCD has also invested in a 39-unit affordable housing development in New Mexico. Units are reserved for members of the Mescalero Apache Tribe, with 20% of the project’s units for tribal members who are homeless or at risk of homelessness. Supporting financial literacy for K-12 students We formed a new partnership with the Council for Economic Education (CEE), whose mission is to equip K-12 students with the tools and knowledge of personal finance and economics so that they can make better decisions for themselves, their families, and their communities. Our latest grant will support teacher training in low- or middle-income schools, financial literacy events for parents and their children, and presentations to students at community organizations supported by American Express. Helping students around the world Our global partnership with Junior Achievement Worldwide will provide financial literacy education and training to students in 11 countries including Canada, India, Hong Kong, Japan, and Mexico. The program’s main objectives include cultivating the attitudes and behaviors that young people need to become financially capable, focusing where possible on under represented and underserved communities. We plan to leverage our colleague volunteers to help teach and mentor students as part of the program and we expect the Junior Achievement Worldwide program to reach over 5,000 students. Working together to expand financial literacy Across the US and around the world, nonprofits are at work helping to make communities and individuals more financially resilient. American Express partners with several of these nonprofits, using our resources to help extend their reach and amplify their impact. granted to Grameen America, Inc. through our Center for Community Development $75K INCREASING ACCESS TO AFFORDABLE LOANS FOR UNDERSERVED WOMEN ENTREPRENEURS American Express grants aid community organizations in accomplishing their mission. In the US for example, a $75,000 grant to Grameen America, Inc. through our Center for Community Development is funding efforts to increase access to affordable loans to low-income, underserved women entrepreneurs. Through microloans invested in their small businesses, the program aims to create jobs, enhance financial literacy, boost incomes, and build credit. INTRODUCTION PROMOTING DE&I ADVANCING CLIMATE SOLUTIONS BUILDING FINANCIAL CONFIDENCE OUR ESG GOVERNANCE & OPERATING RESPONSIBLY SUPPORTING DATA OUR COMMITMENT TO ESG 75
Our ESG Governance and Operating Responsibly 78 Our Corporate Governance Framework 79 ESG Governance 81 ESG and Executive Compensation 82 Our Business Ethics 84 Data Protection and Privacy 85 Risk Management 86 Responsible Sourcing Throughout the Global Supply Chain 87 Prioritizing Colleagues’ Health, Safety, and Well-being 88 Responsible Lending
OUR ESG GOVERNANCE AND OPERATING RESPONSIBLY AMERICAN EXPRESS HAS PROSPERED FOR MORE THAN 170 YEARS BY EMBRACING INNOVATION WHILE REMAINING TRUE TO CORE GUIDING VALUES. WE MAINTAIN POLICIES, PROCEDURES, AND LEADERSHIP OVERSIGHT THAT WE BELIEVE LEADS TO SOUND GOVERNANCE, ETHICAL BUSINESS PRACTICES, ROBUST RISK MANAGEMENT, AND COMPLIANCE WITH REGULATORY REQUIREMENTS. WE UNDERSTAND THAT GOOD GOVERNANCE MAKES OUR BUSINESS STRONGER AND WE INVEST RESOURCES TO MAINTAIN HIGH STANDARDS OF CONDUCT. INTRODUCTION PROMOTING DE&I ADVANCING CLIMATE SOLUTIONS BUILDING FINANCIAL CONFIDENCE OUR ESG GOVERNANCE & OPERATING RESPONSIBLY SUPPORTING DATA OUR COMMITMENT TO ESG 77 77
OUR CORPORATE GOVERNANCE FRAMEWORK Strong corporate governance starts at the top with diverse, experienced leadership, a culture of openness and accountability, and a comprehensive, considered structure of policies and practices. Our Corporate Governance Principles set the course for an ethical approach to business. Our Board of Directors and management review them to ensure they are appropriate and reflect our high standards and Blue Box Values. When recommending updates, the Board’s Nominating, Governance, and Public Responsibility Committee considers our shareholders’ views, as well as publicly available discourse on governance best practices. These principles, along with our Code of Conduct for colleagues, Code of Business Conduct for Members of the Board of Directors, and the charters of our Board’s four standing committees (Audit and Compliance; Compensation and Benefits; Nominating, Governance and Public Responsibility; and Risk) make up our governance framework. Key governance policies and processes also include our comprehensive Enterprise Risk Management (ERM) program, our Whistleblower Claims Policy, our commitment to transparent financial reporting, and our strong internal checks and balances. Comprehensive management policies, many of which are approved at the Board committee level, guide our operations. Our Board of Directors, a diverse group of leaders with substantial experience in their fields, oversees and sets the tone for operating responsibly. We continually review our Board’s composition to identify skills needed for the company, both in the near-term and into the future. The Nominating, Governance, and Public Responsibility Committee assesses potential candidates based on their history of achievement, the breadth of their business experiences, whether they bring specific skills or expertise in areas that the committee has identified as desired, and whether they possess personal attributes and experiences that will contribute to the sound functioning of our Board. Diversity is also a key consideration in our nomination and succession planning processes. Our Corporate Governance Principles provide that the Board should be diverse, engaged, and independent. When reviewing potential board nominees, the Nominating, Governance, and Public Responsibility Committee considers the holistic diversity of the Board, including gender, race, ethnicity, age, sexual orientation, and nationality, and does not discriminate on any basis. Learn more about diversity at American Express in the Promoting Diversity, Equity, and Inclusion section. BOARD MEMBER DIVERSITY Eight (57%) of our 14 Board members are women and/or are from diverse races or ethnic backgrounds, including four members who identify as Black or African American, one member who identifies as Hispanic / Latinx, and four members who identify as women. Learn more in Board of Directors Demographics. INTRODUCTION PROMOTING DE&I ADVANCING CLIMATE SOLUTIONS BUILDING FINANCIAL CONFIDENCE OUR ESG GOVERNANCE & OPERATING RESPONSIBLY SUPPORTING DATA OUR COMMITMENT TO ESG 78 78
The Compensation and Benefits Committee of the Board also oversees performance goals and certifies performance outcomes on key talent metrics. The Risk Committee of the Board provides oversight of our ERM framework, along with the policies and procedures established by management to identify, assess, measure, and manage key risks facing the company, including ESG risks, and approves our ERM policy, which governs risk governance, risk oversight, and risk appetite. ESG risks—in particular climate risk—are included in our ERM framework and climate-related risks are currently managed as part of our ERM process. ESG GOVERNANCE Our Executive Committee reviews and evaluates ESG performance and long-term goals with support from our ESG Steering Committee. Led by senior executives from across the company, the ESG Steering Committee developed the objectives and goals for our ESG strategy, drawing on the expertise of our four cross-functional ESG working groups: • Promote Diversity, Equity, and Inclusion • Advance Climate Solutions • Build Financial Confidence • ESG Disclosures Day to day, our Corporate Sustainability team works with colleagues throughout the company to shape our ESG programs and investments and monitor progress on key issues. ESG GOVERNANCE FRAMEWORK STAKEHOLDERS INCLUDING SHAREHOLDERS, COLLEAGUES, CUSTOMERS, AND COMMUNITIES ESG PILLARS BOARD OVERSIGHT SENIOR LEADERSHIP NOMINATING, GOVERNANCE, AND PUBLIC RESPONSIBILITY COMMITTEE Oversight of ESG matters RISK COMMITTEE Oversight of enterprise risk management framework EXECUTIVE COMMITTEE Reviews and evaluates ESG performance and long-term goals ESG WORKING GROUPS Comprised of leaders from across the organization responsible for the development and implementation of our ESG goals ESG STEERING COMMITTEE Led by senior executives from across the company that guide our ESG strategy and related policies and programs PROMOTE DIVERSITY, EQUITY, AND INCLUSION Support a diverse, equitable, and inclusive workforce, marketplace, and society ADVANCE CLIMATE SOLUTIONS Enhance our operations and capabilities to meet customer and community needs in the transition to a low-carbon future BUILD FINANCIAL CONFIDENCE Provide responsible, secure, and transparent products and services to help people and businesses build financial resilience COMPENSATION AND BENEFITS COMMITTEE Oversight of DE&I strategies and key talent metrics MISSION: BACK PEOPLE AND BUSINESSES TO THRIVE AND CREATE EQUITABLE, RESILIENT, AND SUSTAINABLE COMMUNITIES GLOBALLY Our Board’s Nominating, Governance, and Public Responsibility Committee reviews our ESG Strategy and Corporate Sustainability program, monitors progress against our goals, and provides guidance on our efforts. INTRODUCTION PROMOTING DE&I ADVANCING CLIMATE SOLUTIONS BUILDING FINANCIAL CONFIDENCE OUR ESG GOVERNANCE & OPERATING RESPONSIBLY SUPPORTING DATA OUR COMMITMENT TO ESG 79 79
Office of Enterprise Inclusion, Diversity, and Business Engagement In 2020, we established the Office of Enterprise Inclusion, Diversity, and Business Engagement, reporting directly to the Chairman and CEO. This expert team guides the rollout of our DE&I Action Plan, partnering closely with our Executive Committee, Chief Colleague Diversity, Equity & Inclusion and Talent Officer, and Colleague Advisory Networks worldwide. CHAIRMAN AND CEO OFFICE OF ENTERPRISE INCLUSION, DIVERSITY, AND BUSINESS ENGAGEMENT COLLEAGUE ADVISORY NETWORKS KEY PILLARS BRAND Authentically build brand relevance and brand affinity for Amex with Black, Latinx, Asian, LGBTQ+, and other underrepresented communities, customers, and colleagues CUSTOMER Develop holistic strategy across the Enterprise to strengthen our business with underrepresented consumers and small businesses CULTURE Become a company where explicit consideration of equity is integrated in everything we do to embody inclusion COLLEAGUE Create a culture that respects, values, and recognizes everyone by removing systemic barriers to achieving inclusion and advancement that drive company success BUSINESS Develop holistic strategy across the Enterprise to strengthen our business with suppliers in underrepresented groups and investments in businesses owned by underrepresented groups COMMUNITY Combat systemic racism and promote equity and advancement through our community initiatives and charitable priorities INTRODUCTION PROMOTING DE&I ADVANCING CLIMATE SOLUTIONS BUILDING FINANCIAL CONFIDENCE OUR ESG GOVERNANCE & OPERATING RESPONSIBLY SUPPORTING DATA OUR COMMITMENT TO ESG 80 80
ESG AND EXECUTIVE COMPENSATION Our executive compensation program is designed to support the company’s longevity and stability by driving long-term business outcomes, promoting strong governance practices, and encouraging responsible risk-taking. We do this by linking individual pay with company performance on a diverse set of measures, as well as financial and strategic goals. All senior executives have a large portion of compensation that is variable and covers annual and multi-year performance periods. The company scorecard incentivizes performance and includes key objectives in four categories: Shareholder, Customer, Colleague, and Strategic. In 2021, the Compensation and Benefits Committee modified its charter to include a review of strategies relating to diversity, equity, and inclusion initiatives as well as key talent metrics. We also increasingly link executive compensation to our ESG goals. For example, in years past, the company scorecard’s Colleague category included metrics for diversity representation, talent retention, culture, and inclusion as part of the calculation to determine incentive compensation for all eligible colleagues. In 2021, we also incorporated the management of key ESG priorities, including metrics, into our executive compensation program under the Strategic category of our annual scorecard. Our Board’s Compensation and Benefits Committee oversees performance goals across our categories and certifies performance outcomes. INTRODUCTION PROMOTING DE&I ADVANCING CLIMATE SOLUTIONS BUILDING FINANCIAL CONFIDENCE OUR ESG GOVERNANCE & OPERATING RESPONSIBLY SUPPORTING DATA OUR COMMITMENT TO ESG 81 81
We reinforce these values with our Code of Conduct, which establishes our expectations for ethical workplace behavior. The Code provides guidance on sensitive business practices such as gift-giving, expenses, appropriate technology use, conducting business with foreign governments, and protecting customer privacy. Our Blue Box Values guide how we operate as a company and include the following principles that every colleague commits to embracing and working by each day: OUR BUSINESS ETHICS The Code is an essential part of our daily global operations. We publish the Code in nine languages and require all colleagues to take and certify an annual training on its provisions. Abiding by the Code is a condition of working at American Express, and violations can result in termination. Colleagues are required to receive annual Global Regulatory Learning requirements on important policies, laws, and regulations that govern our industry, guide our company, and protect our colleagues, customers, and brand. WE BACK OUR CUSTOMERS WE MAKE IT GREAT WE DO WHAT’S RIGHT WE RESPECT PEOPLE WE EMBRACE DIVERSITY WE STAND FOR INCLUSION WE WIN AS A TEAM WE SUPPORT OUR COMMUNITIES BLUE BOX VALUES INTRODUCTION PROMOTING DE&I ADVANCING CLIMATE SOLUTIONS BUILDING FINANCIAL CONFIDENCE OUR ESG GOVERNANCE & OPERATING RESPONSIBLY SUPPORTING DATA OUR COMMITMENT TO ESG 82 82
WE PROVIDE OUR PERSPECTIVE TO OFFICIALS AT VARIOUS GOVERNMENT LEVELS WORLDWIDE AND COLLABORATE WITH TRADE AND INDUSTRY ASSOCIATIONS, INCLUDING: 1 Empowering colleagues to report ethics concerns We encourage colleagues, contractors, vendors, suppliers, and others to trust their instincts and feel comfortable raising concerns, from workplace conduct to suspected breaches of our Code of Conduct. To raise these concerns, we provide our global Amex Ethics Hotline online and by phone 24/7, staffed by representatives who among them speak more than 170 languages. An independent organization hosts the hotline and reporters can provide information confidentially or anonymously where local laws allow. Specially trained individuals at American Express promptly review all concerns raised and investigate further when appropriate. Our Whistleblower Claims Policy allows colleagues, contractors, customers, merchants, and others to report allegations in good faith without fear of retaliation or risk to their employment. Claims are investigated and recommendations are made by the Colleague Experience Group, Internal Audit Group, and Global Security, in consultation with our General Counsel’s Organization, as appropriate. Transparent and responsible corporate citizenship We believe active engagement in the public policy arena is vital to the democratic process and an important part of responsible corporate citizenship. We are transparent about our policy engagement with governments, including through Lobbying Disclosure Act filings in the United States. For more information, including lobbying requirements and our semiannual reporting of US political contributions, see our Political Contributions Report. American Bankers Association Association of Mexican Banks Australian Finance & Industry Association Bank Policy Institute Canadian Bankers Association Consumer Bankers Association European Payment Institutions Federation Indian Banks Association Japan Credit Card Association Partnership for New York City, Inc. Securities Industry & Financial Markets Association Spanish Association of Payment Institutions The Business Roundtable U.S. Chamber of Commerce UK Finance Western Bankers Association 1. This list is illustrative, and not intended to be comprehensive of the trade and industry associations with which we collaborate. INTRODUCTION PROMOTING DE&I ADVANCING CLIMATE SOLUTIONS BUILDING FINANCIAL CONFIDENCE OUR ESG GOVERNANCE & OPERATING RESPONSIBLY SUPPORTING DATA OUR COMMITMENT TO ESG 83 83
To address global ESG issues that affect us and our industry, like data privacy and security, we engage with our partners and peers through industry groups, roundtables, conferences, and other forums. For example, in 2021 we engaged in forums with the Data & Trust Alliance, the Centre for Information Policy Leadership, the Future of Privacy Forum, the Bank Policy Institute, and the Business Roundtable. Protecting our corporate, customer, and colleague information is a priority for us. With cybersecurity threats on the rise, we continue to enhance our global security measures. Our information and cybersecurity program is designed to identify risks and protect the confidentiality, integrity, and availability of our data, as well as our information systems. The program is built upon a foundation of advanced security technology, a well-staffed and highly trained team of experts, and robust operations based on the National Institute of Standards and Technology Cybersecurity Framework. This consists of controls designed to identify, protect, detect, respond, and recover from information and cybersecurity incidents. Through our cybersecurity governance framework, our internal teams report to the Board on cybersecurity at least once a year and to our Risk Committee at least twice a year, including at least one joint meeting with the Audit and Compliance Committee. The full Board and committees all receive ad hoc updates as needed and the Risk Committee annually approves the company’s Information Security Program. Learn more in our 2022 Proxy Statement . Our Data Protection and Privacy Principles governs the way we collect, use, store, share, transmit, delete, or otherwise process our customer and colleague personal data globally. As we innovate in fast-developing areas such as artificial intelligence and machine learning, our Global Risk and Compliance Team oversees policies and processes that are designed to enable us to adopt these technologies responsibly and ethically. Training Every colleague at American Express is accountable for how we protect and manage personal data about our customers, prospects, and colleagues. We educate our colleagues about our Data Protection and Privacy Principles through our Code of Conduct and mandatory annual information security and privacy training across our global operations. We also run simulations that test our colleagues’ ability to detect and respond to suspicious activity. Learn more about our commitment to data protection and privacy in Protecting Our Customers. DATA PROTECTION AND PRIVACY INTRODUCTION PROMOTING DE&I ADVANCING CLIMATE SOLUTIONS BUILDING FINANCIAL CONFIDENCE OUR ESG GOVERNANCE & OPERATING RESPONSIBLY SUPPORTING DATA OUR COMMITMENT TO ESG 84 84
RISK MANAGEMENT From cybersecurity threats to changes in the geopolitical landscape, risks to our business and operations are evolving and complex. We follow the “three lines of defense” approach to risk management: • The first line owns and manages risks and functions directly to initiate risk decision activities. • The second line functions independently to monitor and oversee first line risk management activities. • The third line, which consists of the Internal Audit Group, provides independent assurance that the first and second lines of defense operate effectively. Enterprise Risk Management (ERM) at American Express identifies, aggregates, monitors, and reports all risks and establishes the Company’s risk appetite and risk governance processes, culture, and capabilities. Our Chief Risk Officer oversees risks and risk management activities across the Company and chairs the Enterprise Risk Management Committee (ERMC), which oversees the Company’s governance approach to all risks. As part of its remit, the ERMC monitors compliance with risk appetite limits, escalations, and resolution activities to provide awareness of changes in the risk profile and drives continuous improvement of risk management processes and controls. The ERMC also reviews key risk exposures, trends, and concentrations and significant compliance issues and provides guidance on the steps to monitor, control, and report major risks. Our Board monitors our “tone at the top” and risk culture and oversees emerging strategic risks around the world. For more information on Board and management risk oversight, see our 2022 Proxy Statement. Maintaining business continuity and operational resilience Our Crisis Preparedness Program focuses on colleague safety and includes protocols for safeguarding and minimizing impacts to our buildings and assets. In addition, our Enterprise Resilience program addresses the maintenance of key business operations and supporting technology in the event of an unplanned disruption. We support this program with expert-developed and tested Business Continuity Plans, along with the tools, training, and guidance. Across our global supply chain, we assess the resiliency of key third-party service providers and require vendors that provide business critical services to maintain Business Continuity Plans. Colleagues who manage these vendors ensure that both Business Continuity Plans as well as potential Exit Plans are in place should they be needed, including a list of alternative suppliers and/or a strategy to bring the products and services in-house if necessary. a n d E x e r c i s e s D e v e l o p m e n t S t r a t e g i e s T e s t s , T r a i n i n g , P l a n R i s k R e d u c t i o n I m p r o v e m e n t A w a r e n e s s R e p o r t I n t e r d e p e n d e n c i e s A n a l y s i s R i s k A s s e s s m e n t C o n t i n u o u s S i t u a t i o n a l M e a s u r e a n d P o l i c y , S t r a t e g y , a n d B u s i n e s s I m p a c t B u s i n e s s C o n t i n u i t y V A L I D A T E I M P L E M E N T D E S I G N M O N I T O R A L I G N A S S E S S AMERICAN EXPRESS Enterprise Resilience INCORPORATING ESG INTO ENTERPRISE RISK MANAGEMENT How will climate change impact our operations and business as we transition to a low-carbon economy? In 2020 and 2021, we conducted a qualitative climate risk scenario analysis aligned with the Task Force on Climate-Related Financial Disclosures (TCFD) framework to assess physical and transition risks and opportunities to our business related to climate change. ESG risks—in particular climate risk— have been included as an emerging risk for the company, and are part of our Enterprise Risk Management (ERM) framework. Climate-related risks are currently managed as part of our ERM process. The Risk Committee of our Board of Directors provides oversight of our ERM framework, processes, and methodologies, and approves our Enterprise Risk Management policy, which governs risk governance, risk oversight, and risk appetite. Learn more in the TCFD Index. INTRODUCTION PROMOTING DE&I ADVANCING CLIMATE SOLUTIONS BUILDING FINANCIAL CONFIDENCE OUR ESG GOVERNANCE & OPERATING RESPONSIBLY SUPPORTING DATA OUR COMMITMENT TO ESG 85 85
RESPONSIBLE SOURCING THROUGHOUT THE GLOBAL SUPPLY CHAIN We seek to provide the world’s best customer experience including by relying on services provided by thousands of suppliers worldwide. We manage these vendors through our Global Supply Management team, with a focus on meeting regulatory requirements, managing risk across our global relationships, and enhancing product and service offerings. In selecting and managing suppliers, we use appropriate due diligence and contracting requirements depending on the relationship. Whenever possible, our Global Supply Management team seeks to work with suppliers from its Approved Supplier List, which consists of businesses that have successfully completed our risk assessment process. This process covers screening suppliers that trigger key risks including human rights, anti-corruption, data protection, and privacy protection. As part of our DE&I Action Plan, we have a goal to double our annual spend with underrepresented-owned suppliers in the US from a 2019 baseline to $750 million by the end of 2024. This includes increasing spend with Black-owned suppliers to at least $100 million annually. Learn more in Raising the Bar for Supply Chain Diversity. Our Reconciliation Action Plan in Australia is another example of our focus on responsible procurement. This action plan not only reflects, celebrates, and supports the role that Aboriginal and Torres Strait Islander peoples play in the country, it also communicates our desire to work with suppliers who share the same values related to supplier diversity, ethical sourcing, operating responsibly (including environmental sustainability), human rights, gender equality, and ending modern slavery. We guard against incidents of modern slavery and human trafficking within our business and supply chain by working with suppliers who share our values. See our Human Rights Statement, UK Modern Slavery Act Transparency Statement, and Australia Modern Slavery Statement in Key Policies in Supporting Data. “ Delivering products and services in a fair and transparent manner is critical to the best-in- class customer service that we provide.” – AMERICAN EXPRESS HUMAN RIGHTS STATEMENT INTRODUCTION PROMOTING DE&I ADVANCING CLIMATE SOLUTIONS BUILDING FINANCIAL CONFIDENCE OUR ESG GOVERNANCE & OPERATING RESPONSIBLY SUPPORTING DATA OUR COMMITMENT TO ESG 86 86
PRIORITIZING COLLEAGUES’ HEALTH, SAFETY, AND WELL-BEING Through our award-winning health and mental well-being program, Healthy Living and Healthy Minds, we provide holistic benefits and maintain company policies that promote wellness. Caring for Our Caregiver Colleagues Since the pandemic began, many of our colleagues took greater roles in caregiving for children, parents, and other loved ones. We have helped them manage work and life through programs like Amex Flex and a growing suite of resources, including access to BumoBrain Virtual Learning and Bright Horizons World at Home to help keep children engaged and learning, discounted access to tutoring, remote sessions on caregiving, and more. SUPPORTING COLLEAGUE CONNECTIONS WITH OUR COMMUNITIES Even during the COVID-19 pandemic, we kept our colleagues connected to volunteer opportunities that benefited both their mental health and communities worldwide. Our Serve2Gether Consulting Marathon, for example, supported 14 nonprofit organizations, engaging over 80 colleagues who donated 830 volunteer hours. “ As the Executive Sponsor of Families@Amex colleague network, and as a devoted son to two parents in their 90s, I know firsthand what a labor of love caregiving can be. While there are a range of emotions that come with caring for aging parents, I consider it the greatest gift to be able to support and care for the people who have given the world to me and my family and provided guidance and support. So many colleagues play critical roles in the day-to-day lives of their loved ones. I’d encourage all caregivers to lean into the backing, benefits, and community we have at Amex—it’s here for you in good and challenging times.” – DAVID KASIARZ, EXECUTIVE VICE PRESIDENT, COLLEAGUE TOTAL REWARDS AND WELL-BEING INTRODUCTION PROMOTING DE&I ADVANCING CLIMATE SOLUTIONS BUILDING FINANCIAL CONFIDENCE OUR ESG GOVERNANCE & OPERATING RESPONSIBLY SUPPORTING DATA OUR COMMITMENT TO ESG 87 87
RESPONSIBLE LENDING American Express is committed to responsible lending. We aim to accommodate our customers’ spending needs while providing appropriate lending capacity, with a strong focus on managing risk. No single factor determines our credit decisions. For consumer accounts, we look at credit payment history, reported income, overall debt level compared to financial resources, and credit bureau scores. For commercial clients, we consider a company’s size, financial information, and available reports from commercial bureaus, as well as information from consumer credit bureaus for our small business accounts. Our underwriting processes help us manage both our own credit exposure and our customers’ potential risk. We offer a variety of financial relief options, including a temporarily lowered annual percentage rate (APR) on our cards, waived fees, and other accommodations for customers enrolled in our financial relief program. In 2020, we created a Customer Pandemic Relief Program providing short-term support for customers impacted by COVID-19. We also enhanced and expanded our Financial Relief Program to provide assistance to customers in multiple countries. We may also refer Card Members to nonprofit credit counseling services as needed. We seek to be transparent and fair in our customer practices throughout the credit lifecycle. We regularly review marketing offers and credit decisions and investigate the root causes of customer complaints. When complaints require customer remediation, we follow an issue management process that is designed to deliver corrective actions and appropriate redress. We also conduct regular colleague training on compliance with applicable laws and regulations throughout the credit lifecycle—including marketing, underwriting, and collections activities—and track completion rates. In the United States, training includes the Equal Credit Opportunity Act and Unfair, Deceptive, or Abusive Acts or Practices. INVESTING ACTIVITIES As of December 31, 2021, a majority of the investment securities on the American Express Consolidated Balance Sheets represented US Treasuries backed by the federal government. We are also actively backing and collaborating with new businesses through our corporate venture group. Since 2011, American Express Ventures has invested in and partnered with startups to accelerate innovation for consumers and businesses. To date, we have backed more than 80 startups who are enhancing our own enterprise capabilities and shaping the future of commerce, payments, fraud prevention, data analytics, and security. INTRODUCTION PROMOTING DE&I ADVANCING CLIMATE SOLUTIONS BUILDING FINANCIAL CONFIDENCE OUR ESG GOVERNANCE & OPERATING RESPONSIBLY SUPPORTING DATA OUR COMMITMENT TO ESG 88 88
Supporting Data: Our Commitment to Transparency 93 Workforce Diversity and EEO-1 Data 96 Environmental Performance Data Summary 100 Limited Assurance Statement of GHG Emissions 103 Indexes TCFD Index SASB Index GRI Content Index
OUR COMMITMENT TO ESG Our priority ESG issues American Express prioritizes our ESG issues based on their relative importance to our business and to our stakeholders. We updated our priority ESG issues in 2020 by completing a comprehensive ESG materiality analysis. We collaborated with the think tank and advisory firm SustainAbility to guide our approach and we used the following methodology: 1. Current State Assessment: We conducted internal business research and external benchmarking to identify the most relevant ESG issues to our key stakeholders, industry, and company. As part of this process, we utilized an ESG big data software platform to review and integrate thousands of peer documents, regulations, and other relevant data points. Additionally, we evaluated leading ESG frameworks, including the Sustainable Accounting Standards Board (SASB), Global Reporting Initiative (GRI), the Sustainable Development Goals (SDGs), the Task Force on Climate- PRIORITY ESG ISSUES MATRIX CATEGORIES Environment Social/ Human Capital Governance/ Leadership Business Model/ Innovation Importance to business Executive compensation Responsible tax practices Waste reduction & recycling Responsible procurement Responsible investment & financing Public policy practices Board composition Responsible digitalization Anti- corruption & bribery INCREASING IMPORTANCE INCREASING IMPORTANCE Importance to stakeholders Colleague health & safety Social & environmental innovation Customer satisfaction Community resiliency Business ethics Financial resiliency Climate change, energy & GHG emissions Data privacy & security Responsible travel & consumption Inclusion & diversity Colleague attraction & retention related Financial Disclosures (TCFD) and more to inform our assessment. Outputs from the analysis were then considered to create a preliminary list of ESG issues. 2. Stakeholder Input: We utilized findings from our assessment to help guide our approach to collecting stakeholder input. Our third-party consultants interviewed more than 30 internal and external stakeholders, including the Chairman and CEO, all Executive Committee members, shareholders, customers, strategic partners, suppliers, nonprofit organizations, and others. We also conducted an ESG colleague survey across 16 business units worldwide. Further, we compiled and synthesized other ESG-related feedback received from stakeholders as part of our ongoing engagement process. Finally, we conducted an analysis of evolving expectations resulting from the global pandemic and its related impacts on our priority ESG issues. 3. ESG Issues Prioritization: Using outputs from our business analysis, benchmarking, and stakeholder engagement activities, we ranked our 20 priority ESG issues based on their relative importance to our business and their relative importance to our stakeholders. The following matrix highlights these results: INTRODUCTION PROMOTING DE&I ADVANCING CLIMATE SOLUTIONS BUILDING FINANCIAL CONFIDENCE OUR ESG GOVERNANCE & OPERATING RESPONSIBLY SUPPORTING DATA OUR COMMITMENT TO ESG 90
Engaging our stakeholders in ESG efforts Our ESG commitment starts with our stakeholders: shareholders, colleagues, customers, community organizations, and more. To better understand the ESG issues that matter most to them and advance our efforts to operate responsibly, we regularly engage with our stakeholders through a variety of channels. Our leaders collect ongoing colleague feedback through our annual Colleague Experience Survey, as well as open Q&A sessions and our Colleague Networks. We engage with our Card Members, businesses, and merchants through customer service, direct-to-customer channels, and social media. We regularly meet with our key suppliers to ensure they understand current business strategies and measures of success to meet regulatory and company requirements. Our Lead Independent Director who also serves as our Compensation and Benefits Committee Chair is available for engagement with shareholders, including participating in joint corporate governance and investor relations meetings. We deliver feedback to our Board regarding shareholder meetings. To address global ESG issues that affect us and our industry, we engage with our partners and peers through industry groups, roundtables, conferences, and other forums. For example, in 2021, we engaged in forums with the Data & Trust Alliance, the Centre for Information Policy Leadership, the Future of Privacy Forum, the Bank Policy Institute, and the Business Roundtable. We regularly engage our key stakeholders to better understand the ESG issues that matter most to them and our business. Their feedback informed our priority issues assessment and ESG strategy framework. Our engagement with the following eight stakeholder groups helps us to understand and meet their expectations and advance our efforts to operate responsibly. Stakeholder Group How We Engage Shareholders We provide the investment community with information on our strategy, objectives, and performance on the American Express Investor Relations website. Following our 2021 Annual Meeting of Shareholders, we met with shareholders representing approximately 45% of our outstanding shares and other constituents to discuss executive compensation, corporate governance, ESG, and related matters. To foster direct communication between shareholders and our Board, our Lead Independent Director is available for engagement with shareholders. Colleagues We keep colleagues updated on company news, priorities, performance, and business strategies through a variety of channels. Our leaders collect ongoing colleague feedback through our annual Colleague Experience Survey, open Q&A sessions, Colleague Networks, and our Amex Ethics Hotline. Customers: Card Members, Businesses, and Merchants We have direct relationships with millions of Card Members, businesses, and merchants around the world, whom we engage through customer service, direct-to-customer channels, and social media. Government and Regulators We are subject to extensive government regulation and supervision in jurisdictions around the world. We advocate for public policy issues that are significant to our business and our ability to serve our customers by providing education and context to government decision-makers. Suppliers We regularly meet with our key suppliers to ensure they understand current business strategies and measures of success to meet regulatory and company requirements. Community and Nonprofit Organizations We mobilize thousands of colleagues as volunteers through our Serve2Gether and Green2Gether program and offer incentives to support eligible charities through Give2Gether, our gift-matching program. We also directly support and collaborate with nonprofits, including through the American Express Foundation, and help develop the nonprofit and social purpose leaders of tomorrow through the longstanding American Express Leadership Academy. ESG Research and Rating Agencies We respond to CDP (formerly the Carbon Disclosure Project) and other ESG surveys and questionnaires from rating agencies and indexes including EcoVadis, FTSE4Good, Sustainalytics, MSCI, and others. Partners and Peers We engage with our partners and peers through industry groups, roundtables, conferences, and other forums to address local and global ESG issues that affect us. INTRODUCTION PROMOTING DE&I ADVANCING CLIMATE SOLUTIONS BUILDING FINANCIAL CONFIDENCE OUR ESG GOVERNANCE & OPERATING RESPONSIBLY SUPPORTING DATA OUR COMMITMENT TO ESG 91
ESG partnerships We create long-term relationships with organizations that share our interests and collaborate to achieve common goals. Key advocacy partners and memberships are shown below. 1 Corporate Sustainability and Community Giving Public Policy and Advocacy Social and Human Capital • Better Business Bureau of Metropolitan New York • Business for Social Responsibility • Chief Executives for Corporate Purpose • Emerging Practitioners in Philanthropy • Hispanic Association on Corporate Responsibility • Philanthropy New York • Regional Plan Association • The Business Council of New York State • The Conference Board • U.S. Chamber of Commerce Foundation • World Economic Forum • American Bankers Association • Association of Mexican Banks • Australian Finance & Industry Association • Bank Policy Institute • Canadian Bankers Association • Consumer Bankers Association • European Payment Institutions Federation • Indian Banks Association • Japan Credit Card Association • Partnership for New York City, Inc. • Securities Industry & Financial Markets Association • Spanish Association of Payment Institutions • The Business Roundtable • US Chamber of Commerce • UK Finance • Western Bankers Association • AfroTech • Association of Latino Professionals for America • Black Enterprise • Blue Circle Leadership • Break Through Tech (US) • Catalyst • Counsel of Urban Professionals • Cornell Center for Advanced Human Resource Studies (CAHRS) • Disability: IN • Executive Leadership Council • Grace Hopper • Hispanic Alliance for Career Enhancement • Hispanic Scholarship Fund • Jopwell • Intrapreneurs Club • Management Leadership for Tomorrow • McKinsey Black Leadership Academy • Multiverse • National Association of Black Accountants, Inc. • National Black MBA Association • National Society of Black Engineers • Reaching Out MBA • Society of Hispanic Professional Engineers • Thurgood Marshall College Fund • TechGig Goddess (India) • UK Everywoman • United Negro College Fund 1. This list is illustrative, and not intended to be comprehensive of our advocacy partners and memberships in 2021. INTRODUCTION PROMOTING DE&I ADVANCING CLIMATE SOLUTIONS BUILDING FINANCIAL CONFIDENCE OUR ESG GOVERNANCE & OPERATING RESPONSIBLY SUPPORTING DATA OUR COMMITMENT TO ESG 92
Job Categories Gender American Indian or Alaska Native Asian Black or African American Hispanic or Latinx Native Hawaiian or Pacific Islander Two or More Races White Total Count Executive/Senior Level Officials and Managers Male 0.0% 9.8% 5.3% 4.5% 0.0% 0.8% 40.2% 60.6% Female 0.0% 5.3% 3.8% 0.8% 0.0% 0.0% 29.5% 39.4% Subtotal 0.0% 15.2% 9.1% 5.3% 0.0% 0.8% 69.7% 100.0% First/Mid Level Officials and Managers Male 0.1% 11.5% 3.3% 4.8% 0.1% 0.8% 25.1% 45.6% Female 0.1% 10.7% 4.8% 5.9% 0.1% 1.1% 31.6% 54.4% Subtotal 0.2% 22.2% 8.2% 10.7% 0.2% 1.8% 56.7% 100.0% Professionals Male 0.2% 19.3% 3.6% 7.2% 0.0% 1.4% 25.1% 56.7% Female 0.2% 10.5% 4.1% 5.8% 0.1% 1.3% 21.4% 43.3% Subtotal 0.3% 29.8% 7. 6 % 13.0% 0.2% 2.6% 46.5% 100.0% All Others 2 Male 0.0% 1.1% 5.7% 7.3% 0.1% 1.0% 13.6% 28.8% Female 0.4% 2.5% 21.8% 12.2% 0.3% 2.8% 31.2% 71.2% Subtotal 0.4% 3.6% 27.5% 19.5% 0.4% 3.8% 44.8% 100.0% Total Male 0.1% 11.1% 4.1% 6.3% 0.1% 1.0% 22.0% 44.7% Female 0.2% 8.3% 9.3% 7. 6 % 0.2% 1.6% 28.1% 55.3% Total 0.3% 19.5% 13.3% 13.8% 0.2% 2.6% 50.2% 100.0% PROMOTING DIVERSITY, EQUITY, AND INCLUSION 2021 US Workforce Diversity 1 1. As of year-end 2021; based on the US EEO-1 job categories. Some percentages do not sum due to rounding. 2. All Others includes Technicians, Sales Workers, Administrative Support, Craft Workers, Operatives, Laborers and Helpers, and Service Workers categories. Job nomenclature at American Express does not align completely with the EEO-1 form. INTRODUCTION PROMOTING DE&I ADVANCING CLIMATE SOLUTIONS BUILDING FINANCIAL CONFIDENCE OUR ESG GOVERNANCE & OPERATING RESPONSIBLY SUPPORTING DATA OUR COMMITMENT TO ESG 93
Job Categories Gender American Indian or Alaska Native Asian Black or African American Hispanic or Latinx Native Hawaiian or Pacific Islander Two or More Races White Total Count Executive/Senior Level Officials and Managers Male 0 13 7 6 0 1 53 80 Female 0 7 5 1 0 0 39 52 Subtotal 0 20 12 7 0 1 92 132 First/Mid Level Officials and Managers Male 9 980 284 406 9 65 2,140 3,893 Female 11 915 413 503 8 91 2,695 4,636 Subtotal 20 1,895 697 909 17 156 4,835 8,529 Professionals Male 12 1,367 253 512 2 96 1,782 4,024 Female 11 74 3 289 410 9 89 1,517 3,068 Subtotal 23 2,110 542 922 11 185 3,299 7, 0 9 2 Technicians Male 1 5 21 45 0 0 41 113 Female 0 1 10 13 0 0 8 32 Subtotal 1 6 31 58 0 0 49 145 Sales Workers Male 1 23 38 55 0 10 321 448 Female 2 24 61 63 0 14 348 512 Subtotal 3 47 99 118 0 24 669 960 Administrative Support Male 1 36 285 338 6 51 450 1,167 Female 20 125 1,241 661 18 156 1,519 3,74 0 Subtotal 21 161 1,526 999 24 207 1,969 4,907 Craft Workers Male 0 0 0 0 0 0 8 8 Female 0 0 0 0 0 0 3 3 Subtotal 0 0 0 0 0 0 11 11 Operatives Male — — — — — — — — Female — — — — — — — — Subtotal — — — — — — — — Laborers and Helpers Male — — — — — — — — Female — — — — — — — — Subtotal — — — — — — — — Service Workers Male — — — — — — — — Female — — — — — — — — Subtotal — — — — — — — — Total Male 24 2,424 888 1,362 17 223 4,795 9,733 Female 44 1,815 2,019 1,651 35 350 6,129 12,043 Total 68 4,239 2,907 3,013 52 573 10,924 21,776 1. Based on data for the 2021 EEO-1 filed with the US Equal Employment Opportunity Commission. Where there are no employees in an EEO-1 job category during the reporting period, a dash (—) is indicated. 2021 EEO-1 Data 1 The summary table below covers our US workforce Employer Information Report (EEO-1) data as of December 31, 2021. INTRODUCTION PROMOTING DE&I ADVANCING CLIMATE SOLUTIONS BUILDING FINANCIAL CONFIDENCE OUR ESG GOVERNANCE & OPERATING RESPONSIBLY SUPPORTING DATA OUR COMMITMENT TO ESG 94
2021 Global Gender Diversity 1 US Non-US Global Summary Job Categories Female Male Female Male Undeclared 2 Female Male Undeclared 2 Executive/Senior Level Officials and Managers 39.4% 60.6% 37.9% 62.1% 0.0% 39.1% 60.9% 0.0% First/Mid Level Officials & Managers 54.4% 45.6% 4 7. 6 % 52.3% 0.1% 51.1% 48.9% 0.0% Professionals 43.3% 56.7% 48.5% 51.4% 0.1% 46.6% 53.4% 0.0% All Others 3 71.2% 28.8% 54.8% 45.1% 0.1% 58.4% 41.6% 0.0% Total 55.3% 44.7% 51.6% 48.3% 0.1% 52.9% 4 7. 1 % 0.0% 1. As of year-end 2021; based on the US EEO-1 job categories. Some percentages do not sum due to rounding. 2. Undeclared is a legally offered option in certain non-US jurisdictions; in the US, gender is required for EEO-1 reporting. 3. All Others includes Technicians, Sales Workers, Administrative Support, Craft Workers, Operatives, Laborers and Helpers, and Service Workers categories. Job nomenclature at American Express does not align completely with the EEO-1 form. INTRODUCTION PROMOTING DE&I ADVANCING CLIMATE SOLUTIONS BUILDING FINANCIAL CONFIDENCE OUR ESG GOVERNANCE & OPERATING RESPONSIBLY SUPPORTING DATA OUR COMMITMENT TO ESG 95
ADVANCING CLIMATE SOLUTIONS Environmental Performance Data Summary Unit 1 2021 2020 2019 Energy 2 Global Direct Energy Natural Gas MWh 6,258 8,941 16,881 Fuel Oil MWh 542 853 2,021 Mobile Fuel MWh 4 7, 7 0 5 60,774 75,055 Global Indirect Energy Purchased Electricity MWh 202,170 224,051 257,569 Purchased Steam & Chilled Water MWh 13,233 1 7, 5 7 9 25,462 Renewable Energy 2 Onsite Generated Renewable Electricity 3 MWh 561 593 507 Total Global Renewable Electricity % 100% 100% 100% Total Energy 2 Total Global Direct Energy Consumption MWh 54,504 70,568 93,957 Total Global Indirect Energy Consumption MWh 215,394 241,630 283,031 Total Global Energy Consumption (Direct + Indirect) MWh 269,898 312,198 376,988 1. MWh: megawatt hours 2. Energy usage is based on a combination of metered energy consumption billing data and estimated energy consumption data based on energy intensity per square footage standards outlined in the GHG Protocol where metered data is not currently available. 3. Onsite generated renewable electricity includes onsite solar renewable electricity generation at our North Carolina Data Center (546 MWh, 577 MWh, and 489 MWh) and Brighton UK office (15 MWh, 16 MWh, and 18 MWh) in 2021, 2020, and 2019, respectively. INTRODUCTION PROMOTING DE&I ADVANCING CLIMATE SOLUTIONS BUILDING FINANCIAL CONFIDENCE OUR ESG GOVERNANCE & OPERATING RESPONSIBLY SUPPORTING DATA OUR COMMITMENT TO ESG 96
Unit 1 2021 2020 2019 Greenhouse Gas Emissions Scope 1–Direct MTCO 2 e 17,944 19,620 24,363 Scope 2–Indirect (Location-Based) MTCO 2 e 80,275 90,024 113,964 Scope 2–Indirect (Market-Based) 2 MTCO 2 e 3,976 2,464 3,153 Scope 3 Category 5: Waste Generated in Operations 3 MTCO 2 e 280 420 1,719 Category 6: Business Travel 4 MTCO 2 e 570 5,513 51,679 Total Greenhouse Gas Emissions Total Scope 1 & 2 (Location-Based) Emissions MTCO 2 e 98,219 109,643 138,327 Total Scope 1 & 2 (Market-Based) Emissions MTCO 2 e 21,920 22,084 27,516 Total Scope 3 (Category 5, 6) Emissions MTCO 2 e 850 5,933 53,398 Total Scope 1, 2 (Market-Based), 3 (Category 5, 6) Emissions MTCO 2 e 22,770 28,017 80,914 Verified Carbon Offsets MTCO 2 e 22,770 28,017 80,914 Total Scope 1, 2 (Market-Based), 3 (Category 5, 6) with Verified Carbon Offsets MTCO 2 e 0 0 0 Total Scope 1, 2 (Market-Based), 3 (Category 5, 6) Emissions Intensity kgCO 2 e/ft 2 2.7 3.1 9.3 Total Scope 1, 2 (Market-Based), 3 (Category 5, 6) Emissions Intensity Per Colleague MTCO 2 e/FTE 0.4 0.4 1.3 Total Scope 1, 2 (Market-Based), 3 (Category 5, 6) Emissions Intensity Per Annual Revenue MTCO 2 e/$M USD 0.5 0.8 1.9 Environmental Performance Data Summary (cont'd) 1. MTCO 2 e: Metric tons of carbon dioxide equivalent; kgCO 2 e: kilograms of carbon dioxide equivalent; ft 2 : square feet; FTE: Full-time Equivalent; $M USD: millions of dollars 2. 202,175 MWh, 224,051 MWh, and 257,569 MWh of renewable energy attributes were applied to the 2021, 2020, 2019 Scope 2 market-based emissions, respectively. 3. Scope 3 Category 5 Waste Generated in Operations represents emissions associated with landfilled, recycled, and other disposed waste, which includes incineration across our managed facilities. The waste data is reported only for managed facilities where measured data is available. This represents approximately 67% (4,791,834 ft 2 ), approximately 62% (4,679,278 ft 2 ), and approximately 67% (4,457,816ft 2 ) of the globally managed facility footprint in 2021, 2020 and 2019, respectively. 4. Scope 3 Category 6 Business Travel includes employee business travel including third-party air, rail, and rental cars. INTRODUCTION PROMOTING DE&I ADVANCING CLIMATE SOLUTIONS BUILDING FINANCIAL CONFIDENCE OUR ESG GOVERNANCE & OPERATING RESPONSIBLY SUPPORTING DATA OUR COMMITMENT TO ESG 97
Unit 1 2021 2020 2019 Water 2 Water Consumption m 3 166,171 263,686 591,220 Waste 2 Waste Generated Metric Tons 806 1,019 3,472 Waste Landfilled Metric Tons 374.4 543 2,384 Waste Recycled Metric Tons 433 526 1,309 Waste Diversion Rate % 54% 52% 38% Cards Recycled via US Card Take Back Program 3 Number 727,294 565,768 11,708 Green Building Certifications 4 Green Building Certified Square Footage ft 2 4,693,820 4,779,837 4,364,026 Green Building Certified % % 56% 55% 50% Environmental Performance Data Summary (cont'd) 1. m 3 : cubic meters; ft 2 : square feet 2. Water consumption, waste generation, and recycling data are reported only for managed facilities where measured data is available. Water usage for 2021 represents approximately 75% (5,343,193 ft 2 ) and waste and recycling data for 2021 represents approximately 67% (4,781,326 ft 2 ) of the globally managed facility footprint in 2021. 3. US Card Members can return expired or non-working cards for recycling. This encompasses cards sent back to us by other means, such as non-delivered mail. In 2019, the Card Take Back program began in November. 4. Green building certified square footage represents the year-end square footage certified out of total year-end building square footage. This includes leased or owned facilities actively occupied by American Express (excluding parking lot square footage) that have achieved certification under a global or locally recognized third-party rating system criteria including LEED, BREEAM, NABERS, GreenMark, HQE, and Effinergie+ INTRODUCTION PROMOTING DE&I ADVANCING CLIMATE SOLUTIONS BUILDING FINANCIAL CONFIDENCE OUR ESG GOVERNANCE & OPERATING RESPONSIBLY SUPPORTING DATA OUR COMMITMENT TO ESG 98
Environmental Performance Data Summary (cont'd) Unit 1 2021 2020 2019 Paper Use Direct marketing, customer communications, and office paper from certified responsibly managed forests % 96.3% 95.0% 87.5% FSC Certified % 88.2% 86.4% 71.7% SFI Certified % 7. 6 % 8.2% 14.4% PEFC Certified % 0.5% 0.3% 1.4% Environmental Ratings CDP Climate Change Questionnaire Score A- A- A Environmental Violations Environmental Violations Number 0 0 0 Company Metrics Employee Headcount FTE 64,000 63,700 64,500 Annual Revenue $M USD $42,380 $36,087 $43,556 Total Average Building Square Footage 2 ft 2 8,459,570 9,180,484 8,676,452 Total Year-End Building Square Footage 2 ft 2 8,424,281 8,641,116 8,726,722 1. FTE: Full-time Equivalent; $M USD: millions of dollars; ft 2 : square feet 2. Total average and year-end building square footage includes all leased and owned facilities actively occupied by American Express (excluding parking lot square footage), which covers managed facilities, field sites, and data centers. Managed facilities are individual properties operationally managed by our global real estate team and housing critical business functions. Field sites are individual properties that are not operationally managed by our global real estate team but directly by our business units. These are typically smaller sites, less than 30,000 square feet (including airport lounges, foreign exchange kiosks, and sales offices) that are owned or leased by American Express. INTRODUCTION PROMOTING DE&I ADVANCING CLIMATE SOLUTIONS BUILDING FINANCIAL CONFIDENCE OUR ESG GOVERNANCE & OPERATING RESPONSIBLY SUPPORTING DATA OUR COMMITMENT TO ESG 99
Limited Assurance Statement of GHG Emissions WATER RESOU RCES • ENVIRONMENT AL SERVICES • HEALTH & SAFETY • COMPLIANCE & ASSURANCE Apex Companies, LLC ▪ www. apexcos.com VERIFICATION OPINION DECLARATION GREENHOUSE GAS EMISSIONS To: The Stakeholders of American Express Apex Companies, LLC (Apex) was engaged to conduct an independent verification of the energy consumption and greenhouse gas (GHG) emissions reported by Amer ican Express for the period stated below. This ve rification opinion declaration applies to the related information included within the scope of work described below. The determination of the GHG emissions is the sole responsibility of American Express . American Express is respon sible for the prep aration and f air presentati on of the GHG emissions statement in accord ance with the criteria . Apex’ s sole responsibility was to provide independent verification on the accuracy of the GHG e missions reported, and on the underlying sys tems and processes used t o coll ect, anal yze , and re view the i nfo rmation. Apex is responsible for expressing an opinion on the GHG emissions statement based on the verification. Verification activi ties applied in a limited level of assurance verification are less extensive in nature , tim ing , and ex tent than in a reasonable level of assurance verification. Boundaries of the reporting company GHG emissions covered by the verification: • Operational Control • Worldwide • Exclusions: No ne Types of GHGs : CO 2 , N 2 O, CH 4 , HF Cs Energy Type and Consumption: • Total Energy : 269,898 megawatt hours (MW h) • Total Purchased Elect ric ity: 202,170 MW h • Total Purc hased Renewable E lectr icity Certificates Applied to 2021 Purchased Electricity : 202,170 MW h Data and in formati on supporting the reported energy consumption were in som e case s estima ted rather than histori cal in nature. GHG Emissions Statement : Americ an Express Entity -Wi de GHG Emission s for 2021 Scope 1 Emissions Metric Tonnes (mt) of CO 2 equivalent (CO 2e ) 17, 944 Scope 2 Emissions – Location Based mt CO 2e 80,275 Scope 2 Em issions – Market Based mt CO 2e (purchas ed steam and chilled water emissio ns) 3,976 Total Scope 1 + Scope 2 Ma rket Based mt CO 2e 21,920 American Express Page 3 June 16 , 2022 GHG Verifica tion Methodol ogy: Evid ence gathering proce dures included but were not limited to: • Interviews with relevant personnel of American Expre ss and their consultant ; • Review of document ary evidence produced by American Express ; • Review of American Express data and information systems and methodology for collection, aggregation, analysis an d review of information used t o determine GHG emissions ; • Audit of sample s of data used by Am erican Express to determine GHG emissions. Verification Opinion: Based on the process and procedu res conducted , there is no ev idence that the GH G emissions statement shown above: • is not materi ally correct and is not a fair r epresentation o f the GHG emissions data and information; and • has not been prepared in accordance with the WRI/WBCSD GHG Protocol Co rporate Accounting and Reporting Standard (Scope 1 and 2 ), and WRI/WBCSD Gr eenhouse Gas Protocol Corporate Value Chain Ac coun ting and Report ing Standard ( Scope 3). It is our opinion that American Express has established appropriate systems for the collect ion, aggregation , and analy sis of quantita tive data for determination of the se GHG emissions f or the stated period and boundar ies. Statement of independence, im partiality , and competence Apex is an independent professional services company that speciali ze s in Hea lth, Safety, Social and Environment al management services including assurance with over 30 years history in provid ing t hese services. No member of the verification team has a business relationship with American Express , its Directors or Managers beyond that required of this assignment. We conducted this verification indep endently and to our knowledge there has been n o conflict of intere st. Apex has implemented a Code of Ethics acros s the business to maintain high ethical standards among staff in t heir day-to -day business acti vities. The ve rification team has extensive expe rience in conducting assurance over environmen tal, social, ethical and health and safety information, systems and processes, has over 20 years combined experience in this field an d an exce llent understanding of Apex’s stan dard methodology for the verificat ion of greenhouse gas emissions data. Attes tat ion: David Reilly, Lead Verifier Trevor Donaghu , Tech nical Reviewer Principal Consultant Program Manager Apex Companies, LLC Apex Companies, LLC Santa Ana, California Pleasant Hill, California June 1 6, 2022 This verification opinion declaration, including t he opinion expressed herein, is provided to American Express and is solely for the benefit of American Expr ess in accordanc e with the terms of our agreem ent. We consent to the release of this statement by you t o the CDP in order to satis fy th e terms of CDP disclosure requirem ents but without acc epting or assuming any responsibility or liability on our part to C DP or t o any other party who may hav e access t o this statement. American Express Page 2 June 16 , 2022 Scope 3 Emissions Ca tegory 5 Waste Gen erated i n Operations mt CO 2e 280 Ca te gory 6 Business Trav el mt CO 2e 570 Total Scope 1 + Scope 2 Market Based + above Scope 3 Categories mt CO 2e 22,770 Purchased GHG Emissio n Offsets mt CO 2e applied to 2021 inventory 22,770 Net Offset Emissions mt CO 2e CY 2021 (Scope 1 + Scope 2 Mar ket Based + Catego ry 5 Waste Generated in Operations, Categor y 6 Business Travel Em issions ) - Purchased GHG Emission Offsets 0 Data and information supporting the Scope 1 and Scope 2 GHG emissions statement were in some cases estimated rath er than histori cal in natu re. Data and information supporting the Scope 3 GH G e mis sions statement were in many cases estimated rath er than histori cal in natu re. Period covered by GHG emissi ons and energy verif ica tion : • January 1 , 2021 to December 31, 202 1 Criteria against which verification was c onducted: • World Resources Inst itute (WRI )/World Business Cou ncil for Sustainable Development (WBCSD) Greenhouse Ga s (GHG) Protocol , Corporate Account ing and Reporting Standard, Revised Edition (Scope 1 and 2) and the GHG P rotocol Scope 2 Guidance, an amendment to the GHG Protocol Corpo rate Standard. • WRI/WBCSD Gree nhouse Gas Protocol Corporate Value Chain (Scope 3 ) Acc ounting and Reporting Standard. Refer enc e Standard: • ISO 14064- 3: Second edition 2019- 04: Greenhouse gases -- Part 3: Specification with Guidance for the Verification and Validation of Greenhouse Gas Statements Level of Assurance and Qual ifications : • Lim ited • This verificati on used a materialit y t hreshold of 5% for aggregate errors in sampled data for each of the above indicat ors • Qualifications: None INTRODUCTION PROMOTING DE&I ADVANCING CLIMATE SOLUTIONS BUILDING FINANCIAL CONFIDENCE OUR ESG GOVERNANCE & OPERATING RESPONSIBLY SUPPORTING DATA OUR COMMITMENT TO ESG 100
OUR ESG GOVERNANCE AND OPERATING RESPONSIBLY Key Policies Anti-Bribery and Corruption We have a zero-tolerance policy for bribery. All colleagues must complete anti-corruption and bribery training tied to their annual compensation that includes information on applicable laws and regulations for their location. Anti-Money Laundering Our global policy details our approach to preventing money laundering and related financial crimes. Colleagues receive regular training to review our policies and requirements, relevant laws, and their role in recognizing and reporting unusual behavior. Code of Conduct Our Code of Conduct is our manual for informing colleagues of the workplace behaviors we expect. It covers ethical business practices ranging from anti-corruption to technology use, conflicts of interest, conducting business with foreign governments, and protecting customer privacy (see pages 67-68, 82-84). Equal Employment Opportunity (EEO) We are committed to equal employment opportunities for all individuals. We make hiring decisions based on job-related qualifications and ability to perform the job without regard to race, color, religion, sex, national origin, age, sexual orientation, gender identity, disability, genetic information, citizenship, marital status, or any other basis prohibited by law. Our policies prohibit harassment of colleagues and contractors by co-workers, supervisors, or outsiders and such behavior may trigger disciplinary action, including loss of employment or contract. We also enforce a Global Sexual Harassment Policy Statement. Human Rights We promote human rights and are committed to responsible workplace practices and protecting the human rights of people working throughout our supply chain. Our Human Rights Statement and Code of Conduct express our commitment to fair and equal treatment of all people. We guard against incidents of modern slavery and human trafficking within our business and supply chain by conducting employment checks and by working with suppliers that meet high standards of conduct (see page 86). See also our UK Modern Slavery Act Transparency Statement and Australia Modern Slavery Statement . Public Policy Engagement and Political Contributions We believe active engagement in the public policy arena is vital to the democratic process and an important part of responsible corporate citizenship. We are transparent about our policy engagement with governments, including through Lobbying Disclosure Act filings. We provide our perspective to officials at various government levels worldwide and collaborate with trade and industry associations. For more information, including lobbying requirements and our semiannual reporting of US political contributions, see our Political Contributions Report . Responsible Marketing Our marketing programs go through multiple layers of review across business units so that our customers may be well-informed, in a responsible manner, about our products and services (see pages 68-69). Taxation We carefully consider our taxation positions so that they are consistent with our overall tax strategy, broader corporate governance requirements, applicable laws, and corporate values. We engage with tax authorities globally with openness and integrity to support compliance with our tax obligations. We are a current taxpayer both within and outside of the United States. For more information on taxation, see our 2021 Annual Report . Whistleblower Claims Policy Our Whistleblower Claims Policy allows colleagues, contractors, customers, merchants, and others to report allegations in good faith without fear of retaliation or risk to their employment. Claims are investigated and recommendations are made by the Colleague Experience Group, Internal Audit Group, and Global Security, in consultation with our General Counsel’s Organization, as appropriate. INTRODUCTION PROMOTING DE&I ADVANCING CLIMATE SOLUTIONS BUILDING FINANCIAL CONFIDENCE OUR ESG GOVERNANCE & OPERATING RESPONSIBLY SUPPORTING DATA OUR COMMITMENT TO ESG 101
Transparency and alignment with external reporting frameworks We use industry-leading standards and frameworks to inform our ESG activities and measure our progress. We align our disclosures with the Global Reporting Initiative (GRI) , which includes environmental, economic, and social disclosures, as well as supplemental disclosures for the financial services sector. It also includes general disclosures in areas such as our supply chain, governance, ethics, and more. In addition, we use the standards of the Sustainability Accounting Standards Board (SASB) to guide the disclosure of sustainability information of interest to investors, including topics such as data privacy, data security, business ethics, and more. Further, we report annually in alignment with the recommendations of the Task Force on Climate-Related Financial Disclosures (TCFD), including our approach to climate-related governance, strategy, risk management, and metrics and targets. We also disclose outcomes from qualitative climate risk scenario analyses to assess physical and transition risks to our business related to climate change. You will find our TCFD , SASB , and GRI indexes on the following pages of this report. INTRODUCTION PROMOTING DE&I ADVANCING CLIMATE SOLUTIONS BUILDING FINANCIAL CONFIDENCE OUR ESG GOVERNANCE & OPERATING RESPONSIBLY SUPPORTING DATA OUR COMMITMENT TO ESG 102
2021–2022 TCFD INDEX American Express Task Force on Climate-related Financial Disclosures (TCFD) Index The Financial Stability Board (FSB), comprised of members of the G20, established the TCFD to develop recommendations for more effective climate-related disclosures. As part of our commitment to climate action, American Express reports annually in line with the TCFD recommendations. The table below summarizes our approach to climate-related governance, strategy, risk management, and metrics and targets. It also discloses the outcomes from the qualitative climate risk scenario analyses we performed in 2020 and 2021 to assess physical and transition risks to our business related to climate change. In 2021, we became a formal TCFD Supporter, joining over 3,000 organizations taking action to build a more resilient financial system through transparent climate-related disclosure. For more information, refer to the Advancing Climate Solutions and Our ESG Governance and Operating Responsibly sections of the 2021-2022 ESG Report, 2021 Annual Report , 2022 Proxy , and 2021 CDP Climate Change Response . TCFD Recommendation Disclosure 1. Governance 1a. Describe the board’s oversight of climate- related risks and opportunities Risk management is overseen by the American Express Board of Directors through three Board Committees: The Risk Committee, the Audit and Compliance Committee, and the Compensation and Benefits Committee. The committees meet regularly with the company’s Chief Risk Officer, the Chief Compliance & Ethics Officer, the Chief Audit Executive, the Chief Operational Risk Officer, and other senior management with regard to our risk management processes, controls, talent, and capabilities. The Board monitors the “tone at the top,” our risk culture, and oversees emerging and strategic risks. The Risk Committee provides oversight of the company’s Enterprise Risk Management (ERM) framework, processes, and methodologies, and approves the company’s ERM policy, which governs risk governance, risk oversight, and risk appetite. ESG and climate-related risks are currently identified as an “emerging risk” within our ERM framework. In addition, the Board’s Nominating, Governance, and Public Responsibility Committee (NGPRC) reviews the company’s ESG strategy and Corporate Sustainability program, monitors progress against ESG goals, and provides guidance on our efforts. The Chief Corporate Affairs Officer (CCAO), who sits on our Executive Committee, and the Vice President of Corporate Sustainability updates the NGPRC on ESG-related issues, progress, and performance at least twice annually. INTRODUCTION PROMOTING DE&I ADVANCING CLIMATE SOLUTIONS BUILDING FINANCIAL CONFIDENCE OUR ESG GOVERNANCE & OPERATING RESPONSIBLY SUPPORTING DATA OUR COMMITMENT TO ESG 103
TCFD Recommendation Disclosure 1b. Describe management’s role in assessing and managing climate- related risks and opportunities The company’s Executive Committee reviews and evaluates ESG performance and long-term goals. Our CCAO is on the Executive Committee and reports directly to the Chairman and Chief Executive Officer (CEO). The CCAO oversees the Corporate Affairs & Communications (CA&C) Department and has direct responsibility for leading ESG and Corporate Sustainability initiatives, supported by the Corporate Sustainability and ESG Team. The Enterprise Risk Management Committee (ERMC), chaired by our Chief Risk Officer, is the highest-level management committee to oversee all firm-wide risks and is responsible for risk governance, risk oversight, and risk appetite, including the management of ESG and climate risks. Furthermore, a dedicated group associated with climate risk, with direct accountability to the ERMC, has been established. The ESG Steering Committee, chaired by our CCAO, guides our ESG strategy and related policies and programs. The cross-functional team includes senior executives from across the organization including CA&C, Finance, Controllership, General Counsel’s Organization, Government Affairs, American Express National Bank (AENB), Global Real Estate and Workplace Experience, Investor Relations, Global Risk and Compliance, and others that meet at least quarterly to discuss ESG topics, strategies, and initiatives to advance our ESG goals. The ESG Steering Committee is supported by ESG Working Groups and focuses on our three ESG pillars, including Advance Climate Solutions, which develops strategies to achieve our climate goals. An additional working group focuses on ESG disclosures. The Corporate Sustainability and ESG team, led by the VP of Corporate Sustainability, within CA&C is responsible for coordination of climate-related issues across the company. The team works closely with business units to monitor climate-related issues and opportunities, carbon reduction efforts, energy efficiency initiatives, low-carbon product innovations, colleague engagement, and other initiatives in alignment with our ESG Strategy. Executive compensation is also increasingly linked to our ESG goals. For example, in prior years, the Company’s annual scorecard’s Colleague category included diversity representation, talent retention, culture, and inclusion metrics as part of the calculation to determine incentive compensation for all eligible colleagues, and in 2021, we also incorporated the management of key ESG priorities, including metrics, into our executive compensation program under the Strategic category of our annual scorecard. 2. Strategy 2a. Describe the climate- related risks and opportunities the organization has identified over the short-, medium-, and long-term American Express takes a strategic approach to managing the impacts of climate change, considering the risks and opportunities across the short-term (0–3 years), medium-term (3–6 years), and long-term (6–10+ years). In 2020 and 2021, we conducted qualitative analyses of current and potential climate-related physical and transition risks and opportunities to our operations, supply chain, and business activities. Physical Risks: The qualitative climate-related physical risk assessment performed in 2020 evaluated potential acute and chronic risks and opportunities associated with the physical impacts of climate change on key operations across several time horizons including historic conditions (1990–2018) and medium-term (2035) and long-term (2060) projections. The potential physical risks include flooding due to sea level rise and extreme precipitation, cyclonic storm threats, drought, and extreme temperatures across the some of our critical sites. These threats could affect operations at our global headquarters, data centers, call centers, offices, and third-party supplier card manufacturing sites. Transition Risks: The qualitative climate-related transition risk assessment evaluated three scenarios from the International Energy Agency (IEA) to analyze the impact of transition risks on our company’s potential future revenues and costs between 2025 and 2040. We assessed transition risks and opportunities associated with current and emerging regulations, technology advances to transition to a low-carbon future, and public demand and reputational risks. We identified potential short-, medium-, and long-term risks including current regulations and carbon pricing; emerging regulations related to enhanced emissions reporting requirements; shifting consumer preferences; reputational risks; increased operating costs; impacts to travel patterns; and geographic or location-based risks. We identified climate-related opportunities in the short, medium, and long term that may have financial or strategic impacts on our business. Opportunities include maintaining carbon neutrality, continuing to invest in energy efficiency projects, onsite renewable electricity generation, renewable Energy Attribute Certificates (EACs), and carbon offsets. Across our value chain, climate-related opportunities exist through innovation and investments in research and development for low-carbon products and services. In addition, we have a goal to pilot low-carbon innovations by the end of 2022, including carbon tracking and offset solutions for customers. INTRODUCTION PROMOTING DE&I ADVANCING CLIMATE SOLUTIONS BUILDING FINANCIAL CONFIDENCE OUR ESG GOVERNANCE & OPERATING RESPONSIBLY SUPPORTING DATA OUR COMMITMENT TO ESG 104
TCFD Recommendation Disclosure 2b. Describe the impact of climate-related risks and opportunities on the organization’s businesses, strategy, and financial planning Climate-related risks and opportunities inform our business, strategy, and financial planning across our direct operations, products and services, funding, and supply chain. The Advance Climate Solutions pillar of our ESG Strategy includes goals to enhance the management of climate-related risks and opportunities across our business, commit to net-zero emissions by 2035 in alignment with the Science Based Targets initiative, and pilot low-carbon product innovations by the end of 2022. Our strategy has been influenced by climate-related physical and transition risks over the short-, medium-, and long-term, including those associated with emerging regulations and acute and chronic physical risks. Operations: Climate-related opportunities across our operations include reducing operating costs and environmental impacts at our global facilities by improving energy, water, and resource efficiency, and leveraging climate policies and tax incentives to expand onsite renewable energy. We have been a carbon neutral company powered by 100% renewable electricity across our global operations since 2018 1 through onsite solar, renewable energy credits, carbon offsets, reduced greenhouse gas (GHG) emissions, and achieved green building certification across 56% of our operations. 2 These investments and initiatives are factored into our annual financial planning processes. Products & Services: To respond to changes in consumer preferences, we invest in research and development to develop and enhance our products and services. One of our Advance Climate Solutions objectives is to enable our customers and partners to transition to a low-carbon economy through the development of new capabilities, supported by a goal to pilot low-carbon product innovations, including carbon tracking and offset solutions, by the end of 2022. In 2019, we launched the first American Express Card made primarily from reclaimed plastic collected from oceans and coasts, which reduces GHG emissions and energy and water consumption during manufacturing compared to virgin plastic. We also introduced a Card Take Back Program, which enables US Card Members to send back expired or non-working cards to American Express for recycling. We have recycled more than 1.3 million cards since 2019, including cards returned by Card Members. In 2022, we set a goal for the vast majority of plastic cards issued by American Express to be made of at least 70% recycled or reclaimed plastic by the end of 2024, which can help avoid nearly 160,000 pounds of virgin plastic from being used annually. For our Corporate clients, our Carbon Footprint Dashboard is available to over 1,000 global corporate clients to help track estimated carbon emissions associated with their employees’ air travel. We are expanding this tool to include additional categories of spend—including ground transportation, hotel stays, restaurants, and retail—letting corporate clients better understand behaviors so they can find opportunities to manage carbon emissions. 3 In 2022, we launched a Carbon Offset Referral Suite that provides US corporate clients with a curated list of carbon offset providers who can help them manage their footprint via offset solutions that include investments in large-scale carbon removal and reduction projects and avoidance projects. Funding: In May 2022, American Express closed our first-ever ESG bond issuance. An amount equivalent to the net proceeds of the $1 billion ESG bond will be allocated toward projects in the Green and Social Categories, informed by the American Express Sustainable Financing Framework . Green projects include those related to green buildings, energy efficiency improvements and renewable energy, and the circular economy. Social projects include initiatives connected to socioeconomic advancement and empowerment, access to essential services, and affordable housing. 1. Achieved carbon neutral operations for Scope 1 (direct emissions from sources owned or controlled by American Express), Scope 2 (indirect market-based emissions), and Scope 3 (waste and employee business travel, including third-party air, rail, and rental cars) emissions through renewable energy credits, carbon offsets, and reduced GHG emissions. Operations include all our managed facilities, field sites, and data centers. Managed facilities are individual properties operationally managed by our global real estate team and housing critical business functions. Field sites are individual properties that are not operationally managed by our global real estate team but directly by our business units. They are typically smaller sites, less than 30,000 square feet (including airport lounges, foreign exchange kiosks, and sales offices) that are owned or leased by American Express. 2. Green building certified percentage is represented by the total year-end square footage certified out of total year-end building square footage. This includes leased or owned facilities actively occupied by American Express (excluding parking lot square footage) that have achieved certification under a global or locally recognized third-party environmental building certification system as meeting their performance criteria (LEED, BREEAM, NABERS, GreenMark, HQE, and Effinergie+). 3. American Express’ Carbon Footprint Tool calculations are derived by applying selected conversion factors to spending made with the following American Express Corporate products: Corporate Card, Business Travel Account, Corporate Meeting Card, Corporate Purchasing Card, Buyer Initiated Payments, vPayments and Amex Go. The estimated information provided by the Carbon Footprint Tool is for generalized informational purposes only and does not constitute financial, tax, accounting, legal or other professional advice on any subject matter. Product names and features may vary by country, and not all products or features are available in all countries. INTRODUCTION PROMOTING DE&I ADVANCING CLIMATE SOLUTIONS BUILDING FINANCIAL CONFIDENCE OUR ESG GOVERNANCE & OPERATING RESPONSIBLY SUPPORTING DATA OUR COMMITMENT TO ESG 105
TCFD Recommendation Disclosure 2c. Describe the resilience of the organization’s strategy, taking into consideration different climate- related scenarios, including a 2°C or lower scenario Our ESG governance framework, Advance Climate Solutions pillar of our ESG strategy, and qualitative climate risk scenario analyses demonstrate our progress to enhance climate risk management and opportunities across our business. We committed to net-zero by 2035 in alignment with the Science Based Targets initiative (SBTi) and selected this goal based on SBTi’s most ambitious level of climate action, to limit global warming to 1.5°C above pre-industrial levels. We leverage science-based frameworks including the Intergovernmental Panel on Climate Change (IPCC) and International Energy Agency (IEA), to inform our climate-related risk identification process across short-, medium-, and long-term horizons. We aim to minimize our climate impact and manage our climate-related risks and opportunities; enable our customers and partners to transition to a low-carbon economy through the development of new capabilities; and support community programs and initiatives to help build more climate resilient and equitable communities. For our qualitative climate-related physical risk assessment, we evaluated potential threats and mitigation opportunities to critical business sites across our global operations, supply chain, and revenue sources both under historic conditions and applied to future climate projections from the IPCC’s Representative Concentration Pathway (RCP) 8.5 scenario. Each site was examined for seven potential acute and chronic risks from the physical impacts of climate change: 1) increasing temperatures; 2) sea level rise; 3) precipitation changes; 4) flooding; 5) cyclonic events; 6) extended drought; and 7) extreme temperatures. For the qualitative climate-related transition risk assessment, we evaluated the impact of three future scenarios from the IEA compatible with a 1.5°C, 2-3°C, 6°C pathway on countries essential to our business operations against 2025- and 2040-time horizons. The assessment evaluated the impact of transition risks to our potential future revenues and costs associated with capital expenditures and capital allocation strategies over short- and long-term horizons. 3. Risk Management 3a. Describe the organization’s processes for identifying and assessing climate- related risks American Express management establishes risk management policies and procedures to identify, assess, measure, and manage key risks facing the company. ESG risks, including, but not limited to, climate change risk are currently identified as an “emerging risk” within our risk governance framework. We define climate-related risks as: 1. Transition Risks: Risks related to the transition to a low-carbon economy, which may include extensive changes pertaining to policy, legal, technology, market, and reputational risks 2. Physical Risks: Risks related to the physical impacts of climate change, typically driven by acute physical risk such as increased severity of extreme weather events (e.g., cyclones, hurricanes, floods) and chronic physical risks which are longer-term shifts in climate patterns (e.g., sea level rise, chronic heat waves) Climate-related risks are interconnected and overarching across all risk types as it may manifest as credit risk, operational risk, market risk, liquidity risk, and other risk types. To identify and assess climate-related risks, we conducted qualitative climate-related physical and transition risk and opportunity assessments to understand the current and potential impacts of climate change to our direct business operations, supply chain, and financial activities. We also consider current and emerging climate regulations, technology, legal, and reputational risks and qualitative factors such as disruptions to our operations, impacts on our colleagues, and damage to our brand. INTRODUCTION PROMOTING DE&I ADVANCING CLIMATE SOLUTIONS BUILDING FINANCIAL CONFIDENCE OUR ESG GOVERNANCE & OPERATING RESPONSIBLY SUPPORTING DATA OUR COMMITMENT TO ESG 106
TCFD Recommendation Disclosure 3b. Describe the organization’s processes for managing climate- related risks ESG and climate-related risks are managed as part of our comprehensive ERM program. Risk management is overseen by our Board of Directors through its Risk Committee, Audit and Compliance Committee, and Compensation and Benefits Committee, each of which provide regular reports to the full Board regarding matters reviewed by these committees. These committees meet regularly with our Chief Risk Officer, Chief Compliance & Ethics Officer, the Chief Audit Executive, Chief Operational Risk Officer, and other senior management with regards to our risk management processes, controls, talent, and capabilities to monitor our risk culture and emerging and strategic risks. The Risk Committee of our Board of Directors and the Enterprise Risk Management Committee (ERMC) provides oversight of our Enterprise Risk Management framework, processes, and methodologies, and approves our Enterprise Risk Management policy, which governs risk governance, risk oversight, and risk appetite. ESG risks—in particular climate risk—have been included as an emerging risk for the company and are part of our Enterprise Risk Management scope. A dedicated group associated with climate risk, with direct accountability to the ERMC, has been established. Additionally, the Nominating, Governance, and Public Responsibility Committee (NGPRC) of the Board has oversight of ESG matters including climate-related issues. The ESG Steering Committee, comprised of senior leaders across the organization, and Advance Climate Solutions Working Group consider climate-related risks in connection with developing climate-related goals and operational strategies. In 2020, we completed a comprehensive assessment to identify priority environmental, social, and governance issues for our business with input from internal and external stakeholders. As a result of this process, we ranked 20 priority ESG issues based on their relative importance to our business and to our stakeholders. Key issues identified included climate change, energy, and GHG emissions, data privacy and security, financial resiliency, business ethics, responsible travel and consumption, inclusion and diversity, and colleague attraction and retention. 3c. Describe how processes for identifying, assessing, and managing climate-related risks are integrated into the organization’s overall risk management We have a comprehensive ERM program to identify, aggregate, monitor, and manage risks. The program also defines our risk appetite, governance, culture, and capabilities. ESG and climate- related risks are currently identified as an “emerging risk” within our risk governance framework. The implementation and execution of the ERM program is headed by our Chief Risk Officer. The ERMC, chaired by our Chief Risk Officer, is the highest-level management committee to oversee all firm-wide risks and is responsible for risk governance, risk oversight, and risk appetite. The ERMC reviews key risk exposures, trends and concentrations, significant compliance matters, and provides guidance on the steps to monitor, control, and report major risks. ERMC has also approved the formation of the Climate Risk Management Working Group, composed of cross-functional representation with direct oversight specifically to address evolving regulatory expectations on management of climate-related financial risks. In addition, the Asset Liability Committee, chaired by our Chief Financial Officer, is responsible for managing our capital, funding and liquidity, investment, market risk, and asset/liability activities in accordance with our policies and in compliance with applicable regulatory requirements. The ESG Steering Committee, comprised of senior leadership, discuss ESG topics and climate-related risks, opportunities, and strategies to advance our ESG goals. Transition risks and opportunities, including current and emerging regulations, disclosure requirements, legal and reputational risks, and customer requirements are considered by teams including Global Real Estate and Workplace Experience, Global Risk and Compliance, General Counsel’s Organization, Finance, Technology, CA&C, Corporate Sustainability, and ESG Teams. Physical risks and opportunities, including extreme weather events and natural disasters, are identified and measured for severity as part of our business continuity planning and primarily overseen by our Global Real Estate and Workplace Experience and Technology Teams. Disaster Recovery and Business Continuity Plans are developed and updated regularly to ensure steps are in place to identify and respond before, during, and after a service continuity event. Our facility and data center teams review these established procedures and controls, test them annually, and certify key equipment and systems operations to ensure uninterrupted operation of our data centers during localized weather events. Our facility infrastructure is monitored 24/7 and test results are tracked and reported. Our US-based data center facilities are ISO-certified to ensure that environmental risks and/or opportunities are identified and prioritized. INTRODUCTION PROMOTING DE&I ADVANCING CLIMATE SOLUTIONS BUILDING FINANCIAL CONFIDENCE OUR ESG GOVERNANCE & OPERATING RESPONSIBLY SUPPORTING DATA OUR COMMITMENT TO ESG 107
TCFD Recommendation Disclosure 4. Metrics & Targets 4a. Disclose the metrics used by the organization to assess climate-related risks and opportunities in line with its strategy and risk management process American Express tracks metrics to evaluate climate-related risks and opportunities including total GHG emissions, energy and water consumption, purchased and onsite renewable electricity, waste, and green building certifications. For a historical view of our metrics, see the Environmental Performance Data Summary section of our 2021–2022 ESG Report. 4b. Disclose Scope 1, Scope 2, and, if appropriate, Scope 3 greenhouse gas (GHG) emissions, and the related risks We track and disclose our Scope 1, 2, and 3 (Category 5 - Waste and Category 6 - Business Travel) GHG emissions annually. Emissions are calculated in alignment with the Greenhouse Gas Protocol and third-party verified using the ISO14064-3 standard. Since 2018, we have been certified by CarbonNeutral®, a leading third-party framework, and powered by 100% renewable electricity across our global operations. 1 To maintain carbon neutrality, we continue to implement energy efficiency measures, purchase renewable EACs, carbon offsets, and have onsite solar panels at our data center in North Carolina and our office in the United Kingdom. For more information on our GHG emissions data for 2021, 2020, and 2019, refer to the Environmental Performance Data Summary on pages 96-99. 1. Achieved carbon neutral operations for Scope 1 (direct emissions from sources owned or controlled by American Express), Scope 2 (indirect and market-based emissions), and Scope 3 (waste and employee business travel, including third-party air, rail, and rental cars) emissions through renewable energy credits, carbon offsets, and reduced GHG emissions. Operations include all our managed facilities, field sites, and data centers). Managed facilities are individual properties operationally managed by our global real estate team and housing critical business functions. Field sites are individual properties that are not operationally managed by our global real estate team but directly by our business units. They are typically smaller sites, less than 30,000 square feet (including airport lounges, foreign exchange kiosks, and sales offices) that are owned or leased by American Express. INTRODUCTION PROMOTING DE&I ADVANCING CLIMATE SOLUTIONS BUILDING FINANCIAL CONFIDENCE OUR ESG GOVERNANCE & OPERATING RESPONSIBLY SUPPORTING DATA OUR COMMITMENT TO ESG 108
TCFD Recommendation Disclosure 4c. Describe the targets used by the organization to manage climate- related risks and opportunities and performance against targets We aim to minimize the impact of our operations on the environment. In 2019, we set environmental performance goals to reduce energy, water, and waste, power operations with renewable electricity, remain CarbonNeutral®, source paper responsibly, phase out single-use plastics, and achieve green building certifications by 2025. In 2020, we joined RE100, a global coalition of leading businesses that champion 100% renewable electricity. In 2021, we developed goals across our ESG strategy’s three pillars: Promote Diversity, Equity, and Inclusion; Advance Climate Solutions; and Build Financial Confidence. We established strategic objectives and corresponding goals to minimize our climate impact, manage our climate-related risks and opportunities, enable our customers and partners to transition to a low-carbon economy through the development of new capabilities across our company, and support community programs and initiatives to help build more climate resilient and equitable communities. In 2021, we formally committed to the Science Based Targets initiative and joined the Business Ambition to 1.5°C aligned with the goal to limit global warming to 1.5°C. American Express has set the following climate-related goals: Advance Climate Solutions Goals • Commit to net-zero emissions by 2035, in alignment with the Science Based Targets initiative (SBTi) • Enhance the management of climate-related risks and opportunities across our business • Pilot low carbon product innovations, including carbon offset and tracking solutions, by the end of 2022 • Provide at least $10 million to support initiatives, partnerships, and programs that address the adverse effects of climate change and pollution on communities from 2021 through 2025 • Engage our colleagues in sustainability initiatives through the Green2Gether program Operational Environmental Goals • Remain carbon neutral across our operations 1 • Continue to power our operations with 100% renewable electricity • Reduce energy use by 35% across our managed facilities compared to a 2011 baseline by 2025 2 • Reduce water use from our managed facilities by 10% per colleague compared to a 2019 baseline by 2025 3 • Reduce waste generated from our managed facilities by 10% per colleague compared to a 2019 baseline by 2025 3 • Divert 60% of office waste generated from our managed facilities away from landfills by 2025 3 • Achieve green building certifications for 60% of our operations by 2025 3 • Eliminate single-use plastics across our operations by 2025 • Source 100% of our direct marketing, customer communications, and office paper from certified responsibly managed forests by 2025 For more information, refer to Progress On Our 2025 Operational Environmental Goals and Environmental Performance Data Summary in our 2021–2022 ESG Report. 1. Achieved carbon neutral operations for Scope 1 (direct emissions from sources owned or controlled by American Express), Scope 2 (indirect market-based emissions), and Scope 3 (waste and employee business travel, including third-party air, rail, and rental cars) emissions through renewable energy credits, carbon offsets, and reduced GHG emissions. Operations include all our managed facilities, field sites, and data centers). Managed facilities are individual properties operationally managed by our global real estate team and housing critical business functions. Field sites are individual properties that are not operationally managed by our global real estate team but directly by our business units. They are typically smaller sites, less than 30,000 square feet (including airport lounges, foreign exchange kiosks, and sales offices) that are owned or leased by American Express. 2. Energy use reduction since 2011 calculations are based only on managed facilities where metered data is available which represents 6,786,897ft 2 and 99,856 MWh of energy consumption in 2021 and excludes field sites, managed sites with estimated data, and data centers not operationally managed by our global real estate team. 3. Measurement is based only on managed facilities where metered and/or measured data is available; per colleague goals based on number of employees assigned in such managed facilities. INTRODUCTION PROMOTING DE&I ADVANCING CLIMATE SOLUTIONS BUILDING FINANCIAL CONFIDENCE OUR ESG GOVERNANCE & OPERATING RESPONSIBLY SUPPORTING DATA OUR COMMITMENT TO ESG 109
2021–2022 SASB INDEX American Express Sustainability Accounting Standards Board (SASB) Index This Index reflects our report in accordance with Industry Standards Version 2018–10 issued by the Sustainability Accounting Standards Board (SASB). Our disclosures under those standards are based on three SICS industries that are most closely aligned with our mix of businesses: Consumer Finance (FN-CF), Commercial Banks (FN-CB), and Software and IT Services (TC-SI). Unless otherwise noted, all data and descriptions are reported for the American Express Company on a consolidated basis where applicable and not just the businesses or segments relevant to a particular industry. We do not currently disclose all metrics included in the standards for these three SICS industries but will continue to evaluate them in the future. Our commitment is to provide investors with useful, relevant, and meaningful sustainability information and we may evolve our disclosures on these SASB topics over time. All reported data is as of and for the year ended December 31, 2021, unless otherwise noted. While most information is found in our 2021–2022 ESG Report, other primary sources include our 2021 Annual Report on Form 10-K , 2022 Proxy Statement , 2021 CDP Climate Change Response , and American Express website . SASB Topic Accounting Metric Code Response Business Ethics Total amount of monetary losses as a result of legal proceedings associated with fraud, insider trading, anti-trust, anti-competitive behavior, market manipulation, malpractice, or other related financial industry laws or regulations FN-CB-510a.1 F Form 10-K on page 127: Note 12: Contingencies and Commitments Description of whistleblower policies and procedures FN-CB-510a.2 ESG Report: Our Business Ethics pages 82-83, American Express AEMP17–Whistleblower Claims Policy Customer Privacy Number of account holders whose information is used for secondary purposes FN-CF-220a.1 TC-SI-220a.2 American Express does not report a metric on the bases specified in the standard. American Express’ online Privacy Center and its Privacy Statement describe the information we collect from our customers and how we use it. Total amount of monetary losses as a result of legal proceedings associated with customer privacy FN-CF-220a.2 TC-SI-220a.3 American Express discloses all material legal proceedings in our SEC reports. INTRODUCTION PROMOTING DE&I ADVANCING CLIMATE SOLUTIONS BUILDING FINANCIAL CONFIDENCE OUR ESG GOVERNANCE & OPERATING RESPONSIBLY SUPPORTING DATA OUR COMMITMENT TO ESG 110
SASB Topic Accounting Metric Code Response Data Privacy and Freedom of Expression Description of policies and practices relating to behavioral advertising and user privacy TC-SI-220a.1 2021–2022 ESG Report: • Protecting Our Customers on page 67 • Data Protection and Privacy on page 84 • Supporting Data: Key Policies on page 101 The Privacy Center and Security Center on our website Data Security (1) Number of data breaches, (2) percentage involving personally identifiable information (PII), (3) number of account holders affected FN-CF-230a.1 FN-CB-230a.1 TC-SI-230a.1 American Express’ information and cybersecurity program is designed to identify risks and protect the confidentiality, integrity, and availability of our data, and our information systems. It is built upon a foundation of advanced security technology, a well-staffed and highly-trained team of experts, and robust operations based on the National Institute of Standards and Technology Cybersecurity Framework. This consists of controls designed to identify, protect, detect, respond, and recover from information and cybersecurity incidents. American Express does not report a metric on the bases specified in the standard, but information on cybersecurity regulation, risks, and risk management can be found in Form 10-K on pages 18, 24–25, 27, 33, 71 and 2021–2022 ESG Report: Data Protection and Privacy on page 84. Card-related fraud losses from (1) card-not-present fraud and (2) card-present and other fraud FN-CF-230a.2 C Card Member and merchant-related fraud losses are included within Other Expenses, the details for which are provided in Form 10-K on page 141: Note 18: Other Fees and Commissions and Other Expenses. Description of approach to identifying and addressing data security risks FN-CF-230a.3 FN-CB-230a.2 TC-SI-230a.2 ESG Report: Data Protection and Privacy on page 84, American Express Privacy Disclosures on our website, 2022 Proxy on page 22 Environmental Footprint of Hardware Infrastructure (1) Total energy consumed, (2) percentage grid electricity, (3) percentage renewable TC-SI-330a.4 2021–2022 ESG Report: Supporting Data: Environmental Performance Data Summary on page 96 1) Total energy consumed: 269,898 MWh 2) Total Percentage Grid Electricity: 75% 3) Percentage renewable electricity: 100%, Percentage of renewable energy: 75% Discussion of the integration of environmental considerations into strategic planning for data center needs TC-SI-330a.5 2021-2022 ESG Report: • Minimizing Our Climate Impact on page 41 • Renewable Energy and Increasing Energy Efficiency at Our Data Centers on page 45 INTRODUCTION PROMOTING DE&I ADVANCING CLIMATE SOLUTIONS BUILDING FINANCIAL CONFIDENCE OUR ESG GOVERNANCE & OPERATING RESPONSIBLY SUPPORTING DATA OUR COMMITMENT TO ESG 111
SASB Topic Accounting Metric Code Response Financial Inclusion and Capacity Building Number of participants in financial literacy initiatives for unbanked, underbanked, or underserved customers FN-CB-240a.4 Financial literacy programs and initiatives are disclosed in our 2021–2022 ESG Report: Building Financial Confidence on pages 56-75. Our vision under the Build Financial Confidence pillar of our ESG strategy is to help provide responsible, secure, and transparent products and services to help people and businesses build financial resilience. Our goals under this pillar include: (1) Provide access to credit to at least 4 million individuals from underserved or underrepresented populations from 2021 to 2025. (2) Provide at least 5 million individuals with tools, resources, and educational content to improve financial well-being from 2021 through 2025. In 2021, we provided $20 million to the Accion Opportunity Fund, a nonprofit Community Development Financial Institution and small business lender to expand access to loans for historically underfunded small businesses in the United States, including those owned by underrepresented groups. (1) Number and (2) amount of loans outstanding qualified to programs designed to promote small business and community development FN-CB-240a.1 American Express engages in programs designed to support small businesses and community development. In 2021, the American Express Center for Community Development underwrote $265 million in investments, loans, and grants to support small business needs, job creation and retention, and affordable housing, including the development of 1,947 units for families in need. Additionally, through our Backing Small Initiative we provide financial support and resources to economically vulnerable small business owners. 2021–2022 ESG Report: Building Financial Confidence: Backing Our Communities pages 69-75 Incorporation of Environmental, Social, and Governance Factors in Credit Analysis Description of approach to incorporation of environmental, social, and governance (ESG) factors in credit analysis FN-CB-410a.2 2021–2022 ESG Report: Responsible Lending on page 88 Recruiting and Managing a Global, Diverse, and Skilled Workforce Employee engagement as a percentage TC-SI-330a.2 We engage our colleagues regularly, including through initiatives and an annual internal colleague survey. In the 2021 annual Colleague Experience Survey, 90% of survey participants said that they would recommend American Express as a great place to work. 2021–2022 ESG Report: Promoting Diversity, Equity, and Inclusion: Backing Our Colleagues on pages 24-31, Advancing Climate Solutions: Backing Our Colleagues on pages 48-49, Building Financial Confidence: Backing Our Colleagues on pages 60-61 Percentage of gender and racial/ethnic group representation for (1) management, (2) technical staff, and (3) all other employees TC-SI-330a.3 2021–2022 ESG Report: 2021 Global Workforce Representation on page 25 and 2021 EEO-1 Data on page 94 INTRODUCTION PROMOTING DE&I ADVANCING CLIMATE SOLUTIONS BUILDING FINANCIAL CONFIDENCE OUR ESG GOVERNANCE & OPERATING RESPONSIBLY SUPPORTING DATA OUR COMMITMENT TO ESG 112
SASB Topic Accounting Metric Code Response Selling Practices Percentage of total remuneration for covered employees that is variable and linked to the amount of products and services sold FN-CF-270a.1 An explanation of our compensation programs can be found in the Compensation Discussion and Analysis section of our 2022 Proxy Statement on pages 46–77; information on our stock option and award programs can be found in Form 10-K on Note 10: Stock Plans on pages 124–125. Approval rate for (1) credit and (2) pre-paid products for applicants with FICO scores above and below 660 FN-CF-270a.2 American Express has a global Card Member base and FICO scores are not available in all regions or for all customer types. See 2021–2022 ESG Report: Building Financial Confidence: Helping individuals improve their financial health with confidence on page 65 and Responsible Lending on page 88. (1) Number of complaints filed with the Consumer Financial Protection Bureau (CFPB), (2) percentage with monetary or nonmonetary relief, (3) percentage disputed by consumer, and (4) percentage that resulted in investigation by the CFPB FN-CF-270a.4 CFPB Consumer Complaint Database Total amount of monetary losses as a result of legal proceedings associated with selling and servicing of products FN-CF-270a.5 American Express discloses material legal and regulatory proceedings in Form 10-K on page 127: Note 12: Contingencies and Commitments Systemic Risk Management Global Systemically Important Bank (G-SIB) score, by category FN-CB-550a.1 National Information Center website—American Express Company RSSD ID: 1275216 Description of approach to incorporation of results of mandatory and voluntary stress tests into capital adequacy planning, long-term corporate strategy, and other business activities FN-CB-550a.2 Form 10-K on pages 13–14 Managing Systemic Risks from Technology Disruptions Description of business continuity risks related to disruption of operations TC-SI-550.a.2 Form 10-K : Item 1A. Risk Factors on pages 22–23, 28, 30 Activity Metrics Number of unique consumers with an active (1) credit card account and (2) pre-paid debit card account FN-CF-000.A (1) The number of basic and total cards-in-force worldwide and related information are provided in Form 10-K on pages 47, 54, 58. Definitions of these metrics can be found on page 82 of the Form 10-K . (2) American Express does not report a metric for pre-paid debit card accounts. Number of (1) credit card accounts and (2) pre-paid debit card accounts FN-CF-000.B (1) The number of basic and total cards-in-force worldwide and related information are provided in Form 10-K on pages 47, 54, 58. Definitions of these metrics can be found on page 82 of the Form 10-K . (2) American Express does not report a metric for pre-paid debit card accounts. (1) Number and (2) value of loans by segment: (a) personal, (b) small business, and (c) corporate FN-CB-000.B Form 10-K : Table 7, Selected Credit-Related Statistical Information on page 50, and in individual business unit segment results for Global Consumer Services Group on page 52 and Global Commercial Services on page 57 INTRODUCTION PROMOTING DE&I ADVANCING CLIMATE SOLUTIONS BUILDING FINANCIAL CONFIDENCE OUR ESG GOVERNANCE & OPERATING RESPONSIBLY SUPPORTING DATA OUR COMMITMENT TO ESG 113
2021–2022 GRI CONTENT INDEX The American Express 2021–2022 ESG Report references the Global Reporting Initiative (GRI) Standards: Core Option. In addition, we included disclosures from the Financial Services Sector Supplement. The following index outlines the location of the information required for each GRI disclosure. While most information is found in this report, other primary sources referenced include: 2021 Annual Report on Form 10-K , 2022 Proxy Statement , American Express website , and 2021 CDP Climate Change Response . Code GRI Disclosure Reference/Location General Disclosures GRI 2: General Disclosures (2021) 2-1 Organizational Details American Express Company 200 Vesey Street New York, NY 10285 Form 10-K Item 1 2-2 Entities included in the organization’s sustainability reporting 2021–2022 ESG Report: About This Report on page 3, Form 10-K Item 1 2-3 Reporting period, frequency and contact point • January 1, 2021–December 31, 2022. In some cases, we share highlights from programs and initiatives that were launched in 2022 to provide more up-to-date information to our stakeholders. • Frequency: Annual • Report Published: July 2022 • Contact: corporate.sustainability@aexp.com 2-4 Restatements of information There are no restatements of information from prior periods in the 2021–2022 ESG Report. 2-5 External assurance We assure report content through an internal review process, including executive oversight of subject matter reviews and validation. Apex Companies, LLC (Apex) was engaged to conduct an independent verification of the energy consumption and greenhouse gas emissions reported by American Express for the calendar year 2021. 2021–2022 ESG Report: Supporting Data: Limited Assurance Statement of GHG Emissions on page 100. 2-6 Activities, value chain, and other business relationships Form 10-K Item 1 2-7 and 2-8 Employees • As of December 31, 2021, American Express employed approximately 64,000 colleagues, with approximately 22,000 in the United States and approximately 42,000 colleagues outside the United States • 2021–2022 ESG Report: Promoting Diversity, Equity & Inclusion: Backing Our Colleagues on pages 24-31 • Form 10-K Item 1 2-9 Governance structure and composition 2021–2022 ESG Report: ESG Governance on pages 76-88, 2022 Proxy Statement on pages 4-27 2-10 Nomination and selection of the highest governance body 2022 Proxy Statement on pages 4, 14-20 INTRODUCTION PROMOTING DE&I ADVANCING CLIMATE SOLUTIONS BUILDING FINANCIAL CONFIDENCE OUR ESG GOVERNANCE & OPERATING RESPONSIBLY SUPPORTING DATA OUR COMMITMENT TO ESG 114
Code GRI Disclosure Reference/Location 2-11 Chair of the highest governance body Stephen J. Squeri CEO & Chairman— 2022 Proxy Statement on page 12 2-12 Role of the highest governance body in overseeing the management of impacts 2021–2022 ESG Report: ESG Governance on pages 76-88, 2022 Proxy Statement on page 24 2-13 Delegation of responsibility for management of impacts 2021–2022 ESG Report: ESG Governance on pages 76-88 2-14 Role of the highest governance body in sustainability reporting 2021–2022 ESG Report: ESG Governance on pages 76-88 2-15 Conflicts of interest 2022 Proxy Statement on pages 16-27 and 33 2-16 Communications of critical concerns 2021–2022 ESG Report: Our Business Ethics on pages 82-83, Code of Conduct , Amex Ethics Hotline 2-17 Collective knowledge of the highest governance body 2022 Proxy Statement on pages 7-13 2-18 Evaluation of the performance of the highest governance body 2022 Proxy Statement on pages 16-17 2-19 Renumeration policies 2021–2022 ESG Report: ESG and Executive Compensation on page 81, 2022 Proxy Statement on pages 47-77 2-20 Process to determine renumeration 2022 Proxy Statement on pages 48–55 2-21 Annual total compensation ratio 2022 Proxy Statement on page 77 2-22 Statement on sustainable development strategy 2021–2022 ESG Report: A Message from Our Chairman and CEO on pages 4-7 2-23 Policy commitments 2021–2022 ESG Report: Our Business Ethics on pages 82-83, Supporting Data: Key Policies on page 101, Corporate Governance Principles , Code of Conduct , Human Rights Statement , American Express Policy Engagement and Political Activity 2-24 Embedding policy commitments 2021–2022 ESG Report: Our Business Ethics on pages 82-83 2-25 Processes to remediate negative impacts 2021–2022 ESG Report: Our Business Ethics on pages 82-83, Code of Conduct 2-26 Mechanisms for seeking advice and raising concerns 2021–2022 ESG Report: Our Business Ethics on pages 82-83, Code of Conduct , Amex Ethics Hotline 2-27 Compliance with laws and regulations Form 10-K Note 12 : Contingencies and Commitments on pages 127-129 2-28 Membership associations 2021–2022 ESG Report: Supporting Data: ESG Partnerships on page 92 2-29 Approach to stakeholder engagement 2021–2022 ESG Report: Supporting Data: Our Commitment to ESG on pages 90-92 2-30 Collective bargaining agreements We have a small number of employees which were subject to collective bargaining agreements in 2021. We believe that relations with our employees are positive. GRI 3: Material Topics (2021) 3-1 Process to determine material topics 2021–2022 ESG Report: Supporting Data: Our Priority ESG Issues on page 90 3-2 List of material topics 2021–2022 ESG Report: Supporting Data: ESG Priority Issues Matrix on page 90 3-3 Management of material topics 2021–2022 ESG Report INTRODUCTION PROMOTING DE&I ADVANCING CLIMATE SOLUTIONS BUILDING FINANCIAL CONFIDENCE OUR ESG GOVERNANCE & OPERATING RESPONSIBLY SUPPORTING DATA OUR COMMITMENT TO ESG 115
Code GRI Disclosure Reference/Location Economic Disclosures 201-1 Direct economic value generated and distributed Form 10-K Item 7 201-2 Financial implications and other risks and opportunities due to climate change 2021–2022 ESG Report: Advancing Climate Solutions on pages 38-55, TCFD Index on pages 103-109, Form 10-K Item 1A , 2021 CDP Climate Change Response (C2) 201-3 Defined benefit plan obligations and other retirement plans 2021–2022 ESG Report: Building Financial Confidence: Backing Our Colleagues on pages 60-61, Form 10-K Note 11: Retirement Plans on page 126, American Express Colleague Benefits Website GRI 203: Indirect Economic Impacts (2016) 203-1 Infrastructure investments and services supported 2021–2022 ESG Report: Advancing Climate Solutions: Moving to Net-Zero on pages 43-47 203-2 Significant indirect economic impacts 2021–2022 ESG Report: • Our Commitment to ESG on pages 8-18 • Promoting Diversity, Equity and Inclusion: Backing Our Communities on pages 35-37 • Advancing Climate Solutions: Backing Our Communities on pages 53-55 • Building Financial Confidence: Backing Our Communities on pages 69-75 GRI 205: Anti-Corruption (2016) 205-1 Operations assessed for risks related to corruption 2021–2022 ESG Report: Our Business Ethics on pages 82-83 205-2 Communication and training about anti-corruption policies and procedures 2021–2022 ESG Report: Our Business Ethics on pages 82-83. All colleagues must complete anti-corruption and bribery training tied to their annual compensation that includes information about applicable laws and regulations for their location. GRI 206: Anti-competitive Behavior (2016) 206-1 Legal actions for anti-competitive behavior, anti-trust, and monopoly practices Form 10-K Item 3 , Code of Conduct INTRODUCTION PROMOTING DE&I ADVANCING CLIMATE SOLUTIONS BUILDING FINANCIAL CONFIDENCE OUR ESG GOVERNANCE & OPERATING RESPONSIBLY SUPPORTING DATA OUR COMMITMENT TO ESG 116
Code GRI Disclosure Reference/Location Environmental Disclosures GRI 301: Materials (2016) 301-2 Recycled input materials used 2021–2022 ESG Report: Advancing Climate Solutions: Backing our Customers & Partners: Promoting a circular economy and expanding recycled plastic cards on page 51 which includes the goal for a vast majority of the plastic cards issued by American Express to be made of at least 70% recycled or reclaimed plastics by the end of 2024. GRI 302: Energy (2016) 302-1 Energy consumption within the organization 2021–2022 ESG Report: Supporting Data: Environmental Performance Data Summary on page 96, 2021 CDP Climate Change Response (C8) 302-2 Energy consumption outside of the organization 2021–2022 ESG Report: Supporting Data: Environmental Performance Data Summary on page 96, 2021 CDP Climate Change Response (C8) 302-3 Energy intensity 2021–2022 ESG Report: Moving to Net-Zero on pages 43-47, Supporting Data: Environmental Performance Data Summary on page 96, 2021 CDP Climate Change Response (C8) 302-4 Reduction of energy consumption 2021–2022 ESG Report: Moving to Net-Zero on pages 43-47, Supporting Data: Environmental Performance Data Summary on page 96, 2021 CDP Climate Change Response (C3) 302-5 Reductions in energy requirements of products and services 2021–2022 ESG Report: Moving to Net-Zero on pages 43-47, Supporting Data: Environmental Performance Data Summary on page 96, 2021 CDP Climate Change Response (C3) GRI 303: Water and Effluents (2016) 303-5 Water Consumption 2021–2022 ESG Report: Supporting Data: Environmental Performance Data Summary on page 96 GRI 305: Emissions (2016) 305-1 Direct (Scope 1) GHG emissions 2021–2022 ESG Report: Supporting Data: Environmental Performance Data Summary on page 96, 2021 CDP Climate Change Response (C6) 305-2 Energy indirect (Scope 2) GHG emissions 2021–2022 ESG Report: Supporting Data: Environmental Performance Data Summary on page 96, 2021 CDP Climate Change Response (C6) INTRODUCTION PROMOTING DE&I ADVANCING CLIMATE SOLUTIONS BUILDING FINANCIAL CONFIDENCE OUR ESG GOVERNANCE & OPERATING RESPONSIBLY SUPPORTING DATA OUR COMMITMENT TO ESG 117
Code GRI Disclosure Reference/Location 305-3 Other indirect (Scope 3) GHG emissions 2021–2022 ESG Report: Supporting Data: Environmental Performance Data Summary on page 96, 2021 CDP Climate Change Response (C6) 305-4 GHG emissions intensity 2020–2021 ESG Report: Supporting Data: Environmental Performance Data Summary on page 96, 2021 CDP Climate Change Response (C6) 305-5 Reduction of GHG emissions 2021–2022 ESG Report: Moving to Net-Zero on pages 43-47, Supporting Data: Environmental Performance Data Summary on page 96, 2021 CDP Climate Change Response (C6) GRI 306: Waste (2020) 306-1 Waste generation and specific waste-related impacts 2021–2022 ESG Report: Sharpening our focus on waste reduction and management on page 46, Supporting Data: Environmental Performance Data Summary on page 96 306-2 Management of significant waste-related impacts 2021–2022 ESG Report: Sharpening our focus on waste reduction and management on page 46, Supporting Data: Environmental Performance Data Summary on page 96 306-3 Waste generated 2021–2022 ESG Report: Sharpening our focus on waste reduction and management on page 46, Supporting Data: Environmental Performance Data Summary on page 96 306-4 Waste diverted from disposal 2021–2022 ESG Report: Sharpening our focus on waste reduction and management on page 46, Supporting Data: Environmental Performance Data Summary on page 96 306-5 Waste directed to disposal 2021–2022 ESG Report: Sharpening our focus on waste reduction and management on page 46, Supporting Data: Environmental Performance Data Summary on page 96 Social Disclosures GRI 401: Employment (2016) 401-1 New employee hires and employee turnover 2021–2022 ESG Report: Hiring, Promotion, and Retention on page 26 401-2 Benefits provided to full-time employees that are not provided to temporary or part-time employees 2021–2022 ESG Report: Promoting Diversity, Equity, and Inclusion: Backing Our Colleagues on pages 24-31, American Express Colleague Benefits Website 401-3 Parental leave 2021–2022 ESG Report: Promoting Diversity, Equity, and Inclusion: Backing Our Colleagues: Expansive and Impactful Family Support on page 28, American Express Colleague Benefits Website INTRODUCTION PROMOTING DE&I ADVANCING CLIMATE SOLUTIONS BUILDING FINANCIAL CONFIDENCE OUR ESG GOVERNANCE & OPERATING RESPONSIBLY SUPPORTING DATA OUR COMMITMENT TO ESG 118
Code GRI Disclosure Reference/Location GRI 403: Occupational Health and Safety (2016) 403-1 Occupational health and safety management system 2021–2022 ESG Report: Prioritizing Colleagues’ Health, Safety, and Well-being on page 87, American Express Colleague Benefits Website 403-4 Worker participation, consultation, and communication on occupational health and safety 2021–2022 ESG Report: Prioritizing Colleagues’ Health, Safety, and Well-being on page 87, American Express Colleague Benefits Website 403-6 Promotion of worker health 2021–2022 ESG Report: Prioritizing Colleagues’ Health, Safety, and Well-being on page 87, American Express Colleague Benefits Website GRI 404: Training and Education (2016) 404-1 Average hours of training per year per employee 12.9 hours of mandatory training on average per colleague. Learn more about colleague training and professional development in 2021– 2022 ESG Report: Promoting Diversity, Equity, and Inclusion: Backing Our Colleagues on pages 24-31 404-2 Programs for upgrading employee skills and transition assistance programs 2021–2022 ESG Report: Building Financial Confidence: Backing Our Colleagues on pages 60-61, About Team Amex Website 404-3 Percentage of employees receiving regular performance and career development reviews 2021–2022 ESG Report: Building Financial Confidence: Backing Our Colleagues on pages 60-61, 2022 Proxy Statement on page 40 GRI 405: Diversity and Equal Opportunity (2016) 405-1 Diversity of governance bodies and employees 2021–2022 ESG Report: Our Corporate Governance Framework on page 78, A Focus on Our Global Workforce Diversity on page 25 405-2 Ratio of basic salary and remuneration of women to men 2021–2022 ESG Report: Promoting Diversity, Equity, and Inclusion: Maintaining 100% pay equity on page 26 GRI 413: Local Communities (2016) 413-1 Operations with local community engagement, impact assessments, and development programs 2021–2022 ESG Report: • Promoting Diversity, Equity & Inclusion: Backing Our Communities on pages 35-37 • Advancing Climate Solutions: Backing Our Communities on pages 53-55 • Building Financial Confidence: Backing Our Communities on pages 69-75 INTRODUCTION PROMOTING DE&I ADVANCING CLIMATE SOLUTIONS BUILDING FINANCIAL CONFIDENCE OUR ESG GOVERNANCE & OPERATING RESPONSIBLY SUPPORTING DATA OUR COMMITMENT TO ESG 119
Code GRI Disclosure Reference/Location GRI 414: Supplier Social Assessments 2016 414-1 New suppliers that were screened using social criteria 2021–2022 ESG Report: Responsible Sourcing Throughout the Global Supply Chain on page 86, American Express Commitment to Supplier Diversity, Equity, and Inclusion Website GRI 415: Public Policy (2016) 415-1 Political Contributions American Express Company Political Contributions Report GRI 418: Customer Privacy (2016) 418-1 Substantiated complaints concerning breaches of customer privacy and losses of customer data American Express does not report a metric on the bases specified in the standard. Learn more about our customer privacy practices in our 2021–2022 ESG Report: • Protecting Our Customers on page 67 • Data Protection and Privacy on page 84 Financial Services Sector Supplement (2008) FS2 Procedures for assessing and screening environmental and social risks in business lines 2021-2022 ESG Report: Our ESG Governance and Operating Responsibly: Risk Management on page 85 FS6 Percentage of the portfolio for business lines by specific region, size, and by sector Form 10-K Item 1 FS8 Monetary value of products and services designed to deliver a specific environmental benefit for each business line broken down by purpose 2021–2022 ESG Report: • Advancing Climate Solutions: Backing Our Customers and Partners on pages 50-52 • Responsible Lending on page 88 • Investing Activities on pages 88 FS14 Initiatives to improve access to financial services for disadvantaged people 2021–2022 ESG Report: Building Financial Confidence on pages 56-75 FS16 Initiatives to enhance financial literacy by type of beneficiary 2021–2022 ESG Report: Building Financial Confidence on pages 56-75 INTRODUCTION PROMOTING DE&I ADVANCING CLIMATE SOLUTIONS BUILDING FINANCIAL CONFIDENCE OUR ESG GOVERNANCE & OPERATING RESPONSIBLY SUPPORTING DATA OUR COMMITMENT TO ESG 120
For more information, visit go.amex/esg We value feedback from our stakeholders. If you would like to get in touch, please email corporate.sustainability@aexp.com . Thank you for reading our 2021–2022 ESG Report.