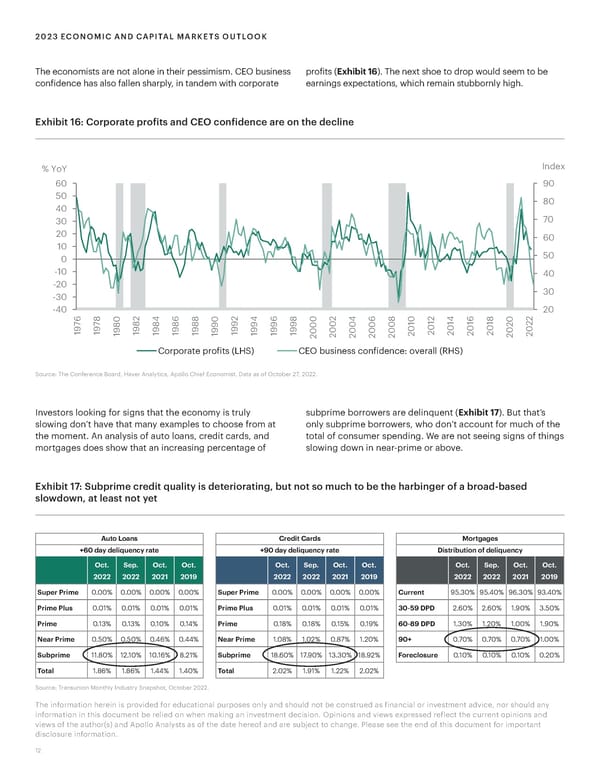
2023 ECONOMIC AND CAPITAL MARKETS OUTLOOK The economists are not alone in their pessimism. CEO business profits (Exhibit 16). The next shoe to drop would seem to be confidence has also fallen sharply, in tandem with corporate earnings expectations, which remain stubbornly high. Exhibit 16: Corporate profits and CEO confidence are on the decline % YoY Index 60 90 50 80 40 30 70 20 60 10 0 50 -10 40 -20 30 -30 -40 2 2 2 2 2 20 6 8 0 4 6 8 0 4 6 8 0 4 6 8 0 1 4 6 8 0 7 7 8 8 8 8 8 9 9 9 9 9 0 0 0 0 0 1 0 1 1 1 2 2 9 9 9 9 9 9 9 9 9 9 9 9 0 0 0 0 0 0 0 0 0 0 0 1 1 1 1 1 1 1 1 1 1 1 1 2 2 2 2 2 2 2 2 2 2 2 2 Corporate profits (LH C siness onfiden e o€era‚‚ (ƒH Source: The Conference Board, Haver Analytics, Apollo Chief Economist. Data as of October 27, 2022. Investors looking for signs that the economy is truly subprime borrowers are delinquent (Exhibit 17). But that’s slowing don’t have that many examples to choose from at only subprime borrowers, who don’t account for much of the the moment. An analysis of auto loans, credit cards, and total of consumer spending. We are not seeing signs of things mortgages does show that an increasing percentage of slowing down in near-prime or above. Exhibit 17: Subprime credit quality is deteriorating, but not so much to be the harbinger of a broad-based slowdown, at least not yet Auto Loans Credit Cards Mortgages +60 day deliquency rate +90 day deliquency rate Distribution of deliquency Oct. Sep. Oct. Oct. Oct. Sep. Oct. Oct. Oct. Sep. Oct. Oct. 2022 2022 2021 2019 2022 2022 2021 2019 2022 2022 2021 2019 Super Prime 0.00% 0.00% 0.00% 0.00% Super Prime 0.00% 0.00% 0.00% 0.00% Current 95.30% 95.40% 96.30% 93.40% Prime Plus 0.01% 0.01% 0.01% 0.01% Prime Plus 0.01% 0.01% 0.01% 0.01% 30-59 DPD 2.60% 2.60% 1.90% 3.50% Prime 0.13% 0.13% 0.10% 0.14% Prime 0.18% 0.18% 0.15% 0.19% 60-89 DPD 1.30% 1.20% 1.00% 1.90% Near Prime 0.50% 0.50% 0.46% 0.44% Near Prime 1.08% 1.02% 0.87% 1.20% 90+ 0.70% 0.70% 0.70% 1.00% Subprime 11.80% 12.10% 10.16% 8.21% Subprime 18.60% 17.90% 13.30% 18.92% Foreclosure 0.10% 0.10% 0.10% 0.20% Total 1.86% 1.86% 1.44% 1.40% Total 2.02% 1.91% 1.22% 2.02% Source: Transunion Monthly Industry Snapshot, October 2022. The information herein is provided for educational purposes only and should not be construed as financial or investment advice, nor should any information in this document be relied on when making an investment decision. Opinions and views expressed reflect the current opinions and views of the author(s) and Apollo Analysts as of the date hereof and are subject to change. Please see the end of this document for important disclosure information. 12
 Apollo 2023 Economic and Capital Markets Outlook Page 11 Page 13