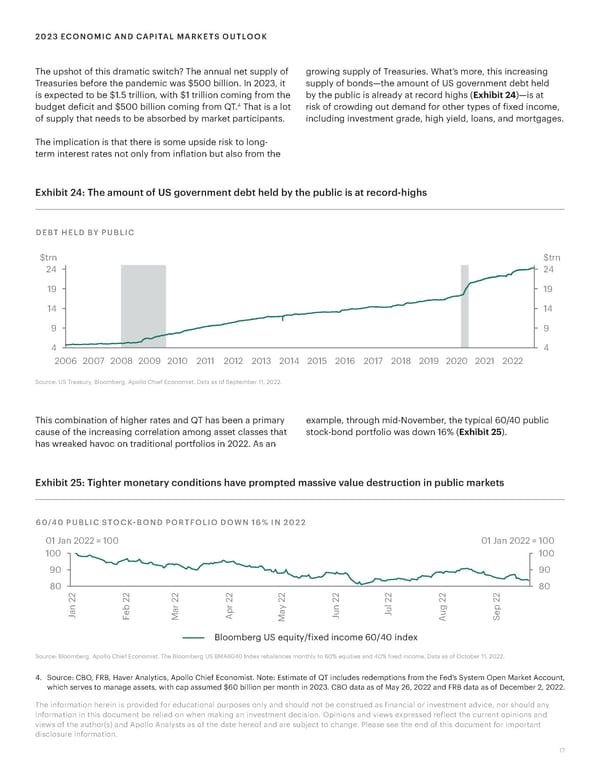
2023 ECONOMIC AND CAPITAL MARKETS OUTLOOK The upshot of this dramatic switch? The annual net supply of growing supply of Treasuries. What’s more, this increasing Treasuries before the pandemic was $500 billion. In 2023, it supply of bonds—the amount of US government debt held is expected to be $1.5 trillion, with $1 trillion coming from the by the public is already at record highs (Exhibit 24)—is at 4 budget deficit and $500 billion coming from QT. That is a lot risk of crowding out demand for other types of fixed income, of supply that needs to be absorbed by market participants. including investment grade, high yield, loans, and mortgages. The implication is that there is some upside risk to long- term interest rates not only from inflation but also from the Exhibit 24: The amount of US government debt held by the public is at record-highs DEBT HELD BY PUBLIC $trn $trn 24 24 19 19 14 14 9 9 4 4 2006 2007 2008 2009 2010 2011 2012 2013 2014 2015 2016 2017 2018 2019 2020 2021 2022 Source: US Treasury, Bloomberg, Apollo Chief Economist. Data as of September 11, 2022. This combination of higher rates and QT has been a primary example, through mid-November, the typical 60/40 public cause of the increasing correlation among asset classes that stock-bond portfolio was down 16% (Exhibit 25). has wreaked havoc on traditional portfolios in 2022. As an Exhibit 25: Tighter monetary conditions have prompted massive value destruction in public markets 60/40 PUBLIC STOCK-BOND PORTFOLIO DOWN 16% IN 2022 01 Jan 2022 = 100 01 Jan 2022 = 100 100 100 90 90 80 2 2 2 2 2 2 2 2 2 80 2 2 2 2 2 2 2 2 2 n b r r y n l g p a e a p a u u u e J F M A M J J A S Bloomberg US equity/fie inome 0/0 ine Source: Bloomberg, Apollo Chief Economist. The Bloomberg US BMA6040 Index rebalances monthly to 60% equities and 40% fixed income. Data as of October 11, 2022. 4. Source: CBO, FRB, Haver Analytics, Apollo Chief Economist. Note: Estimate of QT includes redemptions from the Fed’s System Open Market Account, which serves to manage assets, with cap assumed $60 billion per month in 2023. CBO data as of May 26, 2022 and FRB data as of December 2, 2022. The information herein is provided for educational purposes only and should not be construed as financial or investment advice, nor should any information in this document be relied on when making an investment decision. Opinions and views expressed reflect the current opinions and views of the author(s) and Apollo Analysts as of the date hereof and are subject to change. Please see the end of this document for important disclosure information. 17
 Apollo 2023 Economic and Capital Markets Outlook Page 16 Page 18