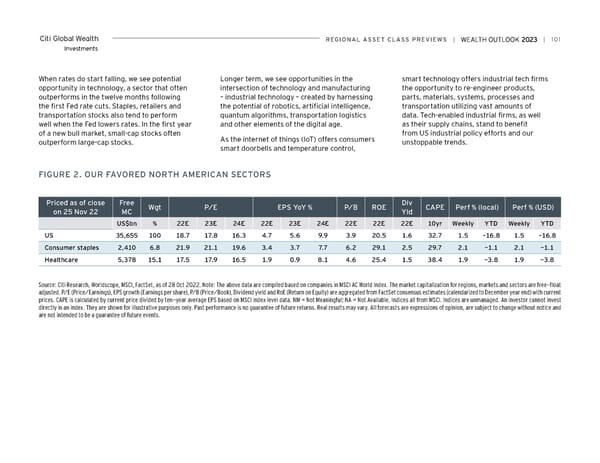
Citi Global Wealth reGioNAL ASSeT CLASS PreviewS | | 101 Investments When rates do start falling, we see potential Longer term, we see opportunities in the smart technology offers industrial tech firms opportunity in technology, a sector that often intersection of technology and manufacturing the opportunity to re-engineer products, outperforms in the twelve months following – industrial technology – created by harnessing parts, materials, systems, processes and the first Fed rate cuts. Staples, retailers and the potential of robotics, artificial intelligence, transportation utilizing vast amounts of transportation stocks also tend to perform quantum algorithms, transportation logistics data. Tech-enabled industrial firms, as well well when the Fed lowers rates. In the first year and other elements of the digital age. as their supply chains, stand to benefit of a new bull market, small-cap stocks often from US industrial policy efforts and our outperform large-cap stocks. As the internet of things (IoT) offers consumers unstoppable trends. smart doorbells and temperature control, FiGUre 2. oUr FAvoreD NorTH AMeriCAN SeCTorS Priced as of close Free wgt P/e ePS YoY % P/B roe Div CAPe Perf % (local) Perf % (USD) on 25 Nov 22 MC Yld US$bn % 22e 23e 24e 22e 23e 24e 22e 22e 22e 10yr weekly YTD weekly YTD US 35,655 100 18.7 17.8 16.3 4.7 5.6 9.9 3.9 20.5 1.6 32.7 1.5 -16.8 1.5 -16.8 Consumer staples 2,410 6.8 21.9 21.1 19.6 3.4 3.7 7.7 6.2 29.1 2.5 29.7 2.1 -1.1 2.1 -1.1 Healthcare 5,378 15.1 17.5 17.9 16.5 1.9 0.9 8.1 4.6 25.4 1.5 38.4 1.9 -3.8 1.9 -3.8 Source: Citi Research, Worldscope, MSCI, FactSet, as of 28 Oct 2022. Note: The above data are compiled based on companies in MSCI AC World Index. The market capitalization for regions, markets and sectors are free-float adjusted. P/E (Price/Earnings), EPS growth (Earnings per share), P/B (Price/Book), Dividend yield and RoE (Return on Equity) are aggregated from FactSet consensus estimates (calendarized to December year end) with current prices. CAPE is calculated by current price divided by ten-year average EPS based on MSCI index level data. NM = Not Meaningful; NA = Not Available. Indices all from MSCI. Indices are unmanaged. An investor cannot invest directly in an index. They are shown for illustrative purposes only. Past performance is no guarantee of future returns. Real results may vary. All forecasts are expressions of opinion, are subject to change without notice and are not intended to be a guarantee of future events.
 Citi Wealth Outlook 2023 Page 100 Page 102