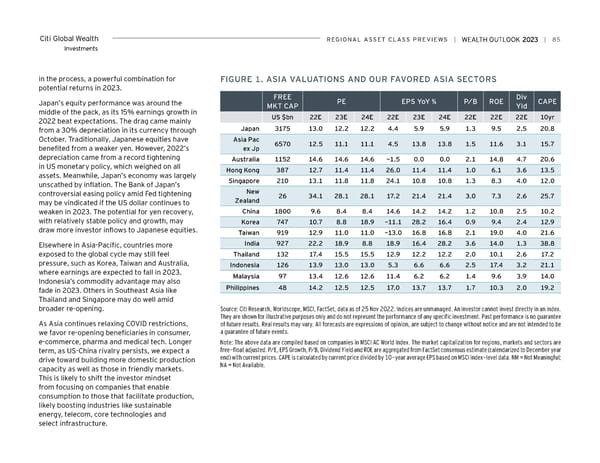
Citi Global Wealth reGioNAL ASSeT CLASS PreviewS | | 85 Investments in the process, a powerful combination for FiGUre 1. ASiA vALUATioNS AND oUr FAvoreD ASiA SeCTorS potential returns in 2023. Free Pe ePS YoY % P/B roe Div CAPe Japan’s equity performance was around the MKT CAP Yid middle of the pack, as its 15% earnings growth in US $bn 22e 23e 24e 22e 23e 24e 22e 22e 22e 10yr 2022 beat expectations. The drag came mainly from a 30% depreciation in its currency through Japan 3175 13.0 12.2 12.2 4.4 5.9 5.9 1.3 9.5 2.5 20.8 October. Traditionally, Japanese equities have Asia Pac 6570 12.5 11.1 11.1 4.5 13.8 13.8 1.5 11.6 3.1 15.7 benefited from a weaker yen. However, 2022’s ex Jp depreciation came from a record tightening Australia 1152 14.6 14.6 14.6 -1.5 0.0 0.0 2.1 14.8 4.7 20.6 in US monetary policy, which weighed on all Hong Kong 387 12.7 11.4 11.4 26.0 11.4 11.4 1.0 6.1 3.6 13.5 assets. Meanwhile, Japan’s economy was largely Singapore 210 13.1 11.8 11.8 24.1 10.8 10.8 1.3 8.3 4.0 12.0 unscathed by inflation. The Bank of Japan’s controversial easing policy amid Fed tightening New 26 34.1 28.1 28.1 17.2 21.4 21.4 3.0 7.3 2.6 25.7 may be vindicated if the US dollar continues to Zealand weaken in 2023. The potential for yen recovery, China 1800 9.6 8.4 8.4 14.6 14.2 14.2 1.2 10.8 2.5 10.2 with relatively stable policy and growth, may Korea 747 10.7 8.8 18.9 -11.1 28.2 16.4 0.9 9.4 2.4 12.9 draw more investor inflows to Japanese equities. Taiwan 919 12.9 11.0 11.0 -13.0 16.8 16.8 2.1 19.0 4.0 21.6 Elsewhere in Asia-Pacific, countries more india 927 22.2 18.9 8.8 18.9 16.4 28.2 3.6 14.0 1.3 38.8 exposed to the global cycle may still feel Thailand 132 17.4 15.5 15.5 12.9 12.2 12.2 2.0 10.1 2.6 17.2 pressure, such as Korea, Taiwan and Australia, indonesia 126 13.9 13.0 13.0 5.3 6.6 6.6 2.5 17.4 3.2 21.1 where earnings are expected to fall in 2023. Malaysia 97 13.4 12.6 12.6 11.4 6.2 6.2 1.4 9.6 3.9 14.0 Indonesia’s commodity advantage may also fade in 2023. Others in Southeast Asia like Philippines 48 14.2 12.5 12.5 17.0 13.7 13.7 1.7 10.3 2.0 19.2 Thailand and Singapore may do well amid broader re-opening. Source: Citi Research, Worldscope, MSCI, FactSet, data as of 25 Nov 2022. Indices are unmanaged. An investor cannot invest directly in an index. They are shown for illustrative purposes only and do not represent the performance of any specific investment. Past performance is no guarantee As Asia continues relaxing COVID restrictions, of future results. Real results may vary. All forecasts are expressions of opinion, are subject to change without notice and are not intended to be we favor re-opening beneficiaries in consumer, a guarantee of future events. e-commerce, pharma and medical tech. Longer Note: The above data are compiled based on companies in MSCI AC World Index. The market capitalization for regions, markets and sectors are term, as US-China rivalry persists, we expect a free-float adjusted. P/E, EPS Growth, P/B, Dividend Yield and ROE are aggregated from FactSet consensus estimate (calendarized to December year drive toward building more domestic production end) with current prices. CAPE is calculated by current price divided by 10-year average EPS based on MSCI index-level data. NM = Not Meaningful; capacity as well as those in friendly markets. NA = Not Available. This is likely to shift the investor mindset from focusing on companies that enable consumption to those that facilitate production, likely boosting industries like sustainable energy, telecom, core technologies and select infrastructure.
 Citi Wealth Outlook 2023 Page 84 Page 86