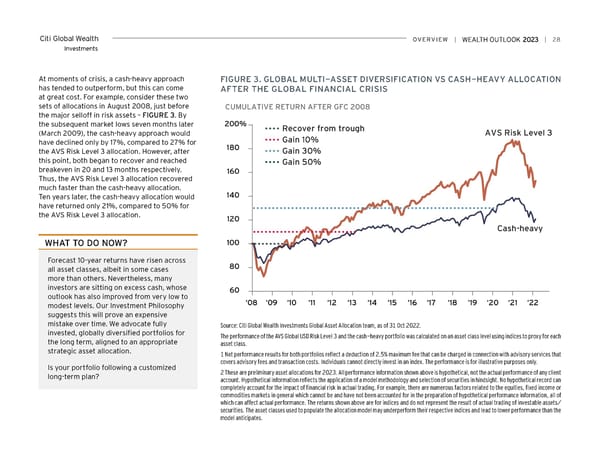
Citi Global Wealth overview | | 28 Investments At moments of crisis, a cash-heavy approach FiGUre 3. GLoBAL MULTi-ASSeT DiverSiFiCATioN vS CASH-HeAvY ALLoCATioN has tended to outperform, but this can come AFTer THe GLoBAL FiNANCiAL CriSiS at great cost. For example, consider these two sets of allocations in August 2008, just before CUMULATIVE RETURN AFTER GFC 2008 the major selloff in risk assets – FIGURE 3. By the subsequent market lows seven months later 200% Recover from trough (March 2009), the cash-heavy approach would AVS Risk Level 3 have declined only by 17%, compared to 27% for Gain 10% the AVS Risk Level 3 allocation. However, after 180 Gain 30% this point, both began to recover and reached Gain 50% breakeven in 20 and 13 months respectively. 160 Thus, the AVS Risk Level 3 allocation recovered much faster than the cash-heavy allocation. Ten years later, the cash-heavy allocation would 140 have returned only 21%, compared to 50% for the AVS Risk Level 3 allocation. 120 Cash-heavy wHAT To Do Now? 100 Forecast 10-year returns have risen across 80 all asset classes, albeit in some cases more than others. Nevertheless, many investors are sitting on excess cash, whose 60 outlook has also improved from very low to modest levels. Our Investment Philosophy ‘08 ‘09 ‘10 ‘11 ‘12 ‘13 ‘14 ‘15 ‘16 ‘17 ‘18 ‘19 ‘20 ‘21 ‘22 suggests this will prove an expensive mistake over time. We advocate fully Source: Citi Global Wealth Investments Global Asset Allocation team, as of 31 Oct 2022. invested, globally diversified portfolios for The performance of the AVS Global USD Risk Level 3 and the cash-heavy portfolio was calculated on an asset class level using indices to proxy for each the long term, aligned to an appropriate asset class. strategic asset allocation. 1 Net performance results for both portfolios reflect a deduction of 2.5% maximum fee that can be charged in connection with advisory services that Is your portfolio following a customized covers advisory fees and transaction costs. Individuals cannot directly invest in an index. The performance is for illustrative purposes only. long-term plan? 2 These are preliminary asset allocations for 2023. All performance information shown above is hypothetical, not the actual performance of any client account. Hypothetical information reflects the application of a model methodology and selection of securities in hindsight. No hypothetical record can completely account for the impact of financial risk in actual trading. For example, there are numerous factors related to the equities, fixed income or commodities markets in general which cannot be and have not been accounted for in the preparation of hypothetical performance information, all of which can affect actual performance. The returns shown above are for indices and do not represent the result of actual trading of investable assets/ securities. The asset classes used to populate the allocation model may underperform their respective indices and lead to lower performance than the model anticipates.
 Citi Wealth Outlook 2023 Page 27 Page 29