Deutsche Bank Non Financial Report
This annual Non-Financial Report 2022, which covers the reporting period from January 1, 2022, to December 31, 2022, communicates Deutsche Bank’s group-wide management approaches for a set of non-financial topics, major activities, and the related progress made in 2022. It also describes Deutsche Bank’s governance, policies, and set-up for these topics.
Deutsche Bank Non-Financial Report
Contents 3 Letter from the Chief Executive O昀케cer 5 Letter from the Chairman of the Supervisory Board 6 Introduction 7 About Deutsche Bank 8 About this report 9 Materiality assessment 11 Transition toward a sustainable and climate-neutral economy 13 Sustainability strategy and implementation 17 Sustainable 昀椀nance 38 Climate risk 52 Environmental and social due diligence 57 Human rights 107 Employees and corporate social 61 In-house ecology responsibility 69 Governance and operations 109 Employment and employability 71 Corporate governance 120 Corporate social responsibility 75 Stakeholder engagement and thought leadership 124 Art, culture and sports 78 Culture, integrity and conduct 125 Appendix 81 Public policy and regulation 126 Reports of the independent auditor 85 Anti-昀椀nancial crime 131 ESG-related goals 89 Tax 132 GRI Content Index and UN Global Compact 91 Data protection 148 Sustainability Accounting Standards Board (SASB) 93 Product responsibility Index 96 Client satisfaction 151 Recommendations of the Task Force on 100 Technology, data and innovation Climate-related Financial Disclosures (TCFD) 102 Digitization and innovation 153 Principles for Responsible Banking 105 Information security 172 Imprint/Publications
Letter from the Chief Executive O昀케cer Letter from the Chairman of the Supervisory Board
Dear Readers, The Russian war of aggression in Ukraine, the energy crisis and the rapid rise in inflation have dominated the year 2022. All of these developments have once again made us aware of the wide range of risks we are exposed to – as an economy and society as a whole, but also each company individually. For us at Deutsche Bank, robust and comprehensive risk management is a cornerstone of our business. This has long since encompassed more than credit, market and other financial risks. Non-financial risks have become an integral part of our risk management. If we do not systematically address the threats posed by climate change or increasing financial crime, we are putting the very basis of our business at risk. It is essential that we do everything in our power to further tighten our controls. This is also a key element in living up to our claim to be at the center of society. It is equally essential that we engage with the communities in which we operate, and that we promote diversity, equity and inclusion inside and outside the bank. We want to be a bank that contributes to a greener (E), more socially responsible (S) and better managed (G) economy, and that is more committed than ever to the Ten Principles of the UN Global Compact. I am delighted that in 2022 we once again made great progress in all these areas. To tackle climate change and enable our economy to transform, we have set ourselves concrete targets in the area of sustainability. At the beginning of 2020, we expected to reach € 200 billion in sustainable finance and investments in six years. By the end of 2022, we already achieved € 215 billion, excluding DWS. The fact that we reached our goal in only half the time clearly demonstrates how our businesses prioritize ESG considerations and have made it an integral part of their strategy. We have now set a new goal; to achieve a sustainable business volume of € 500 billion by 2025 for the years 2020 to 2025. This is an ambitious goal given that the criteria for measuring sustainability continue to evolve. Our regulators are driving this development, but we, too, strive for criteria that are as impact-oriented and transparent as possible, and we are continually improving here. We have continued to develop in all areas of our sustainability strategy, with a focus on implementation. Having moved our Sustainability unit out of the Communications department in 2021, we created a new standalone Chief Sustainability Office in 2022 with new areas of strategy and implementation, appointing Jörg Eigendorf as Chief Sustainability Officer, reporting directly to me. At the same time, we further strengthened Group Sustainability, which, as part of the Chief Sustainability Office, primarily comprises policies and controls. This further sharpened focus means that we can develop and implement our strategy even faster; we demonstrated our progress at our second Sustainability Deep Dive in March this year. Our roadmap to a climate-neutral banking business is key here. As a founding member of the Net-Zero Banking Alliance, in March 2022, for the first time, we fulfilled our voluntary commitment by publishing the carbon footprint of our corporate loan portfolio, which comprises around a quarter of our total loan book. In October 2022, we defined target paths for the four most energy-intensive sectors – oil and gas (upstream); power generation; automotives (light vehicles); steel – with interim targets for 2030. By gradually integrating CO considerations into 2 our decision-making processes, we can actively steer our progress here. Our goal is to make our credit portfolio climate- neutral by 2050. At the same time, we believe that we have a responsibility to support our clients on this transition and that this is the right approach with regard to the global climate. We would only consider ending a client relationship as a last resort if we fail to agree on a common approach to fighting climate change. It does not help anyone if we as a bank reduce our own carbon footprint but fail to make the world any cleaner as a result. There is more progress to report. This includes the fact that, since mid-2022, in order to continue doing business with us, our suppliers with an annual contract volume of more than € 500,000 are required to have an ESG rating. By doing so, we are designing our entire value chain according to strict environmental and social criteria – with a focus on human rights. Accordingly, we have implemented all obligations under the German Supply Chain Due Diligence Act on time and will continue to do so consistently. As a bank with a global network, we are aware of our responsibility for fighting financial crime on the front lines. That is why we have stepped up our commitment to anti-financial crime by focusing more people on these issues, improving processes and establishing external partnerships. In 2022, for example, we increased our Anti-Financial Crime department by more than 340 to over 1,900 employees, and in mid-2022 Management Board member Stefan Simon took over as a member of the Board of the Anti-Financial Crime Alliance (AFCA). 3
However, this alone is not enough. To entrench a strong risk culture, Deutsche Bank encourages everyone to speak out when something doesn't seem right. This “Speak-Up Culture” is what we expect. Another important aspect of a strong risk culture is that our bank can meet the requirement to record business-related communications. As such, our employees are only permitted to use approved communication channels, and Deutsche Bank has further strengthened its processes and controls here. Although we understand we have work to do to deliver our controls remediation program and adapt it to increasing regulatory requirements, the progress so far across all elements has made our bank safer. We also see the value of our investments in exceptional times. Strong controls and good corporate governance have contributed to our ability to adapt to evolving sanctions and help clients deal with key market challenges. Our bank is represented in 58 countries and home to 157 nationalities. Actively promoting diversity, equity and inclusion remains a priority and we continue to equip our people to fulfill this. We have made our goal of improving gender balance transparent, especially at our most senior management levels, and continue to make progress towards our 2025 targets. In the Human Rights Campaign's annual Corporate Equality Index, we received the highest score of 100 for 19 consecutive years. In order to further embed diversity, equity and inclusion in the bank’s culture, we rely on our managers; they must lead diverse teams, behave inclusively and support their employees in their careers. To support our leaders, we have created our Leadership Kompass, a set of eight behaviors that we expect from all of our leaders. These include sustainable business practices, the development and well-being of our employees, and the way we put clients and employees at the heart of all decisions, in line with our values and beliefs. When it comes to social responsibility, our bank has a long and impressive history. This is deeply rooted in our culture, even and especially in difficult times. In response to the humanitarian plight of refugees from Ukraine, Deutsche Bank donated € 1 million in 2022. Our employees donated a further € 500,000+ and many were involved in Ukraine aid projects. With the launch of the How We Live environmental projects in 2022, the bank is aligning its social responsibility strategy even more closely with its ESG objectives. These projects contribute towards the protection and regeneration of nature worldwide. We are also proud to report that, by the end of 2022, more than 1,000 of our employees in Germany had registered for the financial education project “So geht Geld”, which provides students with practical financial knowledge. This is far beyond our goal of recruiting 700 colleagues for the project by the end of the reporting year. In total, we invested more than € 55 million as part of our social commitment as well as in art, culture and sports projects. More than 3 million people worldwide benefited from this. In addition, more than 18,700 employees volunteered on our social projects giving a total of almost 190,000 hours. This commitment is remarkable. It underpins that we are at the heart of society and act responsibly. Progress on all of our non-financial targets is only possible if we are successful in business. We were able to meet this requirement in 2022 and achieved the best result in 15 years. We can look to the future with confidence; our bank is once again sustainably profitable. It is more efficient and has four strong, mutually-reinforcing, well-balanced business divisions. Our clients, our shareholders and our employees play a significant role in this success. Our special thanks therefore go to them. Yours sincerely, Christian Sewing 4
Dear Readers, With its 2019 transformation, Deutsche Bank adopted a clear strategy and substantially improved its financial results. This transformation, which the Supervisory Board has continuously supported, has been successfully executed. As a result of the realignment, the bank has regained credibility and confidence, as I learned from numerous discussions with clients, employees, investors, supervisors and politicians since I took office. To be successful in the long term it is not just the results that need to be right: the bank must meet its needs and those of all relevant stakeholders for important non-financial factors. This is why the Supervisory Board has been working intensively last year on the topics raised in this report. Our focus has been on strengthening corporate governance through further reinforced controls and processes, supporting the transition to a more sustainable economy, and promoting the use of technology. In particular, effective controls and processes are essential for a global financial institution. By meeting regulatory requirements and making a significant contribution to the fight against financial crime, we will strengthen our resilience. At the same time, this is the basis for the social acceptance of our bank. Deutsche Bank has made significant remediation progress in recent years, but does not meet all of its own and its regulators’ expectations in certain areas yet. That is why, in July last year, we refocused the existing Integrity Committee. As a Regulatory Oversight Committee, it oversees the Management Board’s actions with regard to complying with legislation, administrative regulations and internal policies. The committee also supports the Supervisory Board in monitoring the litigation cases which are most relevant from a risk perspective. In addition, the Committee regularly reviews the bank’s codes of ethics and conduct to encourage exemplary behavior by our employees in every respect, in addition to their legal obligations. It also remains a key objective for the bank to promote diversity and inclusion. We also attach great importance to this principle in the composition of the Supervisory Board and the Management Board. Sustainable action and thinking are an integral part of Deutsche Bank’s strategy. Consequently, the task of advising the Management Board on environmental (E), social responsibility (S) and corporate governance (G) matters has been transferred from the former Integrity Committee to the Strategy and Sustainability Committee, while the related financial and non-financial risks are supervised by the Risk Committee. Sustainability is a top priority for the Supervisory Board. As a Global Hausbank, we support the transition to a sustainable and climate-neutral economy by enabling sustainable financing and investments and providing advice and support to clients in their transformation. In 2022, the Management Board also reported regularly on the bank’s progress in implementing the bank’s sustainability strategy. In addition to the path to a sustainable economy, technological innovations will shape banking in the years to come. Our goal is to make the best use of artificial intelligence, machine learning and data to serve our clients. In addition to effective data management and cloud transformation, security in 2022 was the defining topic in the Committee on Technology, Data and Integration. The impact of the war in Ukraine on our cyber and information security was discussed regularly. A more detailed report on the work of the Supervisory Board on these and other issues can be found in Deutsche Bank’s Annual Report. In recent years, Deutsche Bank has fundamentally transformed its business model. It is once again profitable and has re- connected closely to society and its stakeholders. We will continue along this path and the Supervisory Board will continue to support the Management Board in implementing its strategy, strengthening controls and fulfilling Deutsche Bank’s social responsibilities. Yours, Alexander Wynaendts Chairman of the Supervisory Board Deutsche Bank AG 5
Introduction 7 About Deutsche Bank 8 About this report 9 Materiality assessment

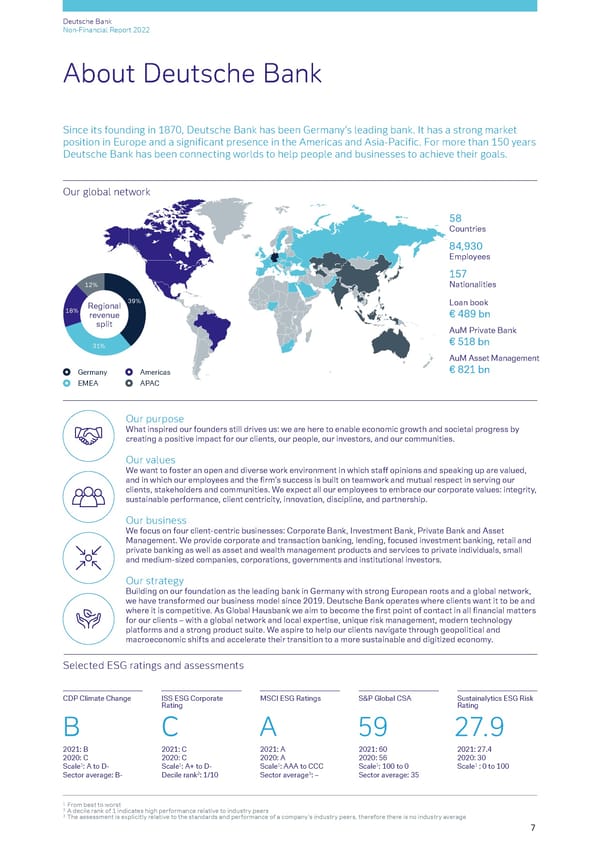
Deutsche Bank Non-Financial Report 2022 About Deutsche Bank Since its founding in 1870, Deutsche Bank has been Germany’s leading bank. It has a strong market position in Europe and a signi昀椀cant presence in the Americas and Asia-Paci昀椀c. For more than 150 years Deutsche Bank has been connecting worlds to help people and businesses to achieve their goals. Our global network 58 Countries 84,930 Employees 157 12% Nationalities Regional 39% Loan book 18% revenue € 489 bn split AuM Private Bank 31% € 518 bn AuM Asset Management Germany Americas € 821 bn EMEA APAC Our purpose What inspired our founders still drives us: we are here to enable economic growth and societal progress by creating a positive impact for our clients, our people, our investors, and our communities. Our values We want to foster an open and diverse work environment in which sta昀昀 opinions and speaking up are valued, and in which our employees and the 昀椀rm’s success is built on teamwork and mutual respect in serving our clients, stakeholders and communities. We expect all our employees to embrace our corporate values: integrity, sustainable performance, client centricity, innovation, discipline, and partnership. Our business We focus on four client-centric businesses: Corporate Bank, Investment Bank, Private Bank and Asset Management. We provide corporate and transaction banking, lending, focused investment banking, retail and private banking as well as asset and wealth management products and services to private individuals, small and medium-sized companies, corporations, governments and institutional investors. Our strategy Building on our foundation as the leading bank in Germany with strong European roots and a global network, we have transformed our business model since 2019. Deutsche Bank operates where clients want it to be and where it is competitive. As Global Hausbank we aim to become the 昀椀rst point of contact in all 昀椀nancial matters for our clients – with a global network and local expertise, unique risk management, modern technology platforms and a strong product suite. We aspire to help our clients navigate through geopolitical and macroeconomic shifts and accelerate their transition to a more sustainable and digitized economy. Selected ESG ratings and assessments CDP Climate Change ISS ESG Corporate MSCI ESG Ratings S&P Global CSA Sustainalytics ESG Risk Rating Rating B C A 59 27.9 2021: B 2021: C 2021: A 2021: 60 2021: 27.4 2020: C 2020: C 2020: A 2020: 56 2020: 30 1 1 1 1 1 Scale : A to D- Scale : A+ to D- Scale : AAA to CCC Scale : 100 to 0 Scale : 0 to 100 Sector average: B- Decile rank2: 1/10 Sector average3: – Sector average: 35 1 From best to worst 2 A decile rank of 1 indicates high performance relative to industry peers 3 The assessment is explicitly relative to the standards and performance of a company’s industry peers, therefore there is no industry average 7
Deutsche Bank Introduction Non-Financial Report 2022 About this report About this report GRI 2-3 This annual Non-Financial Report 2022, which covers the reporting period from January 1, 2022, to December 31, 2022, communicates Deutsche Bank’s group-wide management approaches for a set of non-financial topics, major activities, and the related progress made in 2022. It also describes Deutsche Bank’s governance, policies, and set-up for these topics. Content within the report marked by a line in the margin corresponds to the mandatory “Non-Financial Statement” within the meaning of Section 315b German Commercial Code (Handelsgesetzbuch, HGB). The “Non-Financial Statement” complies with Section 315c (1) HGB in conjunction with Section 289c HGB. The mandatory description of the business model to which this report refers is found in the Annual Report – Combined Management Report – Operating and Financial Review – Deutsche Bank Group. This section of the Annual Report and the Non-Financial Report are prepared in accordance with the Global Reporting Initiative (GRI) Sustainability Reporting Standards. References to show compliance with GRI Standards are indicated in the respective chapter and/or sub-chapter heading. In addition, a GRI table is published in the Appendix. Certain information required by GRI 207 Tax is part of the Country-By-Country Reporting in the Notes to the Annual Report of Deutsche Bank Group to which this report refers. Furthermore, the “Non-Financial Statement” complies with the disclosure obligations under Article 8 (1) and (3) of the Taxonomy Regulation and the respective specifications in Articles 4 and 10 (2) of the associated Delegated Act. The Non-Financial Report 2022 is subject to a limited assurance engagement as seen in the Reports of the Independent Auditor. Disclosures for prior years and references to additional information beyond the scope of the Non-Financial Report (for example, external websites) are not subject to the limited assurance procedures for the 2022 reporting period. References to websites or other publications of Deutsche Bank are not subject to independent verification and are indicated by an asterisk (*). The Non-Financial Report 2022 uses reporting metrics of the Sustainability Accounting Standards Board (SASB) Standards and includes a table that indicates which of its chapters and sub-chapters contain disclosures recommended by the Task Force on Climate-related Financial Disclosures (TCFD). The report discusses the topics required for Deutsche Bank’s communication on progress for the UN Global Compact (see GRI Content Index and UN Global Compact in the Appendix). 8

Deutsche Bank Introduction Non-Financial Report 2022 Materiality assessment Materiality assessment GRI 2-12, 3-1/3 The Non-Financial Report discloses material non-financial information for Deutsche Bank and its stakeholders, determined through the bank’s materiality assessment. The assessment, which is based on GRI standards, considers external stakeholder expectations and internal perception of the business relevance of non-financial topics. To ensure that the bank’s reporting conforms with the German Commercial Code, Deutsche Bank supplements its assessment by prioritizing topics based on its relevance to understand the bank’s current or future development, financial position, performance, or cash flows in accordance with Section 315c (2) HGB. The materiality assessment performed in 2021 served as the basis for the material topics in this Non-Financial Report. In 2022, Deutsche Bank focused on reviewing its materiality process and the approach of incorporating impacts of the bank’s business activities and operations more specifically. This was agreed upon by the bank’s ESG Disclosures Steering Group. The steering group is composed of experts from: Finance, Investor Relations, Risk, Communications and Chief Sustainability Office. As of year end 2022, Deutsche Bank did not identify any business activities, relationships, products, or services that would be associated with potentially significant risks that were very likely to have or will in future have a severe negative impact on the material non-financial topics. 9
Deutsche Bank Introduction Non-Financial Report 2022 Materiality assessment Material non-financial topics 2022 GRI 3-1/2 The results of the materiality assessment are shown in the matrix below. The topics in the top right grey area of the matrix meet the materiality requirements of Section 315c in conjunction with Section 289c (3) HGB and form Deutsche Bank’s “Non- Financial Statement”. Throughout the report, each material topic of the “Non-Financial Statement” is marked by a line in the margin. All non-financial topics shown in the matrix below are relevant to Deutsche Bank and its stakeholders and managed across the bank to ensure its ability to generate value. The topics marked blue are covered by the bank’s sustainability strategy. 10
Transition toward a sustainable and climate-neutral economy 13 Sustainability strategy and implementation 17 Sustainable 昀椀nance 38 Climate risk 52 Environmental and social due diligence 57 Human rights 61 In-house ecology
Deutsche Bank Non-Financial Report 2022 Transition toward a sustainable and climate-neutral economy at a glance k n C a o Deutsche Bank supports the transition toward a B nt rp e or sustainable and climate-friendly economy m a t te s B e nv a I n k Exceeding the € 200 billion target in sustainable 昀椀nancing and investments between 2020 and year end 2022 with a cumulative total of € 215 billion Deutsche Bank aligns the carbon intensity of its sA kn s lending portfolio to Paris Agreement‘s targets aB te et aM avi an rP meg tne Founding member of the Net Zero Banking Alliance and Net Zero Asset Managers initiatives Facts and 昀椀gures 2022 € 215billion By 2025 Zero sustainable 昀椀nancing reached end 昀椀nancing of 昀椀nancing of new oil and gas by the end of 2022 thermal coal mining projects in the Arctic, as well as new oil sand projects Sustainable 昀椀nance progress since 2020 Progress in GHG emissions and energy onsumption reduction in own operations and c business travel 2022 2,601,837 2020 2,397,381 Assets under Management 2,078,060 € 46 € 1 bn bn € 58 bn Financing 132,927 2021 € 30 bn 72,897 74,300 € 112 Issuance bn € 27 bn 2020 2021 2022 2020 2021 2022 Total GHG emissions Total energy consumption (in t of CO2e) (in GJ) 12
Deutsche Bank Transition toward a sustainable and climate-neutral economy Non-Financial Report 2022 Sustainability strategy and implementation Sustainability strategy and implementation – Sustainability embedded in corporate strategy – Adapted governance to ensure effective implementation of sustainability strategy – Establishment of Chief Sustainability Office Economies and societies worldwide are striving to become sustainable and socially inclusive. A vital aspect of this is tackling climate change which is one of humanity’s biggest challenges. Negative spillovers from the war in Ukraine as well as disruptions of supply chains, including energy supply shortages, could have the potential to fast-track Europe’s goals of carbon footprint reduction and energy independence by accelerating the transformation towards renewable energies (refer e.g. to REPowerEU initiative). Being a global financial institution with a loan book of € 489 billion and assets under management of € 1.3 trillion, Deutsche Bank believes that it is part of its responsibility to support and where possible, accelerate this historic transformation towards a more sustainable society and economy. This transformation affects the bank’s relationship with all its stakeholders. Clients need advice, products, and services to make progress on their transformation journeys. Investors increasingly want to entrust their capital to companies with a credible sustainability strategy. Following clear guidance for sustainability is also one cornerstone of attracting people who expect their employer to act decisively and to be purpose driven. Finally, society values businesses that act as responsible corporate citizens. While the transition towards a sustainable society and economy requires huge investments, sustainability goes beyond pure business. Deutsche Bank has seen sustainability as an opportunity for many years. Consequently sustainability, which encompasses environmental, social and governance (ESG) aspects, is a central component of the “Global Hausbank” strategy. In 2022, the bank continued to embed sustainability into its products, policies and processes, focusing on the following four pillars: Sustainable Finance, Policies & Commitments, People & Own Operations as well as Thought Leadership & Stakeholder Engagement. Making progress along these four pillars is aimed to enable the bank to maximize its contribution to the achievement of the Paris Climate Agreement’s targets and the United Nations (UN) Sustainable Development Goals. Although the bank strives to contribute indirectly to all 17 UN Sustainable Development Goals, as part of its sustainability strategy the focus is in particular on the sustainability targets shown below, which are particularly close to its business activity. Sustainability strategy To underpin its long-standing commitment to sustainability, Deutsche Bank formally endorsed universal sustainability frameworks and initiatives. The bank is a member of the UN’s Environment Programme Finance Initiative (1992) and signatory to the ten principles of the UN Global Compact (2000), the Principles for Responsible Investment (through DWS, 2008), the Principles for Responsible Banking (2019) and the Net-Zero Banking Alliance (2021). This chapter does not cover DWS which sets its own sustainability strategy. For details regarding DWS’ sustainability strategy please refer to the “Sustainable finance/Asset Management” chapter in this report. 13
Deutsche Bank Transition toward a sustainable and climate-neutral economy Non-Financial Report 2022 Sustainability strategy and implementation Sustainability targets To implement the Group’s sustainability strategy, Deutsche Bank has set the following sustainability targets to: – Achieve cumulative sustainable financing and investment volumes since January 2020 of over € 200 billion by the end of 2022 and a cumulative € 500 billion by the end of 2025 (excluding DWS) – Fulfill Deutsche Bank’s net-zero commitments for key carbon intensive sectors by accompanying clients in their transformation (Transition Dialogue) – Strengthen policies and controls to guide the bank’s actions and ensure compliance – Sourcing of external ESG data, automation, and standardization of reporting – Empower employees and establish sustainability as core value of the bank’s culture Achievements In 2022, the bank continued to deliver on its sustainability strategy. Key achievements along the four pillars are: Sustainable Finance Deutsche Bank has achieved a cumulative sustainable financing and investments volume of € 215 billion in 2022 (excluding DWS), thus outperforming its target of at least € 200 billion within three years. All business areas (excluding DWS) contributed to Deutsche Bank meeting this target. When this target was first announced in May 2020, it was planned to be achieved by the end of 2025. Policies & Commitments Deutsche Bank published the carbon footprint of its corporate loan exposure to, and financed emissions of, key carbon- intensive industries as well as quantitative 2030 (interim) and 2050 decarbonization targets for four carbon intensive sectors in the Group’s corporate lending book on its website. These targets cover the sectors of Oil and Gas (upstream), Power Generation, Automotive (light duty vehicles) and Steel and aim to significantly reduce the amount of financed emissions (Scope 3) by 2030, reflecting the bank’s commitments as a founding member of the Net-Zero Banking Alliance (NZBA) (for further details see the “Climate risk” chapter). To achieve this target, Deutsche Bank has founded a Net-Zero Forum with participation of the businesses as well as Risk and the Chief Sustainability Office. In addition, Deutsche Bank joined the EP100 initiative, committing to net-zero operational carbon at owned occupied assets globally by 2030 and the RE100 initiative under The Climate Group, committing to 100% of renewable energy used for own operations by the end of 2025. People & Own Operations The bank received 95.7% of its own global electricity consumption from renewable sources, exceeding its 2022 target by 10.7%. Further achievements include the reduction of total energy consumption by 13.3% year-to-year. For its new building at Columbus Circle in New York, Deutsche Bank received the Leadership in Energy and Environmental Design (LEED) Gold certification. Moreover, in December 2022, a new “Sustainability Hub” went live internally as single point to go to for ESG activities in Deutsche Bank. The bank also launched “How we live”, the Group’s new Corporate Social Responsibility program for environmental impact, aiming to address nature conservation and environmental protection as well as related social issues in collaboration with environmental and non-profit organizations. Thought Leadership & Stakeholder Engagement As part of their cooperation, Deutsche Bank and the European School of Management and Technology (ESMT) in Berlin announced the new endowed professorship for Sustainable Finance. Prof. Dr. Jörg Rocholl has taken over the chair as of September 1, 2022. From February 28 to March 2, 2022, Deutsche Bank hosted the second Annual dbAccess Global ESG Conference. Over 60 companies participated, as well as a number of focused presentations and panels were held. The conference was intended to be an engagement forum for all companies to address relevant environmental, social and governance considerations that are important to stakeholders. 14
Deutsche Bank Transition toward a sustainable and climate-neutral economy Non-Financial Report 2022 Sustainability strategy and implementation Sustainability governance GRI 2-9/12/13/17 In 2022, Deutsche Bank further enhanced its sustainability governance. This helps to manage, measure and control sustainability activities across divisions and regions and allows for compliance with relevant environmental and social regulations. Deutsche Bank appointed a Chief Sustainability Officer and broadened its sustainability governance by establishing a Sustainability Strategy Steering Committee responsible for sustainability transformation management and oversight. The Chief Sustainability Officer reports to the Chief Executive Officer. He has the mandate to develop the bank’s sustainability strategy and advance its implementation. He also coordinates the work of the Group Sustainability Committee as Vice Chairman of the CEO, the Sustainability Strategy Steering Committee as Chairman, and the Sustainability Council as Co- Chairman. Besides, he reports progress to the Management Board and Supervisory Board. The bank supplemented its existing Group Sustainability team with a dedicated Strategy & Regional Governance team, responsible for the development of the corporate sustainability strategy, as well as an Execution, Data & Regulatory team, responsible for managing the transformation at a day-to-day basis as well as the identification and assessment of relevant regulations. All these three teams form the Deutsche Bank’s new Chief Sustainability Office. Group Sustainability retains its responsibility for advancing the bank’s sustainability framework, overseeing adherence to group-wide sustainability policies and commitments, and providing transparency to the bank’s stakeholders. In addition to the Chief Sustainability Office, the bank’s business divisions and infrastructure functions each have their own ESG experts to ensure a swift response to business opportunities and potential risks. The bank has three fora entirely devoted to sustainability. The most senior forum is the Group Sustainability Committee, which was created in 2020 and acts as the main governance body for sustainability related matters across Deutsche Bank Group. The Management Board has delegated sustainability related decisions to this committee, which is chaired by the Chief Executive Officer and the Chief Sustainability Officer (Vice Chair). It consists of Management Board members and the heads of the bank’s business divisions (GMC members) as well as senior representatives of the relevant infrastructure functions. The committee acts as senior decision-making body for sustainability-related matters on group level. Its “run the bank”- mandate has oversight of sustainability strategy implementation across divisions and ensures alignment of the sustainability strategy with the client centric pillar of the bank’s corporate strategy. 15
Deutsche Bank Transition toward a sustainable and climate-neutral economy Non-Financial Report 2022 Sustainability strategy and implementation The Group Sustainability Committee met five times in 2022. Topics that were discussed among others were sustainability strategy, financed emissions and carbon disclosure. The second forum is the new Sustainability Strategy Steering Committee. It is chaired by the Chief Sustainability Officer, Vice- Chair is the Chief Financial Officer Investment Bank, Corporate Bank & ESG. The Sustainability Strategy Steering Committee meets on a monthly basis and consists of divisional and regional ESG specialists of the business divisions and certain infrastructure functions. Created in September 2022, the Sustainability Strategy Steering Committee met three times in 2022. It has been delegated by the CEO and is responsible for overseeing the implementation of the sustainability strategy as one of the bank’s “Key Deliverables” (“change the bank”-responsibility). The members of the committee collaborate across organizational boundaries. The "Key Deliverable Sustainability Strategy" is implemented in working groups that work on these goals: – Business Coordination, Enablement & Investment: aligns Deutsche Bank Group’s sustainability strategy with business strategies and incubates cross-divisional business opportunities – ESG Financing: conceptualizes and implements the Asset and Liability Management in the ESG space – Empowerment & Training: ensures the alignment and training of staff worldwide – Data & Technology: builds the data foundation to support reporting such as disclosures in accordance with Article 8 of the Taxonomy Regulation or Pillar 3 disclosures on ESG risks as well as climate risk related disclosures and business needs for ESG data – ESG Regulations: develops a comprehensive overview of current and upcoming regulations linked to sustainability and oversees implementation by affected business divisions and infrastructure functions – Risk, Governance & Controls: designs the sustainability control framework and oversees its implementation – Net-Zero Alignment Strategy: develops net-zero targets and client transition dialogue approaches in close collaboration of Risk, business divisions and Chief Sustainability Officer – German Supply Chain Due Diligence Act: ensures compliance with German Supply Chain Due Diligence Act by establishing risk management and due diligence processes to prevent and remediate human rights adverse impacts in Deutsche Bank’s operations and upstream supply chain All of these work streams have charters, measurable targets and detailed implementation plans, which are centrally tracked and supervised by the Sustainability Strategy Steering Committee. Escalations are reported into the Group Operating Committee, which is responsible to most effectively support the delivery of the bank’s strategy. Besides this, the program progress is as well reported to the Group Sustainability Committee on a regular basis. Deutsche Bank achieved all key deliverable milestones set by year end 2022. The third forum is the Sustainability Council, which Deutsche Bank formed in 2018. The Sustainability Council’s mandate is to foster knowledge exchange in the bank, in order to stimulate bank-wide change and to identify new topics. The council is co-chaired by the Chief Sustainability Officer and the Chief Financial Officer Investment Bank, Corporate Bank & ESG. The council met four times in 2022, discussing new internal developments, business highlights, and market trends. The Supervisory Board as well as the Management Board have been explicitly informed about the implementation of the sustainability strategy. In 2022, the Supervisory Board has been informed and involved twice, the Management Board three times. Other committees, such as the Group Reputational Risk Committee and the Enterprise Risk Committee, are informed about current sustainability issues and developments on a regular basis. To ensure that climate and environmental risks are considered in strategic sustainability decisions and respective goals and action plans are achieved, the Chief Sustainability Office and the Chief Risk Office follow an integrated governance approach. For more details, see the “Climate Risk/Governance” chapter of this report. The degree to which ESG targets are met is among the assessment criteria used to calculate the bank’s top executives’ performance-based compensation. For additional details refer to “Compensation of the Management Board” in the Annual Report 2022 and the Compensation Report 2022. Sustainability principles and policies GRI FS1 Deutsche Bank’s sustainability principles are anchored in the bank’s Code of Conduct, which it expects all employees to adhere to. In 2022, the bank developed a dedicated Sustainable Finance Policy aimed at strengthening the bank’s internal processes around Sustainable Finance which supplements the Sustainable Finance Framework. Where appropriate, the policies of the business divisions and infrastructure functions address additional sustainability aspects, which are specific to their function. Deutsche Bank’s sustainability related targets and measures as well as the progress made in implementing the bank’s sustainability strategy in the 2022 are summarized in the table “ESG-related goals” in the Appendix. 16
Deutsche Bank Transition toward a sustainable and climate-neutral economy Non-Financial Report 2022 Sustainable finance Sustainable finance – Exceeding the € 200 billion target in sustainable financing and investments between 2020 and year end 2022 with a cumulative total of € 215 billion – Sustainable financing and investments of € 58 billion in 2022, despite a challenging macroeconomic environment – Target to achieve cumulative sustainable financing and investment volumes of € 500 billion since January 2020 to year end 2025 GRI 201-2 As a global bank, Deutsche Bank acknowledges its role in facilitating the transition toward sustainable growth and a low- carbon economy. As a financial intermediary, the bank aspires to support its clients in their transformation with its financial expertise and product offerings on their path to a more sustainable and climate-neutral way of conducting business. Thus, the bank supports the European Commission’s Action Plan on sustainable finance as a crucial contribution toward the European Union’s achievement of its Paris Agreement climate targets and its wider sustainability agenda. This is in line with Deutsche Bank having signed the Paris Pledge for Action in 2015. In May 2020, Deutsche Bank published its intention to achieve at least € 200 billion in sustainable financing and investments by year end 2025, as defined in the Group’s Sustainable Finance Framework (*). In order to achieve more tangible progress in the shorter term, the bank first announced the acceleration of this target from year end 2025 to year end 2023 and later to year end 2022. The bank exceeded its year end 2022 target in sustainable financing and investments with a cumulative total of € 215 billion and is committed to achieve cumulative sustainable financing and investment volumes of € 500 billion since 2020 to year end 2025. The ESG assets managed by the Asset Management division, which operates under the brand DWS, are not included in these figures as DWS operates as a separate legal entity that sets its own sustainability strategy. The graphic below shows the milestones in sustainable finance since May 2020 focusing on the achievements made in 2022. 17
Deutsche Bank Transition toward a sustainable and climate-neutral economy Non-Financial Report 2022 Sustainable finance Governance GRI 2-9/23/24, 3-3, FS1, FS3 Deutsche Bank’s Sustainable Finance Framework (*), established in 2020, outlines the methodology and associated procedures for classifying financial products and services offered by Deutsche Bank as sustainable financing and investments. The framework specifies the classification logic, the eligibility parameter criteria, the applicable environmental and social due diligence requirements, the verification and monitoring process and is complemented by other policies, providing additional information on specific topics. A robust framework for defining sustainable financing and investments is essential for target- setting, decision-making, enforcement and credibility with stakeholders. In the Corporate Bank and the Investment Bank, the validation against the framework is conducted on a deal-by-deal basis and according to a 6-eyes-principle. As a first step, coverage teams screen client’s sustainability profile and map transactions in scope against the framework. Initial due diligence prior to deal closing is conducted in cooperation with product teams and ESG product champions. After that, ESG product champions review the classification rationale, proof points and conduct plausibility checks. Finally, Group Sustainability performs its due diligence, reviewing the classification rationale, proof points and any additional information required. Only after successful completion of these validation steps, a deal can be classified as compliant with the Sustainable Finance Framework, and the transaction can be counted towards the sustainable finance target. The validation statistics for Corporate Bank and Investment Bank are presented in the following table. Transactions assessed under the Sustainable Finance Framework (Corporate Bank and Investment Bank) Dec 31, 2022 Dec 31, 2021 Number of transactions on which final decisions have been made 885 1,036 Thereof approved 719 979 Parameter 1 - Use of proceeds 471 605 Parameter 2 - Company profile 69 73 Parameter 3 - Sustainability linked products 179 301 Thereof declined 159 48 Thereof referred to the respective committees 7 9 Thereof approved 3 4 Thereof declined 4 5 To support the decision making of those conducting transactions and performing validation under the framework and as part of the bank’s overall sustainability governance, the Sustainable Finance Governance Forum was established in February 2021. The forum is chaired by the Chief Sustainability Officer. The forum's members are tasked with the interpretation and methods of applying the Sustainable Finance Framework's definitions and product classifications. For instance, the members’ view may be consulted regarding specific sustainable finance transactions as well as clients, general or product-specific sustainable finance criteria for selected activities or industries. If appropriate, the forum’s recommendations are submitted to either the Group Sustainability Committee or through the Reputational Risk Framework (for more information on the Group Sustainability Committee, see the chapter entitled “Sustainability strategy and implementation”). In the Private Bank, the “Sustainable Investment Classification Criteria Framework” was introduced in 2021. Based on Deutsche Bank’s Sustainable Finance Framework, it outlines the sustainable investment criteria to be considered within the process of discretionary portfolio management services and mandates, for mutual funds and exchange-traded funds, bonds and structured products. Based on the development of the regulatory environment, the framework was refined in 2022 taking into consideration sustainability criteria as defined under the amended Markets in Financial Instruments Directive (MiFID II). It will be further reviewed and updated on a regular basis to reflect the emerging regulations and related guidelines. Training and awareness GRI 2-12/24/29, 3-3, 404-2 Deutsche Bank aims to develop expertise across all its employees, in particular by building awareness and engagement. The bank believes it is vital that everyone understands the financial implications of ESG issues and is aware of the steps governments and regulators are taking to address these problems and how they will impact business and clients. The Chief Sustainability Office plays a key role in reinforcing the businesses’ awareness of the bank’s sustainability strategy. In 2022 front-office staff continued to receive live video-training to enable them to understand the Sustainable Finance Framework and to identify opportunities for clients to transition to more sustainable and low-carbon business models. In line with the target to offer training on the bank’s Sustainable Finance Framework to all of the relevant front-office staff in its divisions (Investment Bank, Corporate Bank and Private Bank) by the end of 2022, sustainable finance training has been integrated into the bank’s internal training platform “LearningHub”. In addition, the businesses set up the following division specific ESG training programs in 2022: 18
Deutsche Bank Transition toward a sustainable and climate-neutral economy Non-Financial Report 2022 Sustainable finance – Corporate Bank continued its program to ensure that its coverage and product teams are familiar with client and sector specific ESG knowledge; Corporate Bank also provided ESG case studies, deal alerts, newsletters, deep dives on individual topics, and other information on a regular basis – Investment Bank’s Fixed Income and Currencies continued a program of training for all product risk and client facing staff covering key aspects of ESG and sustainable finance, including Deutsche Bank’s ESG Ratings, Client Transition Dialogue, Equator Principles and Net Zero Alignment – Investment Bank’s Origination and Advisory continued to providing teaching and training of ESG topics to help facilitate client dialogue on investing, financing and net-zero; furthermore, Origination and Advisory regularly provided newsletters, deal alerts, case studies, and other information with the aim that the staff was kept up-to-date on evolving ESG topics and regulations – Private Bank Germany trained its employees via different formats to meet the sustainability preferences of its clients as well as the ESG specific requirements for its products and services; all investment advisors were required to conduct an ESG specific training as part of their annual qualification with respect to the regulatory requirements of an integrated advisory process compliant to Markets in Financial Instruments Directive II; furthermore, approximately 3,200 employees from different business areas participated in digital trainings focusing on sustainability; Private Bank Germany continued its offerings for all staff through digital workshops, net meetings and newsletters – International Private Bank continued its program for its product experts to be ESG certified extending the timeline to end 2023 to allow for changing guidelines to be reflected; until the end of 2022, more than 150 product experts have completed the Certified Environmental Social Governance Analyst examination and the majority of product experts are now certified ESG analysts; online introductory ESG training called “From Purpose to Impact” was made available to all of around 7,000 IPB’s staff end of 2021 with more than 77% of staff having completed the training to date; in addition, International Private Bank provided a tailor-made training to more than 2,000 Investment Managers to complement the implementation of sustainability preferences under MiFID II in 2022 and the focus of ESG in the client suitability processes – For Asset Management, ESG-related training was a core area of focus, offering a wide range of solutions, from online training to certification; as of December 31, 2022, DWS had 330 active employees who are Certified Environmental Social Governance Analyst certified; DWS also launched an ESG Educational Framework series open to all employees on ESG- related topics Disclosures in accordance with Article 8 of the Taxonomy Regulation GRI FS8 The EU Taxonomy Regulation is aimed to allocate funding to sustainable sectors and support the transition towards a sustainable economy, setting out the guidelines for economic activities which financial and non-financial undertakings can classify as sustainable. Deutsche Bank was among the first international banks to explicitly refer to the EU Taxonomy Regulation in its group-level sustainability policy. In particular, the bank considers the EU Taxonomy’s technical screening criteria for the classification of activities as environmentally sustainable and specifically those related to the climate change mitigation and adaptation objectives. As the overall understanding of environmental and social matters and the EU Taxonomy are evolving, these criteria may be modified. Similarly to “Do No Significant Harm” and “Minimum social safeguards” checks of client performance against environmental and social objectives required by the EU Taxonomy, Deutsche Bank already conducts reviews of clients’ overall management approach and performance towards environmental and social challenges common to the industries in which the client operates ahead of their implementation for the purpose of Taxonomy alignment reporting next year (for more information on these reviews, see the chapter “Environmental and Social Due Diligence”). To support sustainable activities of its clients and to facilitate their sustainability transition, the bank also offers and continuously develops different dedicated products as well as client engagement processes all of which seek to embed the Taxonomy-related considerations. At the same time, the bank intends to build up internal expertise and capabilities, e.g., by training the relevant business units on sustainable finance. In accordance with Article 8 of the EU Taxonomy Regulation and the related Climate Disclosures Delegated Act, starting from year end 2021, financial undertakings have to disclose the proportion of exposures to Taxonomy-eligible and Taxonomy non- eligible economic activities in their covered assets (i.e., total assets less exposures towards central governments, central banks, supranational issuers and the trading portfolio). Taxonomy eligibility indicates that an activity is in scope for screening under the EU Taxonomy Regulation. Eligible activities will be tested against the Technical Screening Criteria, starting 2023, in order to determine alignment with the Taxonomy. The clarification to use covered assets instead of total assets in the denominator of the eligibility ratios was issued in course of 2022. Prior period reporting was adjusted accordingly. 19
Deutsche Bank Transition toward a sustainable and climate-neutral economy Non-Financial Report 2022 Sustainable finance The identification of the taxonomy eligible economic activities is performed for in-scope counterparties and products defined in the Article 8 of the Taxonomy Regulation and the related Climate Disclosures Delegated Act. Where the use of proceeds is known at a transaction level, banks can consider relevant exposures to the extent the underlying transaction is financing a Taxonomy-eligible activity. For general purpose lending, banks can consider exposures weighted by capital expenditure and turnover key performance indicators provided or disclosed by their clients. Residential real estate loans against households collateralized by residential immovable property are also considered as Taxonomy-eligible. Deutsche Bank’s Taxonomy eligibility disclosure is based on the capital expenditure and turnover key performance indicators of its non-financial counterparties as well as Taxonomy eligibility key performance indicators of its financial counterparties and also includes residential real estate loans against households collateralized by residential immovable property. Identification of corporations with obligation to report under the Non-Financial Reporting Directive and their respective Taxonomy key performance indicators was performed in data collection project based on materiality of the in-scope exposures. The calculation of Deutsche Bank’s key performance indicators presented in the following table is based on the prudential consolidation circle and FINREP balance sheet. Mandatory disclosure in accordance with Article 8 of the Taxonomy Regulation in % of total in % of covered Dec 31, 2022 in € m. assets assets Total assets 1,339,157 100.00 Exposures to central governments, central banks and supranational issuers 301,900 22.54 Exposures in the trading portfolio (excluding exposures to central governments, central banks and supernational issuers) 144,381 10.78 Covered assets 892,876 66.67 100.00 Exposures in derivatives 299,834 33.58 Exposures to corporations with no obligation to report under the Non-Financial Reporting Directive 309,631 34.68 Exposures in on demand inter-bank loans 7,029 0.79 Exposures to Taxonomy eligible economic activities based on capital expenditure key performance indicators 164,495 18.42 Exposures to Taxonomy non-eligible economic activities based on capital expenditure key performance indicators 111,887 12.53 Exposures to Taxonomy eligible economic activities based on turnover key performance indicators 165,103 18.49 Exposures to Taxonomy non-eligible economic activities based on turnover key performance indicators 111,279 12.46 in % of total in % of covered 1 Dec 31, 2021 in € mn. assets assets Total assets 1,323,993 100.00 Exposures to central governments, central banks and supranational issuers 303,929 22.96 Exposures in the trading portfolio (excluding exposures to central governments, central banks and supernational issuers) 144,132 10.89 Covered assets 875,932 66.16 100.00 Exposures in derivatives 299,956 34.24 Exposures to corporations with no obligation to report under the Non-Financial Reporting Directive 237,806 27.15 Exposures in on demand inter-bank loans 7,087 0.81 Exposures to Taxonomy eligible economic activities 156,092 17.82 Exposures to Taxonomy non-eligible economic activities 174,991 19.98 1 Disclosure for year end 2021 was amended in line with the EU Commission’s frequently asked questions issued in course of 2022, clarifying the use of covered assets instead of total assets in the denominator of the eligibility ratios. Additionally, individual key performance indicators were amended to become additive and not independent from each other, in line with the approach taken for year end 2022 disclosure. In 2023, Deutsche Bank will work towards disclosing taxonomy alignment of the bank’s portfolio, expressed by the Green Asset Ratio. This will include improving data quality, in particular for the transaction-level use of proceeds assessments, and acquisition of the data required to determine the alignment of eligible clients. 20
Deutsche Bank Transition toward a sustainable and climate-neutral economy Non-Financial Report 2022 Sustainable finance Progress toward target GRI FS8 In 2022, Deutsche Bank achieved a cumulative sustainable financing and investments volume of € 215 billion (excluding DWS), thus outperforming its target of at least € 200 billion by year end 2022. The volume includes financing, bond issuance and sustainable assets under management in the Private Bank which have been facilitated since January 1, 2020. The ESG assets managed by DWS are not included in this figure as DWS operates as a separate legal entity that set its own sustainability strategy. In 2022, Deutsche Bank achieved an incremental sustainable financing and investments volume of € 58 billion (excluding DWS), compared to incremental € 112 billion in 2021 and € 46 billion in 2020. Decrease of the financing volumes compared to the prior year reflects lower levels of sustainability activities as companies prioritized their responses to the macro-economic and geo-political uncertainty and reduced lending and refinancing in a rising interest rate environment. Lower issuance volumes compared to the prior year reflect reduced primary issuance activity and volatile conditions in the global capital markets in 2022. Assets under management reported in the Private Bank include a net negative adjustment reflecting regulatory and market driven classification and advisory changes which came into force in August 2022. The contributions of Corporate Bank, Investment Bank including Fixed Income and Currencies and Origination and Advisory, Private Bank including Private Bank Germany and International Private Bank are summarized in the graphic and the tables below. Further details on the progress of individual businesses are provided in their respective chapters. 1 Numbers may not add up due to rounding Sustainable financing and investments – cumulative volumes per business Dec 31, 2022 Assets under 1 2 in € bn. Financing Issuance Management Total Corporate Bank 40 0 0 40 Investment Bank 38 90 0 128 Fixed Income and Currencies 31 27 0 58 Origination and Advisory 6 64 0 70 Private Bank 10 0 37 48 Private Bank Germany 9 0 23 32 International Private Bank 1 0 15 16 Total 88 90 37 215 1 Numbers may not add up due to rounding 2 Stock value at period end Dec 31, 2021 Assets under 1 2 in € bn. Financing Issuance Management Total Corporate Bank 26 0 0 26 Investment Bank 24 63 0 87 Fixed Income and Currencies 21 18 0 39 Origination and Advisory 3 45 0 48 Private Bank 8 0 36 44 Private Bank Germany 7 0 17 24 International Private Bank 0 0 20 20 Total 58 63 36 157 1 Numbers may not add up due to rounding 2 Stock value at period end 21
Deutsche Bank Transition toward a sustainable and climate-neutral economy Non-Financial Report 2022 Sustainable finance Dec 31, 2020 Assets under 1 in € bn. Financing Issuance Management Total Corporate Bank 6 0 0 6 Investment Bank 6 19 0 25 Fixed Income and Currencies 6 2 0 8 Origination and Advisory 0 17 0 17 Private Bank 4 0 11 15 Private Bank Germany 4 0 5 9 International Private Bank 0 0 6 6 Total 16 19 11 46 1 Stock value at period end In addition to the breakdown of the cumulated sustainable financing and investment volumes by business, the bank splits its 2022 contribution of € 58 billion in sustainable financing and investments by category (sustainability-linked, environmental, social and environmental and social) and by client type (corporates, sovereigns, supranational organizations and agencies, private and institutional). 1 Numbers may not add up due to rounding Contribution to the United Nations Sustainable Development Goals Deutsche Bank considers verifiable external reference points to be essential in its journey from ambition to environmental impact and links its progress to recognized external frameworks, like the United Nations’ Sustainable Development Goals. Therefore, the bank continues to assess how its financing and issuance activities contribute to the’ Sustainable Development Goals. Given the aforementioned MiFID II negative adjustment to assets under management in the Private Bank, financing and issuance comprised € 57 billion of the total € 58 billion incremental volumes in 2022. The bank maps them to the Sustainable Development Goals, whereby, in some cases, one transaction can be assigned to more than one goal as some categories overlap with each other and are not clearly segregated. 22
Deutsche Bank Transition toward a sustainable and climate-neutral economy Non-Financial Report 2022 Sustainable finance 1 Numbers may not add up due to rounding Corporate Bank Overview GRI 201-2, FS3, FS14 Corporate Bank’s ESG ambition is to be the strategic financing partner of choice for corporates on their ESG journey, helping them to navigate the challenges and benefits from the long-term opportunities of the transition towards a low-carbon economy. Corporate Bank is servicing the entire corporate client universe with strong relationships to its multinational corporations and a unique proposition in the MidCorp and Business Banking client segment. Through a global network of ESG champions across coverage and products, Corporate Bank is supporting its clients with ESG advice and a comprehensive suite of sustainable financing solutions and services. The champions work in collaboration with the central Corporate Bank ESG Client Solutions team to engage with clients and assist them on their long-term business strategies with a focus on transition financing. The team further provides guidance and industry specific expertise, develops materials and training, and drives the implementation of the ESG strategy in close coordination with other businesses and functions. The Global Head of ESG Corporate Bank is a member of the Corporate Bank executive committee and is mandated to drive ESG across the entire Corporate Bank franchise. In 2022, Corporate Bank provided sustainable financing solutions of € 13 billion, conducted training of its client facing staff and provided continuous ESG news flow. Furthermore, Corporate Bank extended its ESG-enabled product suite and service for its MidCorp and Business Banking clients and established a sustainable supply chain finance program, which enables clients to improve ESG accountability and transparency across their supply chain. 23
Deutsche Bank Transition toward a sustainable and climate-neutral economy Non-Financial Report 2022 Sustainable finance Transition dialogue and financing is part of Corporate Bank’s strategic client engagement and will continue to be the focus of helping its clients across sectors to achieve their strategic goals and enable the development and integration of sustainable business practices. Corporate Bank offers a comprehensive suite of sustainable finance products and services which includes different types of lending across Strategic Corporate Lending, Lending, Structured Trade and Export Finance, Natural Resource Finance, and Trade Flow, including supply chain finance programs. Corporate Bank’s Strategic Corporate Lending unit serves multinational corporate clients whose business models and financing strategies are increasingly oriented towards ESG. The loan portfolio includes sustainability-linked revolving credit facilities aligned with the United Nations Sustainable Development Goals. Strategic Corporate Lending contributed a total of € 8 billion towards Corporate Bank’s sustainable finance volumes in 2022. Corporate Bank’s Lending team supports its clients on their sustainability journey by offering sustainable lending solutions such as green loans and sustainability-linked credit facilities. In 2022, Lending showed growth of € 3 billion in sustainable lending transactions and volumes. Further, Lending launched an environmental loan program (“Umweltkredit”) to support its clients‘ investments in climate change mitigation measures such as environmentally friendly production technologies, renewable energy or energy efficiency. The Trade Flow unit offers sustainability banking services and advice to support clients to drive ESG accountability and transparency across their supply chain. In 2022, Deutsche Bank linked the Henkel AG & Co. KGaA (Henkel) supply chain finance program to the ESG ratings of its suppliers and is the first bank in Europe to convert an existing supply chain finance program for its client. Through this program, Henkel creates incentives for its suppliers to be more sustainable. By improving their ESG rating, suppliers can further reduce financing costs. The business unit ended the year 2022 with € 2 billion in sustainable financing. The Structured Trade and Export Finance unit provides long-term financing for essential infrastructure, such as railways and public transport, water infrastructure, offshore wind farms, market facilities, education facilities and healthcare projects. With a focus on emerging markets, projects have a direct positive impact on the local population and contribute to achieving environmental and social Sustainable Development Goals. Structured Trade and Export Finance contributed a total of € 252 million towards Corporate Bank’s sustainable finance volumes in 2022. As an example of Corporate Bank’s commitment to access and inclusion, Structured Trade and Export Finance supported emerging markets clients with structuring financings for critical infrastructure such as water management, healthcare, and transportation, for instance by improving access to passenger and freight transportation via railways. The Natural Resource Finance unit offers ESG-linked loans to finance energy transition investments and to contribute to energy security via financing of energy flows including biofuels, and strategic metals. In 2022, Natural Resource Finance structured its first ESG-linked uncommitted transactional commodity finance facility for a commodity trader to finance Renewable Energy Directive II certified biofuels. Additionally, Natural Resource Finance has financed several renewable energy projects as lender in syndicates, and partially as mandated lead arranger. In 2022, Natural Resource Finance contributed € 447 million in sustainable financing. The Community Development Finance Group supports economic opportunities that benefit low- and moderate-income communities in the United States of America. This portfolio includes loans that support the creation and preservation of affordable housing, loans that help small businesses with limited access to capital, and investments in funds seeking to generate both a financial return and positive social impact in low-income communities. Other funding goes towards initiatives that address complex social issues with the aim of reducing the racial wealth gap. The business unit contributed a total of € 117 million towards Corporate Bank’s sustainable finance volumes in 2022. The Corporate Bank’s Trust and Agency Services unit is a leading service provider for sustainable finance transactions in capital markets, with a focus on conventional and structured debt, project finance, syndicated loans and escrows. The offering includes administrative and trustee services for multiple asset classes and instrument types throughout the transaction lifecycle. Services include monitoring of covenants, administration of cash flows, taking and holding of security, and acting as a conduit between parties. Trust and Agency Services solutions are not contributing towards Deutsche Bank’s sustainable finance volumes but are a key component in supporting Deutsche Bank’s global offering in sustainable finance. In 2022, Trust and Agency Services expanded its service offering by acting as sustainable agent for sustainability-linked loans, and environmental and social agent for transactions with ESG-specific deliverables. In these roles, coordination and monitoring services that are critical to the performance of transactions with a high ESG due diligence profile are provided. 24
Deutsche Bank Transition toward a sustainable and climate-neutral economy Non-Financial Report 2022 Sustainable finance Progress toward target GRI FS8 Sustainable financing and investments – Corporate Bank (cumulative volumes) Contribution in 1 in € bn. Dec 31, 2022 2022 Dec 31, 2021 Dec 31, 2020 Financing 40 13 26 6 Issuance 0 0 0 0 2 Assets under Management 0 0 0 0 Total 40 13 26 6 1 Numbers may not add up due to rounding 2 Stock value at period end Corporate Bank’s cumulated sustainable financing totaled € 40 billion at year end 2022. Incremental financing volumes in 2022 reduced to € 13 billion, all of which were loans and facilities, compared to € 20 billion in the prior year. Decrease of the volumes compared to the prior year reflects lower levels of sustainability activities due to the macro-economic and geo-political uncertainty and reduced lending and refinancing in a rising interest rate environment. Highlights Corporate Bank facilitated numerous transactions in 2022 that underscore its position as a strategic partner for its clients and evidencing its expertise and capabilities to structure a broad range of sustainable finance solutions with the following selected highlights. Deutsche Bank acted as mandated lead arranger for the financing of a project which involved the construction of a high-speed railway between Ankara and Izmir in the Republic of Turkey. The financing for the project included a € 2.1 billion facility backed by United Kingdom Export Finance, the export credit agency in the United Kingdom. The new high speed railway line will provide a low-carbon method of transportation, it will improve efficiency of transport between Ankara and Izmir, creating job opportunities and improve economic conditions of the surrounding population. Deutsche Bank closed an up to € 5 million equity investment in Blackstar Stability Distressed Debt Fund LLC (Blackstar). Blackstar is an African American-led, social impact private equity fund whose mission is to support affordable and equitable homeownership, wealth creation, and financial stability for low- to moderate-income families in the United States by converting predatory contracts for deeds into traditional mortgages. This transaction is a new relationship for Deutsche Bank and signifies a commitment to supporting interventions that intentionally address racial inequity in the United States. Deutsche Bank participated as a lender with € 76 million in Tricon International’s € 1 billion uncommitted ESG-linked borrowing base facility and acted as joint lead arranger with a € 96 million ticket in Tricon Dry Chemical’s € 881 million uncommitted ESG-linked borrowing base facility. In both facilities, the borrowers must meet three sustainability key performance indicators in order to realize a pricing benefit or pay additional fees if they are missed. The key performance indicators to be satisfied reflect a 100% implementation of an outlined responsible sourcing plan, increase trading volumes of circular products over a 12-month period, and enter a new market regarding renewable products. Deutsche Bank acted as coordinator, mandated lead arranger, bookrunner and ESG coordinator in a € 400 million syndicated loan to Hirschvogel Group. Hirschvogel is one of the largest international automotive suppliers in the area of steel and aluminum forging as well as subsequent machining. The pricing of the facility is linked to the Group’s CO emissions and lost 2 time incident rate and thus supports the client in achieving its strategic sustainability goals. 25
Deutsche Bank Transition toward a sustainable and climate-neutral economy Non-Financial Report 2022 Sustainable finance Deutsche Bank participated in Alstom’s sustainability-linked € 12.7 billion committed guarantee facility agreement. Reflecting Alstom’s ambitious commitment to sustainable mobility, four sustainability-linked key performance indicators were introduced into this facility agreement. These ambitious key performance indicators highlight Alstom’s goals of reducing company and product carbon emissions and increasing presence of women in senior management and engineering positions. This transaction demonstrates Deutsche Bank’s commitment in facilitating the transition of economies towards sustainable and low-carbon growth. In a syndicate of nine banks, Deutsche Bank acted as mandated lead arranger and hedge provider for the € 466 million financing of Nebras Power Australia’s, Palisade Investment’s, and Goldwind Australia’s Stockyard Hill wind farm in the state of Victoria, Australia. The 528 megawatt wind farm is the largest operating wind farm in the east coast of Australia, includes 149 Goldwind wind turbines, and produces green electricity to power 425,000 homes annually. Investment Bank Fixed Income and Currencies Overview GRI 201-2, FS8, FS14 Fixed Income and Currencies leverages its expertise in product innovation to structure, originate and distribute assets that meet clients’ rapidly evolving ESG needs. The four main objectives for Fixed Income and Currencies are to support clients by connecting investors and issuers, to increase its sustainable lending, to support the client’s energy transition journey, and to innovate and expand its product range. The business is led by the Global Head of ESG and Sustainable Finance for Fixed Income and Currencies whose responsibilities include oversight of ESG practices within Fixed Income and Currencies and for growing the sustainable finance product suite, client engagement, and strategy including the steering of the business activities to achieve its decarbonization targets. The Head of the Fixed Income and Currencies ESG Competence & Solutions Center is responsible for the ESG integration in the businesses, interface with the group and business level control functions and supporting the clients with development of green, social, sustainable and sustainability linked transactions and fixed income products. These positions are further supported by a network of ESG champions in each of the respective Fixed Income and Currencies business areas. Sustainable finance origination in the Global Financing and Credit Trading business cumulatively increased from € 23 billion in 2021 to € 33 billion in 2022. This growth was propelled mainly by demand for renewable energy and energy-efficient assets, especially in the commercial real estate and information communications technology sectors. Social financing grew as well, including SME lending. Global Financing and Credit Trading contributed € 1.7 billion in 2021 and € 1.2 billion in 2022 towards sustainability linked deals. Global Financing and Credit Trading continued to lead in sustainable finance securitization, with multiples deals included in the highlights section below. The Rates business provides risk management solutions for sustainable bonds and loans issuers. It also issues and invests in affordable housing loans and bonds in the United States and Europe and intends to further expand this business in the future. In 2022, Rates contributed € 9 billion towards Deutsche bank’s sustainable financing and investments volumes. Rates also facilitated more than 84 structured green bond issuances and launched the DB Global Equity Long/Short ESG Screened Index, designed to capture returns of “ESG” as a factor. This means stocks are ranked according to an ESG score, and the index goes long the top quintile and short the bottom quintile subject to market cap, sector, region and market neutrality. The index is used for two purposes: (1) providing investment access to ESG as a market factor through index linked certificates and (2) as a monitoring tool of returns of the ESG factor and as a way of assessing macro risks that may be introduced to portfolios through the introduction of ESG. 26
Deutsche Bank Transition toward a sustainable and climate-neutral economy Non-Financial Report 2022 Sustainable finance The Global Emerging Markets business has a strong market leadership and footprint in developing novel ESG solutions by structuring and executing innovative and award winning ESG-linked financing and risk management solutions for its global client base. In addition, Global Emerging Markets provides primary and secondary trading for green and social bonds issued by supranational institutions in emerging market currencies which amounted to around € 3 billion through seven issuances in 2022. Overall, Global Emerging Markets franchise contributed € 0.9 billion towards bank’s sustainable financing and investments volumes target for 2022. The Global Foreign Exchange business has been a pioneer in ESG linked derivatives, structuring innovative solutions to answer the needs and requirements of the clients. Deutsche Bank aims to continue to innovate in this space by helping its clients align their ESG strategy with their hedging strategies. Fixed Income and Currencies recognizes the transformative power of financial inclusion of underserved communities that often lack access to financial services. Fixed Income and Currencies is committed to raising private debt capital that provides long-term financing to microenterprises and small and medium enterprise. For example, in 2022, Fixed Income and Currencies underwrote two subordinated tranches for issuance on behalf of a European impact fund that is dedicated to promoting business and consumption practices that contribute to biodiversity conservation, the sustainable use of natural resources and to mitigate climate change and adapt to its impacts, in Latin America, the Caribbean and sub-Saharan Africa. Progress toward target GRI FS8 Sustainable financing and investments – Fixed Income and Currencies (cumulative volumes) Contribution in 1 in € bn. Dec 31, 2022 2022 Dec 31, 2021 Dec 31, 2020 Financing 31 11 21 6 Issuance 27 8 18 2 2 Assets under Management 0 0 0 0 Total 58 19 39 8 1 Numbers may not add up due to rounding 2 Stock value at period end At year end 2022, Fixed Income and Currencies had € 58 billion in cumulative sustainable financing and investments since the beginning of 2020. In 2022, Fixed Income and Currencies contributed € 19 billion in sustainable financing volumes compared to € 31 billion in 2021. The reduction in the Global Financing and Credit Trading and Rates businesses mainly reflected a higher interest rate environment generally constraining lending and refinancing, as well as lower capital markets issuance. Of the € 19 billion incremental volumes reported in 2022, € 7.6 were loans and facilities (€ 3.1 billion corporate loans, € 1.6 billion commercial real estate, € 0.1 billion asset finance, € 2.8 billion project finance), € 11.2 billion bonds and € 0.2 billion derivatives. Highlights Deutsche Bank originated and securitized € 447 million, its first solo ESG deal for the acquisition of Hudson Commons, a Leadership in Energy and Environmental Design Platinum office property. This was also the bank’s first fixed rate Commercial Mortgage-backed Securities priced to Secured Overnight Financing Rate Swaps. Deutsche Bank acted as Sole Sustainability Coordinator to implement a sustainability-linked loan structure for the € 1.5 billion financing to Delta Fiber, a leading Dutch fiber network operator sponsored by EQT & Stonepeak. The KPI structure addresses the most material ESG topics through three KPIs. Deutsche Bank has executed multiple loans worth € 17 million with Dominium that were used to construct 803 affordable multifamily units in Phoenix, Arizona (AZ) and Woodbury, Minnesota (MN) USA. These projects will provide high-quality, safe and affordable housing for families and seniors that earn less than 60% of the area’s median incomes. This transaction encourages more activity in the space as a new source of affordable housing financing that meets unmet demand nationwide. 27
Deutsche Bank Transition toward a sustainable and climate-neutral economy Non-Financial Report 2022 Sustainable finance Deutsche Bank acted as joint lead arranger, underwriter and joint ESG coordinator for H&H International’s € 1.1 billion equivalent multi-tranche term loan facility and a € 70 million equivalent multi-currency revolving credit facility. H&H is a Hong Kong listed premium nutrition and wellness company. The position has been structured as a sustainability-linked loan, aligned with the 2022 sustainability linked loan principles, as confirmed by a Sustainalytics second party opinion (SPO). Deutsche Bank as joint lead manager successfully priced and settled € 188 million Plenti’s inaugural Personal Loan and Renewable Energy Loan Asset-Backed-Security transaction, Plenti PL Green ABS 2022-1. Following a successful inaugural Auto asset-backed securities transaction in 2021, Plenti re-engaged with market participants on this transaction, which included € 44 million of notes that were green certified under the Climate Bonds Standard and backed by renewable energy receivables. Deutsche Bank acted as joint bookrunner on a € 304 million Green Secured Railcar Asset-Backed-Security transaction serviced by Trinity Rail for Tribute Rail LLC. This transaction highlights Deutsche Bank’s continued support for the roll-out of green transportation. Origination and Advisory Overview GRI 201-2, 404-2, FS4, FS8 Origination and Advisory advises clients holistically on broader aspects of sustainable finance and on how to successfully issue sustainable debt, including the strategic and operational preparation required. Origination and Advisory aspires to be a trusted partner for clients in navigating their sustainability journey, including emerging regulations, market developments, and investor preferences. A focus topic across global capital markets has been financing the shift to carbon neutrality. Origination and Advisory engages in dialogue with clients in high-carbon sectors and acts as a partner in their pathway towards a sustainable transition. Over the course of 2022, Origination and Advisory appointed a Head of ESG Origination and Advisory to lead ESG strategy and origination in the division. Origination and Advisory has also provided training to its front office staff on topics covering the accelerating ESG landscape including regulatory development, European taxonomy, net-zero and sustainable finance product-related topics. In 2022, Origination and Advisory helped raise € 22 billion of sustainable debt volumes, globally. Deutsche Bank partnered with global corporates, sovereigns and public sector clients in supporting them with their inaugural green bond issuances and ESG bond and loan transactions. In Investment grade debt, Deutsche Bank supported clients with the issuance of ESG bonds and sustainability-linked bonds. Further, Debt Capital Markets has outperformed in the Financial Institutions Group sector globally ranking third in 2022 up from 14th in 2021 and in Financial Institutions Group euro denominated issuances, ranking second in 2022 up from previous ranking of 16th in 2021, respectively. The Leveraged Finance business facilitated Key performance Indicator-linked loans to corporates and supported clients in issuing bonds in sustainable formats Progress toward target GRI FS8 Sustainable financing and investments – Origination and Advisory (cumulative volumes) Contribution in in € bn. Dec 31, 2022 2022 Dec 31, 2021 Dec 31, 2020 Financing 6 3 3 0 Issuance 64 19 45 17 1 Assets under Management 0 0 0 0 Total 70 22 48 17 1 Stock value at period end 28
Deutsche Bank Transition toward a sustainable and climate-neutral economy Non-Financial Report 2022 Sustainable finance At year end 2022, Origination and Advisory‘s sustainable financing and investments since the beginning of 2020 stand at cumulatively € 70 billion. Origination and Advisory contributed € 22 billion of incremental financing volumes in 2022 compared to € 31 billion in 2021, reflecting volatile conditions in the global capital markets and reduced primary issuance activity. Of € 22 billion incremental volumes reported in 2022, € 21.2 billion was investment grade debt, € 0.7 billion leveraged finance and € 15 million equity capital markets. Highlights Intesa Sanpaolo S.p.A. placed a € 1 billion 5-year green senior non-preferred bond for which Deutsche Bank acted as joint green structurer and joint lead manager. The use of proceeds will go towards financing or refinancing of eligible green projects. Republic of Singapore issued its inaugural € 1.7 billion green bond, a landmark first syndicated issuance for the Government of Singapore, for which Deutsche Bank acted as joint bookrunner. Proceeds of the bonds will be applied in accordance with the Singapore Green Bond Framework. Munich Re’s inaugural green € 1.2 billion Tier 2 transaction marked a major step in the issuer’s systematic integration of sustainability in their funding activities. Deutsche Bank supported Munich Re as joint lead manager. The bond references to Munich Re’s Green Bond Framework from 2020, with eligible projects spanning from renewable energy to wastewater management and clean transportation, among others. Deutsche Bank acted as joint structuring advisor and joint lead manager on New Zealand’s inaugural € 1.8 billion green bond. Proceeds from this transaction will be used to finance a broad range of eligible government expenditures, reflecting the New Zealand government’s extensive climate and environmental agenda. These expenditures may include clean transportation, energy efficiency, green buildings, biodiversity, water management and climate change adaptation. Deutsche Bank acted as joint lead manager for the Republic of Austria’s € 4 billion inaugural green bond following the publication of Austria’s Green Bond Framework. The issuance was well received with 214 different investors participating in the transaction, green investors accounting for approximately 70%. Deutsche Bank acted as sustainability bond structuring advisor, joint bookrunner and marketing coordinator on State Street Corporation’s inaugural € 0.5 billion sustainability bond offering. State Street Corporation, one of the world’s leading providers of financial services to institutional investors, intends to allocate proceeds to a variety of eligible green and social projects. 29
Deutsche Bank Transition toward a sustainable and climate-neutral economy Non-Financial Report 2022 Sustainable finance Private Bank Private Bank wants to be a trustworthy partner for its clients on their path to sustainability and wants to contribute to an environmentally sound, socially inclusive and well governed economy and society. Private Bank provides its clients with differentiated ESG advisory and solutions, in Germany with two complementary brands – Deutsche Bank and Postbank – for private clients as well as internationally with focus on wealthy individuals, entrepreneurs and family associations, as well as small and medium enterprises in selected European countries. In 2022, Private Bank continued its ESG program, launched in 2021, and further propelled its transformation. The corresponding teams coordinate the implementation of the objectives derived from Private Bank‘s ESG vision, in particular the integration and coordination of advisory approaches, products and processes. Based on Deutsche Bank Group’s framework that evolved along with regulatory and market requirements, Private Bank applied its “Sustainable Investment Classification Criteria” and further refined them in 2022 taking into consideration sustainability criteria defined under Markets in Financial Instruments Directive II. Compliance with the criteria is checked on a daily basis as part of an automated product governance. An important milestone was the integration of sustainability criteria in the advisory process compliant also to the regulatory requirements of Markets in Financial Instruments Directive II. These regulatory requirements apply to all legal entities and business units of Private Bank based in the European Union and/or provide financial services to European clients. This involves asking for and considering the client’s sustainability preferences based on a defined and reliable process. Private Bank’s respective target market concept takes into account the process of discretionary portfolio management services and its equities, exchange-traded and mutuals funds, bonds and structured products. Private Bank Germany Overview GRI 201-2, FS4, FS14 Private Bank Germany aims to meet private client’s growing demand for ESG compliant products and services by providing best-in-class transparency and leading advisory on ESG. In 2022, Private Bank Germany proceeded on its path to an ESG integrated business model by anchoring sustainability in its business activities ranging from ESG compliant products and advisory processes to remote customer advice. Private Bank Germany applied Private Bank’s updated “Sustainable Investment Classification Criteria” and aligned its processes and product portfolio with regards to the key regulatory developments in 2022: – In July 2022, Private Bank Germany implemented an adjusted advisory process compliant to the ESG requirements of Markets in Financial Instruments Directive II – On the Private Bank Germany platform, ESG investment product portfolio was further extended; it included mutual funds with an ESG-related thematic investment approach (Pictet Nutrition, DWS Invest ESG Next Generation Infrastructure), equity funds converted to ESG (DWS ESG Akkumula or BSF Sustainable Fixed Income Strategies) and Green Bonds issued by Deutsche Bank; funds must meet minimum requirements to be considered as an ESG fund, including whether the funds have a dedicated ESG strategy, consider specific exclusions and meet a minimum MSCI ESG rating; at year end 2022, Private Bank Germany offered a total of 32 actively managed ESG funds, eight more than a year earlier Sustainable construction and energy-efficient modernization are strategic topics in the real estate business, both in existing properties and new buildings. Private Bank Germany offers a sustainability package providing financing solutions including a climate loan with interest rate reduction and supporting services. Through BHW Bausparkasse AG (BHW AG), a directly held Deutsche Bank subsidiary. Following Deutsche Bank’s Sustainability Framework, BHW defines sustainability standards with additional specifications for its products and services. The introduction of ESG advisory concept, which began in 2021, was continued in 2022 and was completed in all 400 Deutsche Bank branches and seven regional advisory centers. For the Postbank brand, an initial pilot was carried out at six locations, which is aimed to be developed further in the first quarter of 2023. The ESG advisory concept comprises a broad qualification program for employees and makes sustainability tangible for clients in the branches through visible design elements. Deutsche Bank eSafe is a digital safe connected to the client’s bank account. In addition to digital bank and deposit statements, documents such as copies of identity cards, contracts or passwords can be stored here. 30
Deutsche Bank Transition toward a sustainable and climate-neutral economy Non-Financial Report 2022 Sustainable finance As a beyond banking offer, the carbon footprint indicator is an optional feature in the Deutsche Bank mobile banking app using an algorithm to calculate clients’ carbon emissions based on their bank account and credit card transactions. Emissions are displayed, in real time, in kilograms of carbon dioxide per euro. The aim is to visualize personal carbon footprint and thus, raise awareness for a more sustainable consumption behavior. About 175,000 application users activated the indicator by year end 2022. More than 70% of Deutsche Bank branches in Germany offer disabled access to self-service terminals, as well as to cash and advisory functions for each branch. The furniture is generally arranged in a way to ensure unobstructed passage for wheelchair users. New branches are located on the ground floor or in barrier-free buildings, wherever possible. Details of each Deutsche (*) on the website of Private Bank Germany. Bank branch are available via the branch finder Progress toward target GRI FS8 Sustainable financing and investments – Private Bank Germany (cumulative volumes) Contribution in in € bn. Dec 31, 2022 2022 Dec 31, 2021 Dec 31, 2020 Financing 9 2 7 4 Issuance 0 0 0 0 1 Assets under Management 23 6 17 5 Total 32 8 24 9 1 Stock value at period end At year end 2022, Private Bank Germany had a total of € 32 billion in sustainable financing and investments, compared to € 24 billion at year end 2021. Lower incremental volume recorded in 2022 compared to the prior year mainly resulted from negative market developments. Investments were adversely affected by performance effects of stock and bond markets. On the financing side, the demand for residential mortgages significantly contracted in the second half of 2022, primarily due to rising interest-rates and inflation. In addition, the more restrictive allocation of government grants had a negative impact on the demand for financing. Highlights Private Bank Germany progressed further on its path of ESG transformation and anchored sustainability in its almost all business activities. In 2022, asking for preferences was fully integrated in the investment advisory process for funds, discretionary portfolio management, single line equities, bonds and certificates. The ESG product portfolio was further extended. With its sustainability package, Private Bank Germany set up a comprehensive solution consisting of lower interest loans, opportunities for promotion and assistance for the realization of the building projects: Besides the BHW specific services, “Heating Replacement made easy” helped clients not only to find a suitable heating system, but also specialized craft companies. The “Funding Service” supported the client to find a suitable program of funding from about 6,000 different promotion programs in Germany. The ESG advisory concept makes ESG tangible in the branches: Workshops in which various aspects such as ways of reducing paper, electricity and water consumption or waste avoidance are explained using specific examples to increase the awareness for sustainability. Design elements such as moss walls or footprints make the concept visible to everyone. Since March 2022, Private Bank Germany has enabled Ukrainian refugees to open a free account in a simplified way requiring only a Ukrainian ID card. Private Bank Germany supports an agreement between the German banking industry, the Federal Ministry of Finance, the German Federal Bank and the National Bank of Ukraine. 31
Deutsche Bank Transition toward a sustainable and climate-neutral economy Non-Financial Report 2022 Sustainable finance International Private Bank Overview GRI 2-23, 201-2, 404-2, 417-1, FS4, FS8, FS14 In 2022, International Private Bank continued to implement its ESG strategy, committing to provide its clients the information, advice and products they need for their ESG solutions, thereby supporting clients in enabling their investments to have a positive impact. In 2022 International Private Bank formed a new Product, Platform and Sustainable Solutions function with International Private Bank Global Executive Committee representation and a dedicated sustainable solutions team driving the ESG approach across the division. International Private Bank progressed in its ambition to make ESG a default offering for investing through the conversion of its core Strategic Asset Allocation fund to align with sustainability criteria. Focus also remained on educating employees on ESG, including offering opportunities to obtain industry certifications, and providing training on emerging regulations for all product and analyst professionals. International Private Bank also continued providing thought leadership on biodiversity and ocean conservation topics through partnerships with Ocean Risk and Resilience Action Alliance, Cambridge Institute for Sustainability Leadership, and other renowned organizations delivering research, publications, and events. Key regulatory developments in 2022 on the topic of sustainability were incorporated into International Private Bank’s processes. In line with Private Bank’s updated Sustainable Investment Classification Criteria, International Private Bank applies the following approaches to investment products: – Discretionary portfolio management uses MSCI data to exclude industries that are deemed harmful in maintaining sound ESG risk management; these are generally in accordance with the bank’s group-wide exclusion policies; in addition, all of the portfolios underlying securities must have a minimum MSCI ESG rating; in line with new regulation on sustainability preferences (MiFID II); also discretionary portfolio management includes attributes that align the instrument selection within its mandates to the regulatory defined sustainability characteristics; discretionary portfolio management provides an ESG offering across the main regions and has transitioned its flagship Strategic Asset Allocation product by incorporating the defined ESG criteria since August 2022 – Funds on International Private Bank’s advisory list, identified by the Funds research team in the Global Investment Group must meet minimum requirements to be considered as an ESG fund; the funds must have a qualifying ESG strategy and meet a minimum MSCI ESG rating and the funds must align to defined sustainability regulations within the applicable region; additional due diligence is carried out to determine a subset of “dedicated” ESG funds which defines the funds that are actively promoted in advisory processes as ESG funds; these are then subsequently included in the sustainable volumes; regulatory thresholds in the European Union and stricter criteria for categorizing a product as sustainable came into effect as of August 2022, resulting in the number of ESG funds meeting the defined criteria on International Private Bank’s recommended lists being reduced year on year in 2022 to 34 ESG dedicated mutual funds (2021: 72 mutual funds) – Third-party green bonds in the investment portfolios of International Private Bank’s clients are considered ESG if the green bonds meet all four core components of the International Capital Market Association’s Green Bond Principles; these components set out guidelines for the instrument to be considered green which includes the use of proceeds, disclosure of the process for project evaluation and selection, the management of the proceeds and annual reporting on allocations In line with the bank’s Sustainable Finance Framework, International Private Bank continued to offer ESG lending options for its clients and short- to medium-term green deposits financing Deutsche Bank’s green asset pool and supporting UN Sustainable Development Goals. Furthermore, International Private Bank also offered ESG structured lending to support companies in meeting their sustainability goals, as well as consumer credit for electric vehicles, green mortgages offered for acquisition of A or B energy rated homes in Italy and lending for micro enterprises in India. Micro enterprise loans in India enable International Private Bank to offer products to small firms that would otherwise not receive financing, with some loans backed by government schemes. International Private Bank has a partnership with “Funds for Good” in Belgium under which International Private Bank donates part of its earnings to a foundation that supports young entrepreneurs who otherwise have limited access to lending. International Private Bank translates and adapts its client publications, which are prepared by its Chief Investment Office on ESG topics, to suit all markets, enabling it to share expert research and opinions with retail clients and high net worth investors alike. Progress toward target GRI FS 8 Sustainable financing and investments – International Private Bank (cumulative volumes) Contribution in 1 in € bn. Dec 31, 2022 2022 Dec 31, 2021 Dec 31, 2020 Financing 1 1 0 0 Issuance 0 0 0 0 2 Assets under Management 15 (5) 20 6 Total 16 (5) 20 6 1 Numbers may not add up for rounding reasons 2 Stock value at period end 32
Deutsche Bank Transition toward a sustainable and climate-neutral economy Non-Financial Report 2022 Sustainable finance At year end 2022, International Private Bank had € 16 billion in sustainable financing and investments compared to € 20 billion at year end 2021. The reduction in sustainable assets under management compared to the prior year primarily reflects regulatory (EU) and subsequent market driven classification and advisory modifications which came into force in August 2022. Highlights Following the launch of the Deutsche Bank Ocean Resilience Philanthropy Fund by International Private Bank, committed funds were donated in 2022 to support phase 1 of the Future Climate Coral Bank project, the first to be enabled by the Fund. This first project phase sought to establish a greater understanding of the past and present conditions of the Maldivian coral reefs and the supporting report (*) with a focus on recent coral bleaching events, inter alia , was published in October 2022. Continuing the partnership with the Ocean Risk Resilience Action Alliance, International Private Bank hosted its first Ocean Conference in September 2022 with leading entrepreneurs, investors, philanthropists ocean startups and scientists. International Private Bank converted its flagship Strategic Asset Allocation fund in August 2022 to meet its defined ESG criteria and enabled the assets under management to be included in the sustainable volumes. International Private Bank continued to develop innovative and impactful structured products, such as Green Bonds which contributed to sustainable assets under management, but also included a donation of a substantial part of the distribution margin to local non-profit organizations such as River Cleanup and Farming for Climate, as well as to the DB Ocean Resilience Philanthropy Fund. International Private Bank increased its contribution to sustainable financing volumes with additional financing for clients with sustainable business models. For example, International Private Bank provided supporting financial facilities and guarantees on power purchase agreements to renewable energy distributers in Spain. Asset Management Overview GRI 2-9/23, 201-2, FS11, FS12 With € 821 billion of assets under management as of December 31, 2022, the Asset Management division, which operates under the brand DWS, aspires to be one of the world’s leading asset management organizations. DWS serves a diverse client base of retail and institutional investors worldwide, with a strong presence in the bank’s home market in Germany. These clients include government institutions, corporations and foundations as well as individual investors. As a regulated asset manager, DWS acts as a fiduciary for clients and is conscious of its societal impact. Responsible investing has been a key part of DWS’s heritage for more than twenty years. DWS sustainability strategy DWS is further refining its approach regarding sustainability to better meet the evolving needs of its stakeholders – most importantly its clients. In this context, DWS remains committed to sustainability with a focus on climate and stakeholder engagement. 33
Deutsche Bank Transition toward a sustainable and climate-neutral economy Non-Financial Report 2022 Sustainable finance To mitigate climate change, transformational change is required across all parts of the real economy. Reflecting on the responsibilities as an asset manager in this transformation, DWS is committed to support its clients in managing this transformation by providing expertise and bespoke investment solutions. DWS sustainability strategy is anchored around four strategic priorities. – Corporate Transformation: DWS continues seeking to increase the level of sustainability associated with its activities throughout its organization – ESG in the Investment Process: While having already built-up strong capabilities, DWS seeks to further embed ESG in its investment process to improve the assessment of the future expected risk / return of a security – Innovative and Sustainable Investment Solutions: DWS seeks to launch new and innovative ESG products and solutions across asset classes to meet the requirements of its clients; at the same time, DWS acknowledges a more differentiated client demand as well as further regulatory clarifications and, therefore, intends to launch both ESG and non-ESG new products – Stakeholder Engagement: DWS seeks to take a holistic and systematic approach to engagement as DWS considers engagement with key stakeholders across the entire investment value-chain e.g., clients, investees, index providers and policy makers as the key driver for transformation DWS sustainability governance Sustainability governance at DWS starts with the Executive Board, which has the overall responsibility for managing sustainability-related risks and opportunities throughout its activities. During 2022, DWS adapted its sustainability governance and created a Sustainability Strategy Team to support the Chief Executive Officer in the development of the sustainability strategy and to ensure that it is embedded within the corporate strategy. Effective January 2023, the DWS Executive Board is supported by a new sub-committee, the Group Sustainability Committee, which is empowered to take decisions that implement the sustainability strategy. Additionally, DWS has set-up a Sustainability Oversight Office which aims to ensure effective sustainability governance throughout the organization and to support the Group Sustainability Committee. The ESG Advisory Board continues to advise the Executive Board on sustainability issues and opportunities. DWS Responsible Investment Framework The Responsible Investment Framework (*) summarizes how the DWS ESG integration approach is integrated into the investment process. ESG Assets under Management Based on the refinements made to DWS’s global ESG Framework (a framework for ESG product classification or disclosure), the following products are considered as ESG AuM as at the end of 2022: – Liquid actively managed products: retail mutual funds which follow the "DWS ESG Investment Standard" filter, or have a "sustainable investment objective", and US mutual funds which have been labelled as ESG and seek to adhere to an ESG investment strategy – Liquid passively managed funds (ETFs) which apply a screen comparable to the "DWS ESG Investment Standard" filter, or which track indices that comply with the EU Benchmark regulation on EU Climate Transition Benchmark and EU Paris- Aligned Benchmark, or have a "sustainable investment objective", and other liquid passively managed funds which have been labelled as ESG and/or seek to adhere to an ESG investment strategy – Liquid mandates or special funds for institutional clients or White Label products in-scope of the EU Sustainable Finance Disclosure Regulation (SFDR) and report pursuant to Article 8 SFDR which follow the "DWS ESG Investment Standard" filter or a comparable ESG filter aligned with the client or which are in-scope of SFDR and report pursuant to Article 9 SFDR – Liquid mandates or special funds for institutional clients or White Label products which are out-of-scope of SFDR but comply with certain of the "General Industry Standards and Guidelines for Sustainable Investing" – Illiquid products which are in-scope of SFDR and report pursuant to Article 9 SFDR – Illiquid products which are out-of-scope of SFDR but which have a "sustainable investment objective" 34
Deutsche Bank Transition toward a sustainable and climate-neutral economy Non-Financial Report 2022 Sustainable finance DWS offers two different types of Article 8 products through applying one of the following two ESG filters: – The “DWS Basic Exclusions” filter represents DWS’s basic approach to incorporating certain exclusions in the investment policy of the relevant fund. Products applying this filter only are excluded from the 2022 ESG AuM number – The “DWS ESG Investment Standard” filter enhances the exclusions in comparison to the “DWS Basic Exclusion” filter and adds an “ESG quality assessment” approach encompassing investments in issuers selected for positive ESG performance relative to industry peers (so-called “Best-In-Class approach”). Products applying this filter are included in the 2022 ESG AuM number ESG Assets under Management (AuM) 1 in € m. Dec 31, 2022 Dec 31, 2021 ESG AuM in Active 81,263 84,129 ESG AuM in Passive 34,193 29,499 ESG AuM in Alternatives 1,552 1,608 Total ESG AuM (according to the DWS ESG Framework) 117,007 115,236 1 Numbers may not add up due to rounding Liquid assets GRI 201-2, FS3, FS11 DWS aims to incorporate ESG information in the Active investment process to improve the assessment of the future expected risk / return of a security. This may include the identification of ESG factors at the sector level or the analysis of potential impacts of ESG risks and opportunities on business models, competitive position and valuation. Furthermore, issuers with insufficient governance quality, poor compliance with international norms or issuers with a high climate change risk may become a focus area of DWS engagement activities. In the context of DWS’s net zero targets, DWS took voting action against companies that did not respond to its attempts to engage where it deemed necessary. DWS also reviewed its own net zero investee list and incorporated high weighted inflation adjusted carbon intensity portfolio contribution as a factor and sent out an initial letter for engagement to the newly identified net zero thematic engagement investees. The DWS ESG Engine is a proprietary tool that produces key output assessments, which form the basis for DWS’ ESG investment strategies and for ESG integration activities. The ESG Engine collects data from various sources including leading commercial ESG vendors. For the asset classes where data is available, the data is standardized and aggregated to yield ESG assessment scores and grades which are used by different functions within DWS. The ESG Engine and Solution team owns both the ESG methodology implementation as well as the process to produce ESG assessments in regular update cycles. Throughout 2022, DWS used five external commercial ESG data providers: MSCI ESG, Morningstar Sustainalytics, ISS ESG, S&P TruCost, ESG Book and onboarded additional – partly non-commercial – vendors to support its net zero ambitions. The data is made available to research analysts and portfolio managers for liquid assets through the Aladdin platform and provides support to research, investment decision making and for managing ESG strategies. The use of the ESG Engine and the scope of application remained unchanged throughout 2022. The internal DWS Sustainability Assessment Validation Council was established at the end of 2021 to oversee ESG assessments within the ESG Engine. The council seeks to ensure that the ESG Engine assessments reflects the current underlying risk of the issuer. In 2022, there were 198 reviews including 120 downgrades and 28 upgrades. For assets managed by DWS Investment GmbH, DWS International GmbH and DWS Investment S.A., a regional Engagement Council oversees the engagement activities defined by the enhanced engagement framework, such as providing guidance to the engagement leads, performing quality checks and tracking engagement progress. The objective of this council is to facilitate the discussion of important financial and non-financial issues and to drive engagement for the assets managed by DWS Investment GmbH, DWS International GmbH and DWS Investment S.A. It is chaired by the DWS Head of Corporate Governance Center and the DWS Head of ESG Integration team. The DWS Engagement Policy and DWS ESG Integration Policy for Active Investment Management have been enhanced to accommodate regulatory requirements under the EU’s Sustainable Finance Disclosure Regulation. Corporate governance engagement themes such as the independence of supervisory boards and remuneration remained as key discussion topics in 2022. For the Corporate Governance and Proxy Voting Policy, please refer here (*). 35
Deutsche Bank Transition toward a sustainable and climate-neutral economy Non-Financial Report 2022 Sustainable finance Proxy Voting and Engagements Dec 31, 2022 Dec 31, 2021 Dec 31, 2020 1 2 For mandates and funds domiciled with DWS legal entities in Europe and Asia (submitted votes3) 3,857 3,242 2,370 3 Companies voted 2,897 2,426 1,859 For mandates and funds domiciled with DWS legal entities in the US (submitted votes) 9,340 9,406 9,355 Companies voted 6,777 6,879 6,720 AGM attendance questions sent to company boards for virtual/physical shareholder meetings for funds and mandates domiciled in Europe 64 40 24 Corporate engagements for funds and mandates domiciled in Europe 532 581 454 1 DWS Investment GmbH (with discretion to vote for certain assets under management of DWS International GmbH, DWS Investment S.A. (including SICAVs and PLCs) based on delegation agreements). Other DWS legal entities may have their own voting process based on different local regulatory requirements 2 DWS Investment GmbH acts as a proxy advisor for the two separate DWS legal entities in Hong Kong (DWS Investments Hong Kong Ltd) and Japan (DWS Investments Japan Ltd), for which DWS Investment GmbH provides voting recommendations and the voting rights and voting execution lies with the respective Hong Kong and Japan entity 3 Of these, 41 meetings at 35 invested companies were unsuccessful in 2022 and 35 meetings at 20 investee companies were unsuccessful in 2021 due to rejected votes Illiquid assets GRI FS14 For most of the Alternatives asset class ESG is managed in accordance with an environmental and social management system. The environmental and social management system aims to assess and manage ESG risks, across the investment life cycle for the underlying portfolio assets and looks for continuous advancement. For relevant impact funds, which are mostly funds dedicated to climate mitigation within the Sustainable Investments platform, there is an additional impact framework, which aims to align with the Operating Principles for Impact Management to which DWS became signatory in 2019. There are currently four sustainable investment funds aligned with Operating Principles for Impact Management’s guided impact principles. For Real Estate, identifying, assessing, and managing material ESG issues is an integral part of conducting business. ESG issues can present risks and opportunities for financial performance, and investments may have positive and negative environmental and social effects. Therefore, DWS Real Estate has identified the sustainability issues which are of most relevance for real estate investments and developed four strategic ESG Themes: – Resilience, including efficiency and adaptation – Well-being, including comfort and air quality – Nature, including ecosystems and circularity, and – Community, including engagement and affordability The Infrastructure business incorporates ESG considerations into the investment framework at all stages of the investment lifecycle for equity investments, from the initial screening and due diligence to the asset management and exit stages. During the holding period, the team monitors the ESG attributes of the investments through regular reporting of KPIs from the portfolio companies, and through completion of the annual Global Real Estate Sustainability Benchmark Infrastructure assessment at both fund and asset level. Both the Real Estate and Infrastructure teams report to the Global Real Estate Sustainability Benchmark, which provides an independent assessment of portfolios and funds using a peer-based approach and scoring based on several ESG metrics. The Sustainable Investments platform within the Alternatives business aims to deliver risk adjusted market rate returns with economic, social and/or environmental outcomes. The investment initiatives range from energy efficiency, renewable energy, to clean urban transport, as well as sustainable agriculture. 36
Deutsche Bank Transition toward a sustainable and climate-neutral economy Non-Financial Report 2022 Sustainable finance Highlights The African Agriculture and Trade Investment Fund promotes sustainable agriculture. In line with its mandate of aiming to positively impact agricultural production with particular focus on smallholder farmers in Africa, the African Agriculture and Trade Investment Fund assesses its progress and impact on seven key outcome areas including employment, primary agricultural production, local processing, trade, outreach to agricultural producers, environment, and the environmental and social management system at the level of the investee company. During 2022, the African Agriculture and Trade Investment Fund disbursed U.S.$ 71 million. The Fund expanded its footprint in Western Africa providing loan facilities to UBN Nigeria as well as to Ecowas bank with a goal to support the reduction of the widening financing gap across the African agriculture sector. As of March 2022, the African Agriculture and Trade Investment Fund investees produced and delivered more than 342,000 tons of food and food related products and reached out to 272,000 smallholder farmers. The China Renewable Energy Fund is a climate mitigation private equity strategy exclusively investing in wind and solar renewable energy to supporting a Net Zero aligned corporate and its suppliers in China to neutralize their local carbon footprint through market mechanism by developing renewable energy sites in China. The clean energy generated from respective renewable energy sites are the basis for the fund to receive green certificates or Environmental Attributes, which are distributed to investors in addition to financial return. As of 2022-end, the operating portfolio of the China Renewable Energy Fund amounted to 465MW in total, which generated Environmental Attributes of more than 924GWh annually. During 2022, the fund added three new projects amounting to 396MW in installed capacity (to become operational in 2023 onwards). The European Energy Efficiency Fund aims to mitigate climate change by investing exclusively in energy efficiency, renewable energy, and urban transport where there is minimum 30% CO2 emissions savings and/or equivalent primary energy avoidance. The fund supports the climate goals of the European Union (EU 2030 framework for climate and energy and the climate-neutral objectives of the European Green Deal). As of the fourth quarter of 2022, the European Energy Efficiency Fund held a portfolio of 17 investments and achieved an average of more than 60% reduction of carbon emissions across its portfolio. During 2022, the European Energy Efficiency Fund raised U.S.$ 97 million from a large insurance company and corporate pension fund, as an attestation to the scalability for a blended finance fund with a 10+ year track record. The Universal Green Energy Access Program is a climate mitigation private debt strategy that aims to reduce GHG emissions by investing in decentralized energy service companies for off grid and mini-grid systems for rural households and communities and renewable energy for industrial players. Set up as a blended finance fund, this is the first fund for Deutsche Bank/DWS to be launched with the UN Green Climate Fund, to increase access to clean electrical energy for mainly rural populations in Sub-Saharan Africa. The fund was launched at COP26 in 2021 with U.S.$ 80 million committed from the Green Climate Fund as well as up to U.S.$ 15 million from DWS and aims for operationalization in early 2023. 37
Deutsche Bank Transition toward a sustainable and climate-neutral economy Non-Financial Report 2022 Climate risk Climate risk – Actively measuring, monitoring and managing climate risks – Net zero targets published for four carbon-intensive sectors – Climate metrics further embedded into governance and risk appetite framework Managing emerging transition and physical climate risks to the bank’s balance sheet and operations is a key component of the Group’s sustainability strategy. Deutsche Bank continues to embed climate risks into its business-as-usual risk management frameworks, processes and appetite – prioritizing areas with the highest potential impact based on comprehensive materiality assessment and integration into the risk identification process. Deutsche Bank utilizes a range of metrics to measure net zero alignment and the broader climate footprint of its portfolios and in October announced net zero aligned decarbonization targets for four priority carbon intensive sectors: Oil and Gas (upstream), Power Generation, Automotive (light duty vehicles) and Steel. These targets and metrics, which were approved by the bank’s Group Risk Committee, are fully integrated into the Group-wide risk management framework and appetite. Deutsche Bank has also further developed its transition and physical climate risk modelling capabilities in support of the delivery of the first climate stress test of the European Central Bank. The bank remains actively involved in a range of industry initiatives on climate and other ESG risks including participation in Net-Zero Banking Alliance working groups to develop consistent approaches to target setting, involvement in United Nations Environment Programme-Finance Initiative projects and membership of Partnership for Carbon Accounting Financials working groups for sovereigns and capital market instruments. Governance GRI 2-13/25, 3-3, 404-2, FS1, FS4 Deutsche Bank’s governance of climate risk varies by activity. The governance of the activities that drive the bank’s transformation, including those needed to fulfill Deutsche Bank’s pledge to net zero by 2050 (as a founding member of the Net-Zero Banking Alliance), is led by dedicated steering committees as well as leveraging existing governance structures. By contrast, the governance of business-as-usual activities is incorporated in the bank’s existing management structure. Deutsche Bank’s Group Sustainability Committee, chaired by the CEO, acts as the senior decision-making body for sustainability-related matters at group level including those related to climate risks and the bank’s net zero targets. The Committee receives regular updates on risk-related topics, including developments in Deutsche Bank’s financed emissions and net zero alignment targets as well as progress reports from risk-related workstreams. The Management Board also receives regular updates on financed emissions and net zero alignment via the Risk and Capital Profile report. Each of Deutsche Bank’s core businesses integrates climate and broader ESG risks into planning and risk appetite statements as part of the bank’s annual strategic planning process, approved by the Management Board. In 2022 the bank also established a Net-Zero Forum, responsible for the assessment of new transactions with a significant impact on the bank’s financed emissions and / or net zero targets. Members of the forum are senior representatives from Business, Risk and the Chief Sustainability Office. The Group Risk Committee, chaired by the Chief Risk Officer, is established by the Management Board to serve as the central forum for review and decision making on matters related to risk, capital, and liquidity. This includes the responsibility for developing the bank’s Climate Risk Framework. The Committee also approved the Bank’s decarbonization targets and its internal risk appetite thresholds. A number of delegated sub-committees of the Group Risk Committee are responsible for the development and management of specific elements of climate risk: – The Enterprise Risk Committee, which is composed of senior risk experts from various risk disciplines, focuses on enterprise-wide risk trends, events, and cross-risk portfolios. The committee oversees the development of the bank’s holistic climate risk management framework – The Non-Financial Risk Committee which oversees, governs and coordinates the management of non-financial risks group- wide and establishes a cross-risk and holistic perspective of the bank’s key non-financial risks, including risks to own infrastructure, employees and key processes including those arising from climate risks – The Group Reputational Risk Committee, which is responsible for the oversight, governance, and coordination of reputational risk management, including potential reputational risks arising from transactions linked to climate (and broader environmental and social) issues 38
Deutsche Bank Transition toward a sustainable and climate-neutral economy Non-Financial Report 2022 Climate risk The minutes of the meetings of the delegated sub-committees are shared with the members of the GRC Group Risk Committee when they become available. The minutes of the Group Risk Committee are shared with the Management Board when final. An ESG Risk Forum, comprised of experts across all key risk types and other control functions, oversees the integration of climate risk into the bank’s existing risk frameworks for managing financial and non-financial risks. ESG topics are also regularly discussed in business unit risk councils and other committees and fora. Information around the committees in the organization chart that are not covered in this section can be found in the governance section of the chapter “Sustainability Strategy”. Deutsche Bank has incorporated environmental, social and governance risks into the group’s risk taxonomy and adopted a Climate and Environmental Risk Policy at group level outlining roles, responsibilities as well as qualitative risk appetite principles and quantitative risk-appetite metrics. Training and risk awareness sessions on climate risk were held throughout the year. The sessions were available to Risk Management staff and senior leadership teams around the globe, on topics such as the bank’s net zero targets, sustainable Finance, ESG fundamentals and regulatory landscapes, ESG and the role of compliance, and others. Compliance is a part of the overall Governance around Sustainability and ESG risks described above and is represented in the Risk, Governance & Controls workstream (under the Sustainability Strategy Steering Committee) and in the ESG Risk Forum. Compliance has also set up a global ESG working group with representation from all relevant areas of the function and other 2nd Line of Defense functions such as NFRM and Legal. The working group provides a platform to exchange knowledge and discuss topical aspects of ESG. It carries out activities such as changes to policies, design and delivery of ESG-specific trainings, changes to the compliance annual risk assessment, reporting to the Compliance Executive Committee and to the management board as part of the annual compliance report to the management board. The working group also assesses further need for change in the mandate and set-up of the Compliance function to meet statutory requirements and regulatory expectations on an ongoing basis and advises the Compliance Executive Committee on those. In 2022 the Compliance ESG working group conducted a review of the entire Compliance-owned policy portfolio, with amendments being implemented ad-hoc or as part of the annual policy review. The Compliance Risk Type Policy was supplemented with several additional risk scenarios addressing ESG risks. A two-module training on ESG and the related tasks for compliance officers was delivered to a global audience. ESG risks formed an integral part of the Compliance annual risk assessment in 2022 and compliance officers participated in the risk and control assessments with a focus on ESG. Regarding the 3rd Line of Defense, Deutsche Bank’s Internal Audit function (Group Audit) provides independent and objective assurance to the Management Board of Deutsche Bank AG and its group companies on the adequacy of the design, operating effectiveness and efficiency of the bank’s risk management system which includes climate and environmental risks. Group Audit also acts as an independent, proactive and forward-looking challenger and adviser to Senior Management of the Group. 39
Deutsche Bank Transition toward a sustainable and climate-neutral economy Non-Financial Report 2022 Climate risk ESG related developments are covered by Group Audit as part of ongoing discussions with representatives of 1st and 2nd Line of Defense, (Chief Sustainability Office and Enterprise Risk Management teams respectively). In 2022, Group Audit conducted, a number of audits covering ESG-related risks, including an audit on ESG Governance, an audit on Risk and Control Assessment including Greenwashing, a targeted review on the Climate Risk Stress Testing of the European Central Bank and an audit on climate and environmental risks in Credit Risk Management of corporate and investment bank divisions. Furthermore, Group Audit developed guidance on auditing ESG, established a dedicated ESG team and a global working group, as well as defined a comprehensive audit coverage plan. Risk management strategy Deutsche Bank’s management of climate risks and opportunities is part of its broader sustainability strategy and supports the commitment to align the bank’s portfolio with net zero by 2050. Other components of the bank’s sustainability strategy, including growth in sustainable financing and investment volumes and broader Environmental and Social Policy Framework, are described in the “Sustainable finance” and “Environmental and social due diligence” chapters of this report. Climate risks and opportunities GRI 3-3, FS5 Climate change and environmental degradation may lead to the emergence of new sources of financial and non-financial risks. Transition risks to the bank’s portfolios are increasingly likely to materialize in the short-to-medium term as governments introduce ambitious climate-related targets and policies, as society adapts its behavior and as investor appetite for carbon intensive clients / sectors becomes more selective. These risks have been exacerbated by the current geopolitical environment and the war in Ukraine, which put additional strain on the global energy market and has increased the need to develop independent energy-efficiency measures across industries. Acute and chronic physical climate risk factors arising from higher global temperatures are expected to increase in severity even if decarbonization efforts prove successful, impacting Deutsche Bank’s operational risks and the risk to the assets of the bank’s clients. As explained in more detail in the sub-chapter Risk management framework – Risk identification and materiality assessment below, Deutsche Bank has conducted a structured materiality assessment to estimate potential impacts of these risk drivers across risk types and established policies, procedures and dedicated risk appetite to manage risks, including: – Interim (2030) and final (2050) net-zero aligned targets for key carbon intensive sectors to manage transition risks, which are fully embedded into internal governance structures and risk appetite frameworks – Environmental and Social policy frameworks and restrictions – Integration of ESG risk assessment into credit rating models and decision making – Specific requirements to assess and mitigate physical risks to immovable real estate collateral – Liquidity risk stress testing – Business Continuity and 3rd party risk management frameworks 40
Deutsche Bank Transition toward a sustainable and climate-neutral economy Non-Financial Report 2022 Climate risk For the financial sector, the transition to a net-zero economy and adaptation to climate change are not only a source of risks, but also present significant opportunities. The International Energy Agency estimates that, to reach net zero emissions by 2050, annual clean energy investment worldwide will need to more than triple by 2030 to around U.S.$ 4 trillion. In this context, banks have a significant role to play in financing sustainable activities (e.g., renewable energy projects) and investments required by clients in highly carbon intensive sectors to transition their business towards less carbon intensive operating models. Deutsche Bank’s Sustainable Financing target, including lending and other activities with ESG-linked KPIs, is in place to ensure that the bank’s activities are aligned with this transition. Risk management framework GRI 201-2, 3-3, FS1, FS3 Deutsche Bank’s Climate Risk Management Framework has four key elements: risk identification and materiality assessment; integration into risk type frameworks and processes; scenario analysis and stress testing; and integration into risk appetite via utilization of a range of risk metrics and targets. The bank’s development of tools, methodologies, and metrics for integrating climate risks into risk appetite frameworks, policies, and processes, has significantly progressed in 2022. This includes the bank’s ability to identify, assess, and monitor climate risks included in its balance sheet and operations, to set quantitative risk-appetite thresholds to minimize downside risks, and to review the development of its financed emissions and carbon intensity, both of which must fall over the medium to long term to support the transition to a low-carbon economy. The framework is described in Deutsche Bank’s Climate and Environmental Risk Management Policy. 41
Deutsche Bank Transition toward a sustainable and climate-neutral economy Non-Financial Report 2022 Climate risk Risk identification and materiality assessment Deutsche Bank has conducted a comprehensive materiality assessment of climate and other environmental risks to identify key impacts across potentially affected risk types in the short, medium and long term. The drivers considered in the analysis were climate transition risks arising from policy, technology and behavioral changes, acute and chronic physical risks and other environmental risks. The assessment of acute physical and policy-driven transition risk impacts on credit risk utilizes models developed for the 2022 ECB climate stress test. Environmental risk impacts on credit risk are assessed based on selected internal scenario analysis. Internal expert judgement is utilized for other transition and chronic physical risks pending the development of quantitative estimation approaches. Strategic risk impacts from transition risk drivers are estimated based on the share of client revenues in sectors in scope of net zero targets generated from clients with no stated decarbonization plans where it is assumed that business activity is incrementally scaled back as well as internal estimates of lost market share if Deutsche Bank fails to adapt to changing client demand for sustainable products. Strategic risk impacts from chronic physical risk drivers are estimated based on costs to relocate critical infrastructure to other regions, referencing the cost to establish Deutsche Bank’s tech center in Berlin. For other risk drivers Deutsche Bank utilizes historic experience and internal expert judgement. Physical risk impacts on market risk are assessed based on observed financial market impacts of selected severe events (Hurricane Katrina, Fukushima Tsunami). For transition risk policy changes, instantaneous market price shocks were modelled for high transition risk industries to estimate impacts. Assessment of other risks was based on internal expert judgement. Liquidity risk impacts are assessed based on a combination of internal stress testing under Net-Zero by 2050 and Delayed Transition scenarios as well as an extreme flood scenario and a reputational-risk driven scenario, supplemented by internal expert judgement. Operational risk impacts from acute physical risks are assessed based on a combination of internal city/regional wide outage impact estimates and existing group risk analysis of Deutsche Bank’s ability to respond and recover from a severe disruption to applications, data and third parties. Review of governance drivers linked to inadequate management of risks was primarily based on historic event data. ESG-related liability consequences were assessed based on structured analysis of five scenarios. Assessment of other risk drivers was based on internal expert judgement. Reputational risk impacts from transition risk and other environmental risk were assessed based on an assumed reduction in client activity with Deutsche Bank negatively impacting fee and commission income. No significant impacts were identified from other risk drivers. The key short-term and medium-term risks (
Deutsche Bank Transition toward a sustainable and climate-neutral economy Non-Financial Report 2022 Climate risk Integration into risk type frameworks and processes Credit risk Climate risk drivers are integrated across the different stages of the transaction lifecycle (including transaction approval / client onboarding, risk classification and credit ratings, portfolio analysis and monitoring, collateral valuation). Deutsche Bank's Environmental and Social Policy Framework outlines specific restrictions, due diligence and escalation requirements for sectors with inherently elevated potential for negative environmental impacts. In addition, new transactions or limit extensions with a significant impact on the bank’s financed emissions and / or net zero targets are reviewed by a dedicated Net-Zero Forum consisting of senior representatives from the Business, Risk and the Chief Sustainability Office. This review includes an assessment of client sustainability disclosures, transition strategies, decarbonization targets and governance. New transactions must fit within Deutsche Bank’s internal sectoral risk appetite aligned to net zero targets. The bank uses an internal climate risk taxonomy to identify sectors which are most impacted by climate transition risks. Sectors classified as high risk are subject to enhanced due diligence requirements in the credit rating process and transaction approvals. As part of the bank’s industry risk management framework, the Enterprise Risk Management team assesses sectoral risks and assigns each sector short- and long-term risk ratings. The long-term risk ratings include an assessment of a sector’s inherent vulnerability to climate risks and are an important input for setting sectoral risk appetite. Long-term risk ratings are incorporated into the bank’s internal counterparty rating model which the bank uses to guide client risk appetite. As part of the internal credit rating process climate and other ESG risks must be assessed and, where deemed material, documented. This may lead to adjustments of the relevant rating parameter (i.e., “special risks”). With regards to the valuation of collateral, the bank’s Global Collateral Policy sets its ESG standards based on respective minimum requirements of the Capital Requirement Regulation for initial valuation, monitoring and review over the life of the loan. Deutsche Bank’s underwriting standards require real estate collateral to be insured by the client. Such insurance often provides a protection against natural hazards. In some countries supplemental insurance against natural hazard is provided by the government. The bank’s German retail mortgage loan portfolio accounts for more than 80% of real estate collateral. The bank has estimated the amount of residential loans exposed to acute physical events, such as drought, earthquake, lightning, heavy rain, flooding, and according to where the collateral is located. The analysis was carried out through the Nomenclature of Territorial Units (NUTS) level 3 for purposes of aggregation. NUTS level 3 in Germany are Kreise (districts) and kreisfreie Städte (urban districts), of which there are 401 in total. At year end 2022, the bank had book value exposure of € 20.5 billion in 100-year flood zones. Compared to 2021 the volume increased by € 1.0 billion in line with the overall portfolio growth of the German mortgages. In Germany, the bank owns additional insurance against natural hazards, which provides further safeguard against physical risks. Acute physical risks to clients’ assets and collateral are also considered in the assessment of Commercial Real Estate credit risk exposures. Physical risks to real estate collateral are addressed primarily through the requirements outlined in the bank’s Credit Policies and Process Guides, which prescribe financed properties to be adequately and appropriately insured. The assessment of insurance requirements considers the potential impact of natural disasters, such as storms, floods, and earthquakes. Similar requirements are also in place for other physical collateral, including large movable assets (such as airplanes and ships) and smaller assets (such as cars and machines). The assessment is documented by means of the Capital Requirements Regulation’s compliance checklists. Insurance coverage on loan collateral is monitored on a regular basis, including by means of onsite inspections. Additional disclosures around exposures to physical risks are included in the bank’s Pillar 3 Reporting 2022. Market risk As part of the Market Risk Identification process individual business lines are asked to consider forward-looking and/or idiosyncratic material risks including climate and other ESG risks, which must be included in the Market Risk identification documentation. Climate-related risks are currently managed within the existing market risk framework and treated as a price trigger, in the same way as market events such as central bank announcements or earnings announcements. Market risk monitors and reports “brown” exposure (as per Deutsche Bank’s climate risk taxonomy) and financed emissions in its traded credit portfolio. The report provides granular views required for business management of exposures. 43
Deutsche Bank Transition toward a sustainable and climate-neutral economy Non-Financial Report 2022 Climate risk Liquidity risk Deutsche Bank uses stress testing and pathway analysis to assess the impact of climate risk on liquidity. In particular, the bank’s stressed Net Liquidity Position scenarios, that are run on a daily basis, include climate disasters as possible triggers of stress (physical risks). In 2022 the bank also developed and ran an internal climate stress test on liquidity, discussed in section “Scenario analysis and stress testing” of this chapter. Physical climate risk is covered by the bank’s stressed Net Liquidity Position liquidity risk appetite, as one of the possible triggers that is modelled for liquidity risk events. Work done on physical risk shows that these risks are in most reasonable cases smaller than other risks that the bank daily reserves liquidity for. Transition risk, which is expected to develop incrementally over many years, will be managed through the Group’s annual funding planning processes. Non-financial risk / Operational risk Non-Financial Risk Management integrates climate-related and broader ESG drivers into certain aspects of its Operational Risk Management Framework. In 2022, an ESG flag was introduced to the taxonomy of sub-risk types under the overarching risk type “operational risk” to identify those sub-risk types where ESG is considered a key risk driver. This flagging will form part of regular reviews of the taxonomy. The integration efforts further progressed in 2022 through a new ESG driven risk review, which was used as an input into the regular risk & control assessment exercise carried out globally across divisions. This review will also help inform further integration activities in the Operational Risk Management Framework. In line with the Operational Risk Management Framework, risk identification takes place through analysis of past internal and external operational risk events. Exploratory scenario analysis is also used to analyze potential event situations and the effectiveness of related controls to identify areas for further risk mitigation and strengthening of the control environment. This library of scenarios included, for example, scenarios on physical risk (e.g., extreme weather events impacting the bank's data centers) as well as on Sustainable Finance products. In the materiality assessment of climate and environmental risks conducted in 2022 (described earlier in this chapter), the core transmission channels for Operational risk were identified as (i) direct damage or unavailability of service to clients as a result of physical risk impacts from extreme weather events and (ii) ESG-related liability consequences, which can amongst others, result from greenwashing. In order to mitigate physical risk impacts on its operations, Deutsche Bank has a long-standing Business Continuity Management framework in place which employs an all-hazards approach. This framework requires the 1st Line of Defense to conduct a Business Impact Analysis for the disruption of their processes/services and develop and regularly test recovery strategies for mandatory Business Continuity Management planning scenarios (such as loss of facility, pandemic / unavailability of staff, loss of business application, loss of 3rd Party, tested regardless of the root cause of the disruption). Business Continuity related scenario libraries and other framework documentation including Risk Appetite Statements are regularly reviewed and cover explicitly climate-related scenarios for some areas. These include: – The Business Continuity Management and Crisis Management Policy includes planning scenario examples for a) loss of primary production facility, b) significant staff unavailability and c) loss of third party – The bank’s city-wide outage planning demands yearly exercises in service center locations such as India, Philippines & Jacksonville, where climate-related scenarios are prevalent – In the severe scenario narrative library, a climate change & natural hazard driver is included among the emergency risk drivers – As part of the existing Business Continuity Management program, the bank has established hazard /region specific plans such as the Hurricane Plans for the Americas Region Regulators have increased their scrutiny on the topic of “greenwashing” (i.e., where companies are considered to obtain an unfair competitive advantage by inaccurately portraying, exaggerating or misleading the selling of and/or contents of products, or their general image, as being ‘environmentally friendly’, green or sustainable). Stringent controls are considered to be a key element to prevent and mitigate the risk of greenwashing. Analysis is therefore underway to review the greenwashing-related regulatory landscape, external events, impacted risk types and internal controls. In addition, work was kicked-off in 2022 that focuses on triggers of potential ESG-related litigations. The outcome of these analyses as well as the business-run ESG driven risk review will be used, where applicable, to enhance the control environment in 2023. Addressing this risk in an adequate manner supports: – Investors’ and society’s trust in the financial industry to support the transformation of the economy towards de-carbonization and sustainability, as envisaged by the European’s Commission Action Plan on Sustainable Finance – Protection of Deutsche Bank’s reputation – Mitigation of the risk of regulatory enforcement or civil litigation 44
Deutsche Bank Transition toward a sustainable and climate-neutral economy Non-Financial Report 2022 Climate risk The management of reputational risk arising from climate-related risks is covered extensively in the following chapter of this report, “Environmental and social due diligence”. Scenario analysis and stress testing The bank participated in the 2022 climate risk stress test of the European Central Bank. In preparation for the exercise, the bank’s stress test methodology workstream developed methodologies for assessing portfolio impacts under the ECB’s set of scenarios. These scenarios included transition risk scenarios for credit (long and short term) and market risk (short term only), and physical risk scenarios, for credit risk only. The three long term scenarios, based on the scenarios of the Network for Greening the Financial System with a time horizon spanning to 2050, were: – An orderly scenario, which assumes an orderly transition with a smooth reduction in CO emissions to achieve the carbon 2 emission goals by 2050 – A disorderly scenario, which assumes a disorderly transition in which CO emissions decrease slowly until 2030, and 2 causing a disorderly transition in the following years to achieve the emission targets by 2050 – A hot house scenario, which assumes a world in which CO emissions are not reduced and the economy is confronted with 2 the materialization of increasing physical risks, resulting in GDP losses Physical risks scenarios tested the impact of droughts and heat for uncollateralized corporate lending, and the impact of floods for lending secured by real estate in Europe. Workstreams are in place to further develop internal climate risk modelling capabilities and integrate into internal stress testing and scenario analysis. In 2022 the bank also developed and ran an internal climate stress test on liquidity. The exercise included different scenarios: – Transition risk scenarios from the Network for Greening the Financial System (Net Zero 2050 Orderly, and delayed transition scenarios), with a 30-year time horizon – Physical risk scenario of extreme flood, with a 6-month time horizon – Reputational Risk scenario, with a 1-year time horizon Risk metrics and targets Financed emissions and exposure to carbon related assets The key metrics used to assess transition risk in the bank’s portfolios are carbon intensity and financed emissions. The bank estimates and monitors financed emissions using the standard from the Partnership for Carbon Accounting Financials and in line with the recommendations of the Task Force on Climate-related Financial Disclosures (see their Guidance on Metrics, Targets, and Transition Plans). The analysis is based on disclosed Scope 1 and 2 emissions of Deutsche Bank’s clients, for which the bank often relies on third-party providers, and on sectoral average emission factors where client data are not available. This emissions data is mapped to the bank’s loan exposure / commitments and clients’ enterprise values to estimate financed emissions and carbon intensity at client and portfolio level. For selected mortgage and commercial real estate portfolios, emissions are estimated using proxies based on Energy Performance Certificate ratings and internal methodologies. Overall corporate industry loan exposure, as well as loan exposure and financed emissions for the sectors which contribute the largest amount to Deutsche Bank’s Scope 1 and 2 financed emissions are disclosed in the tables below. The tables display, in descending order, the top 10 sectors by Financed Emissions calculated on a Total Commitments basis. The differences in sectors shown in the 2021 and 2022 tables are due to changes of the composition of the bank’s corporate lending portfolio. 45
Deutsche Bank Transition toward a sustainable and climate-neutral economy Non-Financial Report 2022 Climate risk Loan exposure and financed emissions of the corporate lending book Dec 31, 2022 Financed Emissions PCAF Data Quality Score Loan Exposure (Scope 1&2, Mt CO e/y) (5 = lowest) 2 Total Total Outstanding Total Commitments Outstanding Commitments Outstanding Commitments € bn.1 % € bn. % Total Corporate Industry Loan 106.6 100.0 258.2 100.0 30.5 56.7 4.3 3.7 Exposure thereof: Oil and Gas 6.5 6.1 15.2 5.9 10.4 14.7 4.5 3.8 thereof: Utilities 4.2 4.0 13.1 5.1 5.1 12.1 4.0 3.2 thereof: Steel, Metals and 4.3 4.0 7.8 3.0 3.3 4.9 3.7 3.5 Mining thereof: Consumer Goods 13.3 12.5 27.6 10.7 1.8 3.5 4.1 3.6 thereof: Chemicals 3.1 2.9 10.9 4.2 0.8 3.4 4.2 3.3 thereof: Manufacturing and 11.9 11.2 29.0 11.2 1.0 3.0 4.4 3.9 Engineering thereof: Construction 3.6 3.3 8.9 3.4 0.9 2.8 4.6 4.4 thereof: Conglomerates 3.8 3.6 5.0 2.0 1.5 1.9 4.6 4.6 thereof: Transportation - 1.1 1.0 1.4 0.5 1.3 1.7 4.9 4.9 Shipping thereof: Healthcare 6.5 6.1 25.8 10.0 0.5 1.4 4.2 3.1 thereof: Others2 48.3 45.3 113.5 44.0 3.8 7.3 4.4 3.8 In the scope of net zero targets Oil and Gas (Upstream) 9.3 10.9 3.3 Power Generation 10.4 10.7 3.0 Automotives (Light Duty) 7.7 0.4 2.2 Steel 1.9 2.9 3.3 Dec 31, 2021 Financed Emissions PCAF Data Quality Score Loan Exposure (Scope 1&2, Mt CO e/y) (5 = lowest) 2 Total Total Outstanding Total Commitments Outstanding Commitments Outstanding Commitments € bn.1 % € bn. % Total Corporate Industry Loan 103.2 100.0 246.9 100.0 31.0 58.8 4.3 3.8 Exposure thereof: Oil and Gas 8.2 7.9 15.9 6.4 10.0 16.1 4.1 3.8 thereof: Utilities 4.5 4.4 12.6 5.1 6.5 13.2 3.7 3.2 thereof: Steel, Metals and 4.3 4.1 8.3 3.3 3.6 6.6 3.8 3.7 Mining thereof: Chemicals 2.7 2.6 9.7 3.9 0.9 3.6 4.3 3.5 thereof: Consumer Goods 12.0 11.6 26.6 10.8 1.8 3.0 4.0 3.5 thereof: Manufacturing and 9.3 9.0 26.5 10.7 0.9 2.6 4.4 3.9 Engineering thereof: Healthcare 10.9 10.6 26.2 10.6 1.7 2.6 4.7 3.7 thereof: Construction 3.1 3.0 8.1 3.3 0.7 2.0 4.6 4.5 thereof: Transportation - 2.9 2.9 6.0 2.4 0.9 1.4 4.6 4.2 Others thereof: Automotives 7.3 7.0 17.7 7.2 0.5 1.4 3.7 3.5 thereof: Others2 38.0 36.8 89.3 36.2 3.6 6.2 4.4 3.9 In the scope of net zero targets Oil and Gas (Upstream) 10.7 13.5 3.4 Power Generation 9.7 11.3 3.0 Automotives (Light Duty) 7.5 0.5 2.3 Steel 2.1 3.6 3.1 1 Excludes, for both 2021 and 2022, € 1.6 billion securitized aviation loans where the standard cannot be applied. The value shown for 2021, of € 103.2 billion, amends the amount reported in the 2021 Non-Financial Report of € 104.8 billion, where securitized aviation loans were incorrectly included in the figure. 2 Includes Retail, Technology, Telecoms, Services, Leisure, Media, Aerospace and Defense Deutsche Bank’s Scope 1 and 2 financed emissions of its total corporate lending book reduced from 58.8 to 56.7 MtCO2e/y on a total commitments basis and reduced from 31.0 to 30.5 MtCO2e/y on a loan outstanding basis. Reductions came despite total loan commitments increasing from € 246.9 billion to € 258.2 billion and reflect an 8% reduction in the overall portfolio emissions intensity on a committed basis. The largest reductions were observed in carbon intensive sectors such as Oil and Gas, Utilities and Steel, Metals and Mining due to falling loan commitments and / or rebalancing towards clients with lower emission intensities. 46
Deutsche Bank Transition toward a sustainable and climate-neutral economy Non-Financial Report 2022 Climate risk Other significant factors were (at the total corporate lending level and on a total loan commitment basis): (i) client specific emission factors decreasing due to rising Enterprise Values including cash (EVICs) from 2020 to 2021 which led to a financed emissions reduction of 1.3 MtCO2e/y; (ii) client’s moving from proxy to client specific emission factors which led to a financed emissions reduction of 1.4 MtCO2e/y; and (iii) FX translation effects of the euro equivalent loan exposures which led to a financed emissions increase of 1.7 MtCO2e/y, due to U.S. dollar strengthening versus the euro from year end 2021 to year end 2022. In Q3 2022, the bank’s financed emissions methodology moved to a new ESG data provider in order to derive client specific emission factors and the bank has decided to restate its baseline year for financed emissions for fairer year-on-year comparison. The resultant impact was minimal being at the total corporate lending level a financed emissions reduction of 0.9 MtCO2e/y on a total loan commitment basis and a financed emissions increase of 0.5 MtCO2e/y on a loan outstanding basis. To allow for the monitoring of climate risk metrics in the bank’s portfolio, the Group Risk Committee, the Enterprise Risk Committee, and the Group Sustainability Committee receive a quarterly climate risk report that includes financed emissions, exposure to carbon-intensive sectors, alignment with portfolio decarbonization targets and other climate risk-related topics, including key industry and regulatory developments. Methodological note on the financed emissions tables: financed emissions are calculated both on a loan outstanding and on a total commitment basis, while the values disclosed in the Non-Financial Report 2021 were calculated on a loan outstanding basis only. Estimates of financed emissions on a total commitment basis have been added to align with the approach used for the bank’s decarbonization targets. Financed emissions shown in this report rely on MSCI data and the emissions factors of the Partnership for Carbon Accounting Financials (“PCAF”). Differences in the datasets of MSCI and Refinitiv, which was used for last year’s report, resulted in differences in the 2021 financed emissions figures shown on a loan outstanding basis in the two reports (and in differences in PCAF’s Data Quality Scores). PCAF Data Quality Scores are calculated according to the rules outlined in the Global GHG Accounting and Reporting Standard for the Financial Industry, published by the Partnership. Current scores reflect the extent to which sectoral proxy estimates were utilized in the calculation of Financed Emissions and are an indication of the challenges that the bank and the industry still face with getting access to consistent and audited client specific climate risk data. More information on Deutsche Bank’s application of the PCAF standard can be found in the bank’s White Paper Towards Net Zero Emissions (*). Net zero targets In October 2022 Deutsche Bank published quantitative 2030 (interim) and 2050 (final) decarbonization targets for four carbon intensive sectors. Deutsche Bank uses the Net Zero Emissions by 2050 scenario of the International Energy Agency as a basis for target setting, with methodologies largely based on that of the Paris Agreement Capital Transition Assessment. The Net Zero Emissions by 2050 scenario has the benefit of being consistent with limiting global warming to no more than 1.5 degree Celsius above pre-industrial levels by 2100 and of complying with the guidelines of the Net-Zero Banking Alliance. Since Deutsche Bank’s publication of decarbonization approaches in March 2021, the work around pathway alignment in the industry evolved significantly. For this reason, the bank decided to make selective amendments to the original methodologies expressed in the March 2022 White Paper Towards Net Zero Emissions (*) , the most significant of which is the use of absolute Scope 3 financed emissions for the oil & gas target (which was originally intensity-based). Targets for the other three in-scope sectors are based on physical intensity metrics. The bank’s decarbonization targets are fully integrated into Deutsche Bank’s risk appetite and broader risk management framework. The bank also uses additional, sector-specific, key performance indicators to monitor and steer climate risk across its portfolios. Examples of these indicators are Scope 1 and 2 absolute emissions (for outstanding loans and commitments), technology mixes and the share of clients with reported net zero targets. 47
Deutsche Bank Transition toward a sustainable and climate-neutral economy Non-Financial Report 2022 Climate risk Alignment to net zero targets Baseline Dec 31, 2021 Total loan commitment (€ Sector Scopes Covered Metric Year bn) Metric value Oil and Gas (Upstream) Scope 3 MtCO /y 2021 10.7 23.4 2 Power Generation Scope 1 kgCO2e/MWh 2021 9.7 359 Automotives (Light Duty) Scope 3 gCO /vkm 2021 7.5 190 2 Steel Scopes 1&2 kgCO e/t steel 2021 2.1 1,519 2 Dec 31, 2022 Change in 2022 Target Total loan Total loan commitment commitments Sector (€bn) Metric value (%) Metric value (%) Dec 31, 2030 Oil and Gas (Upstream) 9.3 16.6 (12.6) (28.9) 18.0 Power Generation 10.4 354 7.2 (1.6) 112 Automotives (Light Duty) 7.7 188 1.8 (1.4) 77 Steel 1.9 1,495 (7.4) (1.6) 1,004 Oil and Gas (Upstream): Scope 3 financed emissions stood at 16.6 MtCO /y as of year end 2022 which represents a 29% 2 year-on-year reduction. This significant decline is predominantly explained by three main drivers: (i) total loan commitments decreased from € 10.7 billion to € 9.3 billion due to exit of Russia clients following the war in Ukraine and selected larger reductions to key clients which led to financed emissions reducing by 5 MtCO /y; (ii) client emission factors (tCO /€m) falling 2 2 due to EVIC or total assets rising substantially from 2020 to 2021 which led to financed emissions reducing by 2.8 MtCO /y; 2 and (iii) loan exposure FX translation effects from 2020 to 2021 predominantly driven by U.S. dollar appreciating versus the euro which led to financed emissions increasing by 1.0 MtCO /y. 2 The bank expects the metric to remain volatile due to factors outside of its control such as the evolution of clients’ EVIC or total assets which are key inputs into the calculation of clients’ Scope 3 emission factors. Power Generation: The Scope 1 physical emission intensity of Deutsche Bank’s Power Generation portfolio was 354 kgCO2e/MWh as of year end 2022, 1.6% lower year-on-year. The reduction came despite loan commitments increasing year-on-year from € 9.7 billion to € 10.4 billion as client liquidity needs increased due to the European energy crisis and reflects a general improvement in the average physical emissions intensity of the portfolio. The bank’s data provider Asset Impact (formerly known as Asset Resolution) introduced significant improvements to their Power Generation methodology resulting in more accurate representation of asset level information of Deutsche Bank’s clients. In order to allow for meaningful year-on-year comparison, Deutsche Bank has decided to restate its baseline metric which led to an increase of 39 kgCO e/MWh. 2 Automotive (Light duty): The Scope 3 physical emission intensity of Deutsche Bank’s Automotive portfolio was 188 gCO2/vkm as of year end 2022, 1.4% lower year-on-year. Loan commitments increased slightly from € 7.5 billion to € 7.7 billion. Steel: The Scope 1 and 2 physical emission intensity of Deutsche Bank’s Steel portfolio was 1,495 kgCO e/ t as of year end 2 2022, falling 1.6% year-on-year. The decline in emissions intensity was less pronounced than the 7.4% drop in loan commitments due to the portfolio weighted approach followed by the PACTA methodology. The data provider Asset Impact also introduced significant improvement to their Steel methodologies and as such the bank has decided to restate its baseline estimate which led to an increase of 336 kgCO e/ t steel allowing for fairer year-on-year 2 comparison. 48
Deutsche Bank Transition toward a sustainable and climate-neutral economy Non-Financial Report 2022 Climate risk Engagement in climate-related initiatives GRI 3-3, FS5 Deutsche Bank is actively involved in industry initiatives on climate and other ESG risks. Deutsche Bank is a founding member of the Net-Zero Banking Alliance, which aims at mobilizing the trillions of euros necessary to establish a global zero-emission economy and meet the Paris Agreement’s targets. The bank participates in several working groups of the alliance, whose purpose is to develop consistent international standards to drive the implementation of decarbonization strategies, for example for oil & gas and for real estate. Following on the climate commitment of the German financial sector, Deutsche Bank is also engaged in the local market within working group of the Net Zero Banking Alliance Germany. The bank is also active in projects of the United Nations Environment Programme Finance Initiative, such as the working group of the Energy Efficiency Financial Institutions Group on “Risk assessment: the quantitative relationship between energy efficiency improvements and lower probability of default of associated loans and the increased value of the underlying assets.” In addition, Deutsche Bank has participated in a number of working groups of the Partnership for Carbon Accounting Financials, such as the working groups on sovereign exposure, capital market instruments, climate data as well as in local working groups for real estate. The bank is also represented in the Science Based Targets Initiative’s Net-Zero Expert Advisory Group, which includes financial institutions, consultants, non-governmental Organizations and academic institutions, and advises the initiative on the development of their Net-Zero framework. More recently, in recognition of the increasing focus of the industry on other environmental risks, Deutsche Bank also joined the consultative forum of the Task Force on Nature-related Financial Disclosures. The initiatives aim at developing and delivering a risk management and disclosure framework for organizations to report and act on evolving nature-related risks, with the ultimate aim of supporting a shift in global financial flows away from nature-negative outcomes and toward nature- positive outcomes. In Q4 2022 Deutsche Bank also joined a pilot, led by the United Nations Environment Programme Finance Initiative, on the implementation of the draft framework of the task force. 49
Deutsche Bank Transition toward a sustainable and climate-neutral economy Non-Financial Report 2022 Climate risk Climate risk in Asset Management GRI 3-3, FS5 For DWS, the bank’s Asset Management arm, climate risks mainly arise from its fiduciary activity. Therefore, DWS aims to measure, analyze, and manage material risks and opportunities that may impact its clients’ investments and to make its clients aware of these issues to enable them to make sustainable investment decisions. At the same time, DWS seeks to manage the impact of its business activities on the environment and society in which it operates. Governance GRI 2-9/13, 3-3 Climate risk governance is fully embedded in the sustainability governance of DWS. For details, please refer to the chapter “Sustainable finance – Asset Management – Overview”. Risk management strategy and processes GRI 2-13, 3-3, 201-2, FS3 As fiduciaries, it is the asset manager’s duty to measure, analyze and manage all material risks and opportunities of its investments - including climate-related risks and opportunities. DWS integrates climate-related risks, alongside other sustainability-related risks, into the existing corporate and investment risk measurement and management frameworks. The DWS approach on integration of climate-related risks in the risk management strategy and processes has been formalized within a dedicated Sustainability Risk Management Policy. Within the revised version of this policy, ESG risk themes impacting DWS group as well as the interaction of such ESG risk themes on corporate and investment risks has been documented. Furthermore, ESG risk theme strategies have been allocated to the identified ESG risk themes to provide strategic guidance on the implementation of climate risk management processes. In addition to and in alignment with the above, DWS risk management has continued the integration of climate-related risks in corporate and investment risk processes. The integration activities resulted amongst others in the implementation of dedicated processes for climate-related investment risk across the product ranges in Europe, Middle East and Africa as well as the integration of climate-related risks – and other sustainability risks – in risk assessment processes. Furthermore, the integration of climate-related risks in the risk appetite statement has been evolving. Within a revision of the DWS risk appetite statement performed in 2022, dedicated qualitative statements as well as quantitative indicators have been formulated addressing climate and sustainability related adverse impacts, financial and strategy risks, non-financial risks and investment risks. DWS approach to Net Zero GRI 2-23, 3-3, 305-1/2/4, FS5 DWS is committed to become climate-neutral in its actions well ahead of 2050 and has substantiated this by being a founding (*). This initiative sees asset managers commit to support the goal of net member of the Net Zero Asset Managers initiative zero greenhouse gas (GHG) emissions by 2050 or sooner in line with global efforts to limit warming to 1.5°C. To make this commitment tangible, DWS has set an operational interim target for 2030, aiming to reduce Scope 1 and 2 emissions on defined assets by 50% in 2030, compared to the base year 2019. The target setting utilized the Science Based Targets Initiative framework which is considered a credible and robust foundation. Based on this approach, DWS has initially put 35.4% or € 281.2 billion of its total AuM as per December 31, 2020, in scope to be managed towards net zero (subject to the consent of clients, legal entities, and fund boards). As of December 31, 2021, 38.6% or € 358.0 billion AuM are in scope of net zero. In 2022 DWS reported a 6.3% reduction in the inflation adjusted “net” Weighted Average Carbon Intensity of the assets in- scope. By comparison, the Weighted Average Carbon Intensity of the MSCI All-Country World Index over the same year saw an inflation adjusted decline of just 0.3%. The non-inflation adjusted “gross” Weighted Average Carbon Intensity reduction was 7.4%, i.e., 1.2% of the reduction was inflation driven. The Weighted Average Carbon Intensity is currently only calculated for liquid in-scope AuM where carbon data is available from current vendors. Illiquid assets in scope for net zero (€ 29.3 billion as of year end 2021) are currently not part of the Weighted Average Carbon Intensity calculation. The 6.3% decrease is derived as follows: (1-7.4%) x (1+1.2%)-1=-6.3%. 50
Deutsche Bank Transition toward a sustainable and climate-neutral economy Non-Financial Report 2022 Climate risk DWS will continue to work with organizations and initiatives to further evolve existing standards and to set new standards, specifically with the Paris Aligned Investment Initiative and the Net Zero Asset Owner Alliance. Over the forthcoming years, DWS aims to further work with clients, fund boards and legal entities on its decarbonization goals and to put more assets in scope step by step in line with further regulation and evolving methodologies. In 2023 DWS aims to adopt and implement a coal policy as a next step to deliver on its net zero commitments and act in accordance with the Net Zero Asset Managers initiative. To support those activities and to ensure a seamless implementation of net zero targets for in-scope assets and its operations DWS has established a dedicated net zero governance framework. The commitment towards net zero is also reflected in new product launches; in 2022 DWS launched seven dedicated Net Zero Pathway, Paris aligned Exchange Traded Funds. 51
Deutsche Bank Transition toward a sustainable and climate-neutral economy Non-Financial Report 2022 Environmental and social due diligence Environmental and social due diligence –First-time disclosure of transactions in scope of the Equator Principles –Continuing environmental and social reviews of transactions and clients GRI 3-3 Being a global bank supporting various sectors of the economy Deutsche Bank can be potentially linked or exposed to negative environmental and social impacts and risks. The bank has committed to understand the environmental and social challenges and risks associated with a transaction or client and has developed robust frameworks and systematic risk evaluation processes. Regarding environmental and social risks, the bank’s management process is summarized in the “Climate risk” chapter and in the “Environmental and social policy framework” section of this chapter. This latter Framework in turn is an integral part of the bank’s Reputational Risk Framework. The governance associated with the latter is described in the following section. Governance GRI 2-9/12/13/23/24/25, 3-3 The purpose of the bank’s Reputational Risk Framework is to prevent damage to the bank’s reputation by stipulating the process by which Deutsche Bank makes decisions – in advance – on matters that may pose a reputational risk. The framework provides consistent standards for the identification, assessment, and management of reputational risks. Reputational risks that may arise from a failure relating to another risk type, control, or process are managed separately by means of the relevant risk framework and are therefore not discussed in this section. All employees are responsible for identifying potential reputational risks and reporting them by means of the Unit Reputational Risk Assessment Process (Unit RRAP). Through the Unit Reputational Risk Assessment Process relevant stakeholders are consulted for input, such as country management, key control functions, and other second-line subject matter experts. The Unit Reputational Risk Assessment Process is chaired by a business division’s relevant senior manager and applies to all matters deemed to pose moderate or greater reputational risk. If a matter is considered to pose a material reputational risk and/or meets one of the bank’s mandatory referral criteria, it is referred for further review to the relevant Regional Reputational Risk Committee. In exceptional circumstances, matters are referred to the Group Reputational Risk Committee. This may be the case if a matter is declined by the Regional Reputational Risk Committee and appealed by the business division, or if the Regional Reputational Risk Committee cannot reach a two- thirds majority decision. Matters specific to DWS are reviewed by a DWS reputational risk committee and, if necessary, reported to the DWS Executive Board. Matters assessed through the Reputational Risk Framework Dec 31, 2022 Dec 31, 2021 Dec 31, 2020 Number of matters reviewed (on which final decisions have been made) To Unit Reputational Risk Assessment Processes only 71 81 104 Thereof with ES issues 9 14 7 Thereof with gaming-related issues 1 3 0 Thereof with defense-related issues 2 3 6 To Regional Reputational Risk Committees 34 49 64 Thereof with ES issues 6 3 3 Thereof with gaming-related issues 2 1 6 Thereof with defense-related issues 4 1 8 To Group Reputational Risk Committee or above 5 6 3 Thereof with ES issues 2 4 0 Thereof with gaming-related issues 0 1 0 Thereof with defense-related issues 1 0 1 Total 110 136 171 Thereof with environmental and social issues 17 21 10 Thereof with gaming-related issues 3 5 6 Thereof with defense-related issues 7 4 15 The Reputational Risk Team provides monthly updates on reputational risk topics to the Regional Reputational Risk Committee chairs and secretaries of the Unit RRAPs, as well as quarterly updates to the Group Reputational Risk Committee and Regional Reputational Risk Committees. The Risk and Capital Profile report, which includes updates on reputational risks, is distributed on a monthly basis to the Management Board and on a quarterly basis to the Supervisory Board. It includes details such as the number of reputational risk issues assessed by the various committees and their decisions. 52
Deutsche Bank Transition toward a sustainable and climate-neutral economy Non-Financial Report 2022 Environmental and social due diligence The Reputational Risk Framework stipulates that certain matters, including those with a potential negative ES impact and those matters linked to the defense or gaming industry, must be reviewed by subject matter experts. These matters are discussed in more detail in the sections below. Environmental and Social Policy Framework GRI 2-23/24/25/27, 3-3, FS1, FS3 Deutsche Bank’s environmental and social due diligence provisions are an integral part of the bank’s Reputational Risk Framework. The environmental and social due diligence provisions consist of cross-sectoral and sector-specific requirements outlined in respective guidelines and they jointly form the Deutsche Bank Environmental and Social Policy Framework. A summary of this Framework (*) is publicly available and was approved by the Group Reputational Risk Committee. The Framework applies to lending and trade finance activities of Corporate Bank and lending and capital market activities of Investment Bank as well as to Private Bank’s commercial lending activities. It does not apply to DWS as DWS operates as a separate legal entity that sets its own sustainability strategy. The Environmental and Social Policy Framework defines rules and responsibilities for risk identification, assessment, and decision-making, and specifies the requirements for environmental and social due diligence. Deutsche Bank applies a risk- based approach and focusses its attention on sectors that it has defined as having an inherently elevated potential for negative environmental and social impacts, see below. The bank familiarizes its employees with the criteria for the mandatory referral of transactions and clients to the bank’s Group Sustainability function. Employees have access to detailed sector-specific guidelines for all sectors requiring mandatory referral to Group Sustainability. Environmental and social issues deemed to pose at least a moderate reputational risk are subject to the reputational risk assessment process as well. Deutsche Bank’s approach to environmental and social due diligence is guided by the following international standards and principles that include: – UN Global Compact – OECD Guidelines for Multinational Enterprises and associated Responsible Business Conduct standards for the financial sector – UN Guiding Principles on Business and Human Rights – International Finance Corporation Performance Standards – Equator Principles Deutsche Bank participates in a variety of initiatives and working groups to enhance its knowledge of existing and emerging issues and to inform its approach to environmental and social due diligence. In 2022, through its membership in the University of Cambridge Initiative for Sustainability Leadership’s Banking Environment Initiative (*), the bank continued to participate in the initiative’s activities around nature- and climate-related issues. For instance, in 2022, Deutsche Bank contributed to a capacity building workshop on assessing nature-related financial risks by presenting use cases related to the EU’s Farm to Fork Strategy and fertilizer companies. In addition, in 2022, Deutsche Bank partnered with German-based Mannheim Business School on a project focusing on biodiversity. A group of MBA students analyzed current biodiversity-related challenges and opportunities. They formulated recommendations for the further incorporation of biodiversity considerations into the bank’s environmental and social due diligence requirements. Deutsche Bank’s Environmental and Social Policy Framework has defined the following sectors and activities as having an inherently elevated potential for negative environmental and social impacts: – Metals and mining including thermal coal mining – Oil and gas – Utilities including thermal coal, hydro and nuclear power – Industrial agriculture and forestry – Chemicals – Industrials and infrastructure projects in certain countries – Other activities either with a high carbon intensity and/or potential for human rights infringements Other industries and sector-specific topics, such as the defense, gaming, and adult entertainment industry, which are inherently considered to carry an enhanced level of social and governance risk, and potentially environmental risk, are covered by the Reputational Risk Framework. Due to geopolitical developments in 2022, there was an increased focus on the defense sector while topical issues such as the digital asset and crypto currency sector as well as tobacco and cannabis were also discussed. Details on the Reputational Risk Framework are presented in the “Governance” section above, and specific due diligence requirements of the mentioned sectors are summarized in the table entitled “Main positions and minimum standards of the environmental and social due diligence” below. 53
Deutsche Bank Transition toward a sustainable and climate-neutral economy Non-Financial Report 2022 Environmental and social due diligence The enhanced environmental and social due diligence requirements address sectoral issues as well as cross-sectoral issues like biodiversity or social issues. The bank reviews the scope of sectors as well as related due diligence requirements on a best effort basis. It also observes prevailing sector-related environmental and social standards and industry best practices in order to improve understanding of environmental and social issues and, if necessary, adjust its approach. The bank’s assessment also takes into account developments in this area, such as climate protection and the respect of human rights. Main positions and minimum standards of environmental and social due diligence1 Enhanced due diligence/norm 2 Area compliance Environmental and/or social principles applied Cross-sectoral Human rights Yes No engagement in business activities where the bank has substantiated evidence of material 3 adverse human rights impacts without appropriate mitigation, e.g., child and forced labor Deforestation Yes No direct involvement in deforestation of primary tropical forests World Heritage Sites Yes No activity within or in close proximity to World Heritage Sites, unless the respective government and UNESCO agree that such activity will not adversely affect the site’s outstanding universal value Sectoral Industrial agriculture and forestry Yes Soft commodities (soy, beef, timber): expectations regarding membership in certification as well as environmental and social management schemes for growers and primary processers, including public commitment to the “No Deforestation, no peat, no exploitation” standards New development of related lands is only permissible if a High Conservation Value assessment determines that the land is not High Conservation Value Palm oil Yes Minimum requirement of a time-bound implementation plan for Roundtable on Sustainable Palm Oil-certification by 2025 at the latest Metals and mining Yes Enhanced environmental and social due diligence requirements; potential exclusions based on outcome Oil and gas Yes Oil sands: no financing of new projects involving exploration, production and transport/processing Arctic region (as demarcated by the 10° C July Isotherm boundary): no financing of new oil and gas projects Oil and gas extracted by means of hydraulic fracturing: no financing of projects in countries with ‘extremely high’ water stress Coal power and mining Yes No financing of new coal power plants and new thermal coal mining projects or associated infrastructure No financing of thermal coal mining from 2025 onward for clients in scope of the policy Exclusions for financing mountaintop removal mining Hydropower Yes Enhanced environmental and social due diligence requirements; potential exclusions based on outcome Nuclear energy Yes Enhanced environmental and social due diligence requirements; potential exclusions based on outcome and exclusion for certain jurisdictions Tobacco Yes Enhanced due diligence requirements with a focus on e-cigarettes and cannabis; potential exclusions based on outcome Defense/controversial weapons Yes Enhanced due diligence requirements with exclusions including controversial weapons, conflict countries, private military security companies, as well as civilian use automatic and semi- automatic firearms and human-out-of-the-loop weapon systems Adult entertainment Yes Enhanced due diligence requirements; exclusion of any business directly associated with adult entertainment (commercial enterprises related to the sale or purchase of sex-related services, ranging from individual workers in prostitution to the pornographic entertainment industry), associated branded products or services or prostitution Gaming Industry Yes Enhanced due diligence required; exclusion of online gambling Business-to-Consumer operators with exposure to markets where gambling is prohibited 1 The detailed requirements are laid out in Deutsche Bank’s Environmental and Social Policy Framework, except for Tobacco, Defense, Adult entertainment and Gaming which are covered by the relevant Reputational Risk documents 2 In addition to the cross-sector and sector-specific principles described above, Deutsche Bank’s enhanced environmental and social due diligence process includes, but is not limited to, the following reviews: compliance with existing environmental and social laws and regulations; existence of robust governance structures and sufficient capacity for managing ES issues 3 For further details, please also see the “Human Rights” below as well as Deutsche Bank’s Statement on Human Rights (*) Commitments, targets, and measures GRI 3-3, FS3 Deutsche Bank strives to manage all types of risk as effectively and efficiently as possible. This involves properly identifying transactions and/or clients that pose potential environmental and social risks, particularly in sectors with elevated environmental and social risk as internally defined and conducting robust due diligence. The bank also works to continually improve its environmental and social performance, in particular by verifying the effectiveness of its processes and guidelines and, if necessary, amending them, and by providing training to all relevant employees to reinforce their awareness and focus. The Group Sustainability function within the Chief Sustainability Office is responsible for designing standards and policies for environmental and social due diligence and sustainable finance and for overseeing business adherence to these. Headquartered in Frankfurt, Germany, the team expanded its regional presence to UK and Asia-Pacific in 2022. The bank also increased the number of environmental and social specialists in its business units. 54
Deutsche Bank Transition toward a sustainable and climate-neutral economy Non-Financial Report 2022 Environmental and social due diligence Building up on the policy in force since 2016, in March 2023 Deutsche Bank updated its thermal coal policy (*). In 2022, the bank began preparing a portfolio review of its coal clients in the Asia-Pacific region. The preparations included defining the scope of clients covered by the review as well as updating the related questionnaires. The review is scheduled to start in 2023. A similar review for coal power clients in the United States and Europe in 2021 led to insights into the clients’ progress with regard to their carbon footprint and existing transition plans. Building on this, a process for a client transition dialogue is being developed to support clients on their way to a more sustainable business model. In 2022, t he bank also continued to perform the systematic review of its global business activities in the Oil and Gas sector, set a target for Oil and Gas (upstream) to significantly reduce the volume of financed emissions (Scope 3) by 2030 for the sector, and started the dialog with its clients on their decarbonization strategies. These strategies along with clients’ carbon footprint are important criteria for how the bank continues to engage in this sector (see also the “Risk management strategy and processes” section of the “Climate risk” chapter). Deutsche Bank’s strategy, processes and progress as of year end 2022 regarding its commitment to align the bank’s portfolio with net zero by 2050 is outlined in the “Strategy” and “Risk management, metrics and targets” sections of the “Climate risk” chapter. Transactional reviews GRI FS3 Group Sustainability is responsible for designing environmental and social standards and policies, including the Sustainable Finance Framework, and overseeing business adherence. As part of its oversight responsibility, Group Sustainability conducts transactional and client reviews pursuant to the bank’s Environmental and Social and Sustainable Finance standards. For environmental and social due diligence, the number of reviews initiated in 2022 rose by approximately 45% compared with 2021. The strong increase by 89% of reviews related to metals and mining was an important driver. The overall review ratio increased to 31.2% (2021: 26.7%), mainly because of more deals meeting the internal referral criteria. 1 Transactions and clients reviewed under the Environmental and Social Policy Framework Dec 31, 2022 Dec 31, 2021 Dec 31, 2020 Number of transactions and clients by sector Metals and mining 176 93 94 Oil and gas 79 69 71 Industrials and infrastructure2 59 53 47 Industrial agriculture and forestry 59 27 30 Utilities 72 52 27 Chemicals 8 16 5 3 Other activities 8 7 10 Total reviews initiated 461 317 284 Number of transactions and clients on which final decisions have been made 403 248 222 Thereof approved 384 232 206 Thereof declined 12 5 8 Thereof referred to the respective committees 7 11 8 Thereof approved 6 9 8 Thereof declined 1 2 0 1 Please note that this table also includes the figures of the table “Transactions assessed under the Equator Principles”, see the section “Equator Principles”. 2 Includes engineering firms, equipment manufacturers, and other companies linked to sensitive sectors 3 Includes sectors with high carbon intensity and/or potential human rights violations. Examples include companies in the consumer goods, transportation, infrastructure, technology, commodity trading, and healthcare sectors whose supply chain exposes them to sensitive sectors An overview of transactions assessed under the Equator Principles can be found below in the “Equator Principles” section of this chapter. An overview of the deal classification reviews under the Sustainable Finance Framework is presented in the table “Transactions assessed under the Sustainable Finance Framework” in the section “Governance” of the “Sustainable finance” chapter. 55
Deutsche Bank Transition toward a sustainable and climate-neutral economy Non-Financial Report 2022 Environmental and social due diligence Training and awareness GRI 2-24, 3-3, 404-2, FS4 Training is essential to raise the bank’s employees’ awareness and enable them to better identify environmental and social risks and opportunities and consequently assess and refer transactions to Group Sustainability. In 2022, Deutsche Bank continued its employee training program. In 2022 front-office staff continued to receive live video-training to enable them to understand the Sustainable Finance Framework and to identify opportunities for clients to transition to more sustainable and climate friendlier business models. The sessions also address environmental and social related exclusions and expectations and specify the requirements for environmental and social due diligence. Details are presented in the section “Training and awareness” of the “Sustainable finance” chapter. Details on trainings on the Equator Principles can be found below in the “Equator Principles” section of this chapter. In 2022, the bank also continued to provide awareness sessions and training to control functions and business teams to reinforce their awareness of reputational risks such as defense and gaming. Equator Principles GRI 2-23/24/25, 3-3, 404-2, FS1, FS3, FS4 In February 2022, Deutsche Bank published its first Equator Principles Implementation Report (*) outlining its progress, due diligence process and responsibilities. This publication followed the bank’s formal adoption of the Equator Principles in July 2020. The Equator Principles are an internationally recognized benchmark for determining, assessing, and managing environmental and social risks in project finance. Training on and implementation of the Equator Principles in the bank’s due diligence processes continued in 2022. In 2022, 58 employees of the affected business teams were trained (2021: 53). In addition, Deutsche Bank continued developing internal training materials and due diligence templates accessible to all employees in the front office. The bank also updated several front- and back-office systems to capture Equator Principles transactions as well as set up an internal reporting process. As a signatory of the Equator Principles, Deutsche Bank is required to report on project-related transactions that fall within the scope of the Equator Principles. This information is included in the table below. Transactions assessed under the Equator Principles1 Project Finance Advisory Services Project Finance Project-Related Corporate Loans Category not applicable Category A Category B Category C Category A Category B Category C Sector Mining n/a 0 0 0 0 0 0 Infrastructure n/a 0 5 2 1 1 0 Oil & Gas n/a 2 1 0 0 0 0 Power n/a 0 8 0 0 0 0 Others n/a 0 0 0 0 0 0 Region Americas n/a 1 3 2 0 0 0 Europe, Middle East & n/a 0 6 0 1 1 0 Africa Asia Pacific n/a 1 5 0 0 0 0 Country Designation Designated Country n/a 1 12 2 0 0 0 Non-Designated n/a 1 2 0 1 1 0 Country Independent Review Yes n/a 1 3 1 1 0 0 No n/a 1 11 1 0 1 0 Total n/a 2 14 2 1 1 0 1 Please note that the figures of this table may also be included in the table “Transactions and clients reviewed under the ES Policy Framework”, see the sub-chapter “ES Policy Framework” The Equator Principles apply only to a limited number of transactions depending on the financial product, volume of transaction and in some cases if further criteria of eligibility are met. Eligible transactions are reported if they have reached financial close. Project categorization follows the International Finance Corporation’s (IFC) environmental and social categorisation process. Category A – projects with potential significant adverse environmental and social risks and/or impacts that are diverse, irreversible, or unprecedented. Category B – projects with potential limited adverse environmental and social risks and/or impacts that are few in number, generally site-specific, largely reversible, and readily addressed through mitigation measures. Category C – projects with minimal or no adverse environmental and social risks and/or impacts. 56
Deutsche Bank Transition toward a sustainable and climate-neutral economy Non-Financial Report 2022 Human rights Human rights – Enhancing the bank’s governance process on human rights – Updating the Statement on Human Rights – Preparing implementation of the German Supply Chain Due Diligence Act GRI 2-23/24/25/29, 3-3, FS3 While it remains the governments’ legal obligation to protect against human rights abuses by persons, including businesses, through appropriate policies, legislation, and adjudication, Deutsche Bank acknowledges its corporate responsibility pursuant to the “Protect, Respect and Remedy” framework of the UN Guiding Principles on Business and Human Rights. Deutsche Bank’s commitment to respecting human rights is anchored in the bank’s Code of Conduct (*), which was approved by the Management Board. The bank is guided by international standards and guidelines, such as: – UN Guiding Principles on Business and Human Rights (*) – International Labor Organization Declaration on Fundamental Principles and Rights at Work (*) including the International Labor Organization Core Labor Standards (*) – UN Global Compact (*) – OECD Guidelines for Multinational Enterprises (*) The core principle of the bank’s approach is to not engage in business activities where Deutsche Bank has substantiated evidence of material adverse human rights impacts and it is determined through Deutsche Bank’s internal processes that such adverse human rights impacts cannot be avoided or appropriately mitigated. Deutsche Bank’s Statement on Human Rights (*) describes its commitment and management approach in greater detail. The bank worked on a review of the Statement, which was published in March 2023, also to reflect the increased public and regulatory focus on the topic, including in context of the German Supply Chain Due Diligence Act, effective from January 2023. The bank’s approach encompasses all dimensions of its business, from client transactions and interactions with vendors and service providers to the treatment of its employees. Deutsche Bank assesses its sectoral and geographical risk exposure to human rights violations regularly and undertakes due diligence to identify and assess the nature of the actual and potential adverse human rights impacts with which it may be directly or indirectly linked. Deutsche Bank also annually publishes a Modern Slavery and Human Trafficking Statement (*). The following subchapters address the bank’s human rights governance structure and the governance and mitigation measures, it has undertaken for the different stakeholder groups, particularly for clients, suppliers, and employees. Governance GRI 2-12/13/16/25/26, 3-3 In 2022, building on the former Human Rights Working Group, the Human Rights Forum was established to ensure oversight of Deutsche Bank’s human rights management. This Forum consists of senior representatives of the following functions and business divisions: Procurement, Anti-Financial Crime, Chief Sustainability Office, Human Resources, Legal, Non-Financial Risk Management, Governance as well as Corporate Bank, Investment Bank, and Private Bank. DWS is involved ad hoc as appropriate. The Human Rights Forum is co-chaired by the Chief Sustainability Officer and the Head of Group Sustainability and reports to the Sustainability Committee. Via the Human Rights Forum, which meets bimonthly, the members monitor trends, collect and share learnings from within Deutsche Bank, liaise with external experts and initiate strategic projects relevant for human rights management. In 2022, the Human Rights Forum served as an interface for both strategic and operational actions related to Human Rights. As a specific activity within the Forum, the members evaluated the implications of the draft EU Corporate Sustainability Due Diligence Directive. In addition, the Forum supported the implementation of the German Supply Chain Due Diligence Act, which came into force in January 2023. The members of the Human Rights Forum also engaged in preparing the (*) for aforementioned Modern Slavery and Human Trafficking Statement (*) as well as the updated Human Rights Statement publication. The updated human rights governance was presented to the Supervisory Board; and the revised Statement on Human Rights and the Modern Slavery and Human Trafficking Statement have been signed off by the Management Board. 57
Deutsche Bank Transition toward a sustainable and climate-neutral economy Non-Financial Report 2022 Human rights Alongside the Human Rights Forum, the above-named functions established working groups to address function specific human rights issues, e.g., the Anti-Financial Crime human rights working group which is dedicated to combatting modern slavery and human trafficking in the clients’ business and on which further details are available below in the “Clients” section of this chapter. Meeting the requirements of the German Supply Chain Due Diligence Act, Deutsche Bank further enhanced and strengthened its procurement related human rights management processes. Further details can be found in the “Supply chain” section of this chapter. Deutsche Bank has processes and channels in place to evaluate the effectiveness of its management approach to human rights. The bank draws on insights from the integrity hotline to assess whether the management approach with regard to employees is effective or in need of further refinement. The bank evaluates effectiveness with regard to clients using a range of sources including transaction reviews for clients, in-house research, media reports, dialog with individual clients, and exchange on general trends and developments with peers. The approach to vendors is similar, consisting of information from the vendor screening process supplemented by in-house research, media reports, and discussions with peers. Further details on the bank’s stakeholder engagement may be found in the chapter “Stakeholder engagement and thought leadership”. Deutsche Bank’s human rights governance benefits from the exchange of ideas and experiences afforded by its membership in the Thun Group of Banks, which Deutsche Bank joined in 2012. In 2022, the bank continued to participate in the Thun Group’s meetings and activities relating to human rights in banking and, in particular, the United Nations Guiding Principles on Business and Human Rights. Key topics in 2022 Clients GRI 2-23/24/25/29, 3-3, 404-2, FS1, FS3, FS4, FS5 Human rights due diligence is integral to Deutsche Bank’s Environmental and Social Policy Framework. In order to identify, prevent and mitigate adverse human rights impacts, the bank has integrated human rights considerations in the environmental and social due diligence process, e.g., land rights and cultural heritage, labor and child rights, health and safety of workers and communities, and the rights of indigenous people. The chapter entitled “Environmental and social due diligence”, including the table “Main positions and minimum standards of environmental and social due diligence” therein, contains more information on the related process and the principles Deutsche Bank applies. While human rights due diligence is a cross-sectoral issue, some sectors and activities have an inherently higher risk of negatively impacting human rights. Thus, the Environmental and Social Policy Framework includes specific human rights- related expectations and requirements that apply to the sectors in scope of the Framework. Special attention will be paid to cases involving resettlement; cases where the bank identifies potential negative impacts on indigenous peoples; and cases where clients use security forces for site protection. If Deutsche Bank has concerns about a client with regards to human rights, it consults with relevant stakeholders. This might include direct engagement with the client as well as with civil society representatives that are familiar with the situation. Where appropriate, the bank obtains the advice of independent experts. Based on all available information and its assessment of the risks that have been identified, the bank decides on the further course of action, which may include termination of a business relationship. (*), which the bank officially adopted in 2020, further underscores its human The implementation of the Equator Principles rights risk assessments for eligible projects and its commitment to human rights preservation for transactions outside the scope of the Equator Principles. In 2022, the bank continued to conduct comprehensive trainings to ensure that relevant business areas have an in-depth understanding of the Equator Principles as well as the requirements for assessing the impacts on potential rights holders in the various projects that it finances. The bank-wide framework for the prevention of Financial Crime contributes to preventing, deterring and detecting client activities that might be linked to potential human rights violations. Being a global financial institution that provides a broad range of products and services exposes Deutsche Bank to diverse financial crime risks, including modern slavery and human trafficking. The Principles for the Management of Financial Crime Risks outline the responsibilities and accountabilities of the Anti-Financial Crime Function and of all employees at Deutsche Bank Group and describe the essential organizational requirements and relevant processes for the management of financial crime risks across the 1st and 2nd Line of Defense (‘LoD’). Global Anti-Financial Crime policies define minimum standards for managing financial crime risks, including those with implications for human rights. These bank-wide polices are supplemented by country-specific policies and procedures that reflect national laws and regulations. 58
Deutsche Bank Transition toward a sustainable and climate-neutral economy Non-Financial Report 2022 Human rights The Anti-Financial Crime human rights working group, which is part of the above-described bank-wide Human Rights Forum, was established in 2021 to develop and pursue concrete measures and initiatives within the Anti-Financial Crime function to fight modern slavery and human trafficking. As a practical example of the progress made in 2022, modern slavery and human trafficking related key risk drivers were incorporated within Deutsche Bank’s Non-Financial Risk Taxonomy. This is going to further support the enhancement of Deutsche Bank’s control framework. Independent of the working group the Anti-Financial Crime department pro-actively contributed to initiatives within several Public Private Partnerships. Deutsche Bank is currently leading the workstream “Financial Flows of Human Trafficking” within the German Public Privat Partnership Anti-Financial Crime Alliance (AFCA) and is part of a taskforce covering among other topics human trafficking in the Europol Financial Intelligence Public Private Partnership (EFIPPP). In October 2022 the bank hosted an event organized by the Finance Against Slavery and Trafficking (FAST) initiative. To reinforce employees’ awareness of activities linked to potential human rights violations the bank conducts periodic trainings. One specific example is a 45-minute mandatory online course on anti-money laundering (AML) and the prevention of terrorist and proliferation financing - topics that have potential connections to human rights violation. Every Deutsche Bank employee worldwide must complete the module once every year. Around 99% of staff (including in-scope contingent workers) did so in 2022. Mandatory Risk Awareness training is also deployed to all staff every other year. This online training now includes a specific case on modern slavery in the private banking business and includes a question for learners on typical risk indicators. This updated course was launched in the fourth quarter of 2022 to English speaking staff and is going to be rolled out as translated versions in non-English speaking locations at the beginning of the second quarter 2023. Supply chain GRI 2-6/25, 3-3 The products and services that Deutsche Bank buys, who it buys from, and how it consumes has a significant influence on its sustainability footprint. For this reason, sourcing and procurement activities play a key role in the bank’s ambitions to respect and improve human rights. While the divisions are accountable for the suppliers they use, the Global Procurement function leads on the vast majority of sourcing and procurement decisions. In support of this, globally consistent processes and procedures are in place to govern the sourcing and procurement of goods and services, onboarding of suppliers and the ongoing management of supplier performance. Suppliers are required to meet a range of requirements including financial health, anti-fraud and corruption, and compliance checks to engage with Deutsche Bank. Supplier Code of Conduct The intention of the Supplier Code of Conduct (“Code”) is that suppliers understand the core values and standards of behavior that Deutsche Bank expects its suppliers to conform to when providing goods and services. The Code is acknowledged by the supplier responding to a request for proposal and on starting an engagement with Deutsche Bank, suppliers are expected to provide a copy of this Code to its personnel who will be involved in the supply of the goods and services. The Code contains sections on Compliance with Law, Human Rights, Diversity and Inclusion, Sustainability, and Corporate (*). Social Responsibility. The Code is available on Deutsche Bank’s public supplier portal Screening of the bank’s vendors for adequate social and environmental standards The bank undertakes the assessment of prospective vendors’ environmental and social standards starting with a questionnaire analyzing the significance of potential social or environmental impacts related to a vendor’s service delivery. Conditional on the results of this analysis, the vendor risk management process may further scrutinize the potential for sustainability risks. For vendors, with which Deutsche Bank spend more than € 500,000 annually vendor balanced scorecards were launched. These scorecards evaluate vendors across a holistic set of key performance indicators. This evaluation includes a sustainability performance indicator which is either the rating score provided by EcoVadis or the vendor can use an equivalent reputable sustainability rating agency. From July 2022, the prerequisite for every new or prolonged contract worth more than € 500,000 a year is that the vendor has an external sustainability rating from EcoVadis or other rating agencies (*). To that end, the bank maintains a registration website (*) where vendors can obtain relevant information and start their assessments with the sustainability rating agency, EcoVadis. 59
Deutsche Bank Transition toward a sustainable and climate-neutral economy Non-Financial Report 2022 Human rights Meeting the requirements of the German Supply Chain Due Diligence Act, Deutsche Bank further enhanced and strengthened its procurement related human rights management processes. Based on a respective risk analysis, the bank adopted a risk management system targeted at minimizing human rights adverse impacts across its supply chain. In addition to the above requirements with regards to the submission of an external ESG rating, the bank enhanced preventive measures, including vendor due diligence, contract clauses according to vendors’ risk profile and standardized processes for remedial action in case of actual human rights incidents in the bank’s supply chain. The process for remedial actions is triggered by a variety of observations: incidents being flagged in Deutsche Bank’s risk review cycles, reported incidents through internal and external complaints channels, incidents being identified in adverse media monitoring and allegations directly reported to Deutsche Bank, e.g., by NGOs or media. In such cases, the incidents will be further investigated and appropriate measures to remedy the adverse effects will be agreed with the vendor and monitored over time. The brand DWS is not covered by the management approach related to the German Supply Chain Due Diligence Act described in this section. Employees GRI 3-3, FS4 Deutsche Bank aims to be an ‘employer of choice’ for existing and future employees. The bank strives to create a workplace that is both diverse and supportive and which is always welcoming of different views. The bank encourages high standards of conduct and work performance and is committed to providing a working environment free from harassment, discrimination and retaliation. Given the activities it undertakes and the geographies in which it operates, Deutsche Bank’s own operations have only limited exposure to adverse impacts from human rights violations. The bank aims to continue to monitor the safeguarding of human rights using a risk-based approach and focusing on those geographies where human rights issues are most likely to occur and where the bank has a material presence. Deutsche Bank is guided by the International Labour Organization Declaration on Fundamental Principles and Rights at Work as well as applicable labor laws in the different jurisdictions in which it operates. This includes sovereign state legislation on collective agreements, bargaining and freedom of association. In countries where internationally recognized standards may not be fully implemented, the bank aims to honor the principles of internationally recognized human rights. The bank expects all employees to understand their responsibilities and to act in accordance with its policies, procedures, and initiatives regarding human rights. The bank reinforces this awareness through bank-wide training. For example, 86.8% of employees completed trainings on compliance and ethics that also include aspects of human rights in 2022 (2021 excluding Postbank: 93.3%). The bank investigated all employee grievances reported to the integrity hotline in 2022. If violations were identified, they were reported to the appropriate functions, and the necessary steps were taken. 60
Deutsche Bank Transition toward a sustainable and climate-neutral economy Non-Financial Report 2022 In-house ecology In-house ecology – On target to reduce energy consumption by 20% by 2025 – 95.7% of all electricity from renewable sources GRI 3-3 As part of Deutsche Bank’s commitment to being a responsible corporate citizen, the Group manages and, where possible, minimizes the actual negative environmental impact of business operations, such as the energy and resources used in offices and carbon emissions from business travel. This is done by reducing energy consumption and using other resources as efficiently as possible, buying renewable electricity, and offsetting the remaining emissions. After engaging with stakeholders internally, action was taken to improve the quality of supply chain emissions data. To start to reduce the environmental impact of suppliers, the bank joined the CDP Supply Chain where members can engage with suppliers, identify risks and opportunities, and share carbon emissions data. In 2022 Deutsche Bank requested its largest 147 vendors respond to the CDP climate change questionnaire to more fully understand and reduce the emissions associated with purchased goods and services. Of the 147 suppliers, 92 responded. In 2023 it is planned to expand this number to the largest 300 suppliers. The planned measure of effectiveness of this action is more suppliers disclosing emissions data to the CDP in 2023. Finally, Deutsche Bank strives to use water and paper responsibly, reduce the amount of waste generated, and re-use and recycle as much as possible. Governance GRI 2-13, 3-3 Deutsche Bank’s governance framework for collecting data on, quantifying, and reporting greenhouse gas (GHG) emissions is based on ISO 14064, an internationally recognized standard for GHG reporting. In addition, the bank’s energy management system in Germany is certified to ISO 50001; this includes monitoring progress toward energy and cost reduction targets on a monthly and annual basis. Deutsche Bank complies with the European Energy Directive in the 20 EU countries where it operates, and base conservation efforts on the respective national energy audit requirements. The Eco-Performance Management Office (EcoPMO) in the Global Real Estate function oversees energy and resource conservation in offices and other facilities. It defines criteria and responsibilities for how energy conservation initiatives are evaluated and approved. Facility management teams complete an energy initiative assessment and implement energy and water efficiency projects; the EcoPMO measures and verifies outcomes. In addition, progress toward targets is continually monitored by collecting data on energy use, water use, and waste at Deutsche Bank’s buildings. This information is collated in monthly regional energy reports, which are reviewed by regional and global division managers, and quarterly reviews are held with the Chief Sustainability Officer to inform about In-house ecology topics and performance against targets who in turn briefs the management board. Deutsche Bank’s Scope 1 and Scope 2 emissions are calculated based on the reporting boundary of the GHG Protocol’s operational control approach. This report is the second consecutive year in which the relevant categories 1 to 14 of Deutsche Bank’s Scope 3 GHG emissions are disclosed. – Scope 1: Direct emissions from on-site and mobile combustion (liquid/gaseous fossil fuels, owned and leased vehicles, and refrigerant leakage from cooling equipment) – Scope 2: Indirect emissions from delivered energy (electricity, district heating, steam, and chilled water) – Scope 3: Relevant categories 1 to 14 (excluding investments or financed emissions). 61
Deutsche Bank Transition toward a sustainable and climate-neutral economy Non-Financial Report 2022 In-house ecology Targets and measures GRI 3-3 The bank has set a number of targets to reduce its environmental footprint, particularly with regard to energy efficiency and consumption using 2019 as a base year due to this being the last year of normal pre-COVID-19 operations: – Reduce total energy consumption by 20% by 2025 compared with 2019 – on target to achieve – Source 100% renewable electricity by 2025, (on target to achieve), with an interim target of 85% by 2022 – achieved – Compensate for emissions of own operations (scope 1 and 2) and business travel - achieved – Reduce Deutsche Bank car fleet gasoline consumption by 30% by 2025 and carbon zero by 2030 in Germany – on target to achieve Offsetting residual CO emissions 2 GRI 2-4, 3-3, 201-2, 305-1/2/3/4/5 One of Deutsche Bank’s most important environmental commitments is to reduce and compensate CO e emissions for own 2 operations and business travel. This is achieved by consuming less energy, traveling less, and purchasing more renewable electricity, and then finally by offsetting Deutsche Bank’s residual Scope 1 and 2 emissions as well as those associated with the Group’s business travel. Market-based emissions from own operations and business travel (including the effect of buying renewable electricity) amounted to 74,300 metric tons of CO e in 2022, while emissions from own operations and business travel using location- 2 based reporting (excluding renewables) totaled 174,236 metric tons of CO e. The difference between the two types of 2 reporting is due to renewable electricity contracts or energy attribute certificates (EACs) purchased in 29 countries, particularly in three countries—Germany, the United Kingdom, and the United States—where most electricity is consumed by the bank. Having reduced energy consumption and travel, and purchased renewable electricity for 95.7% of all electricity consumption, in 2022, Deutsche Bank continued to offset the residual emissions by purchasing and retiring high-quality Verified Emission Reduction (VER) certificates. The certificates purchased in 2022 fund investments in a diversified portfolio of projects that promote climate protection and economic development in Africa, Latin America, and Asia. All projects comply with recognized global standards: 41% with the Gold Standard and 59% with the Verified Carbon Standard or VERRA. The projects supported by the VER certificates were purchased and retired along with the emissions they offset are shown in the four tables below: CO offsetting projects by type and region 2 Twelve months ended as of Dec 31,2022 Africa Americas Asia Share Wind energy 0 18,000 18,000 41 % Biomass/biogas 0 0 0 − Efficient cookstoves 0 0 0 − Geothermal energy 0 0 0 − Hydropower 0 18,000 0 21 % 1 Sustainable forest management/REDD 0 0 0 − Solar energy/photovoltaics 15,000 0 18,000 38 % Total 15,000 36,000 36,000 87,000 Proportion 17.2 % 41.4 % 41.4 % 100 % 1 REDD stands for “Reducing Emissions from Deforestation and Forest Degradation” Twelve months ended as of Dec 31,2021 Africa Americas Asia Share Wind energy 0 0 60,000 33 % Biomass/biogas 0 0 0 − Efficient cookstoves 0 0 0 − Geothermal energy 0 0 60,000 33 % Hydropower 0 0 0 − 1 Sustainable forest management/REDD 25,000 35,000 0 33 % Solar energy/photovoltaics 0 0 0 − Total 25,000 35,000 120,000 180,000 Proportion 14 % 19 % 67 % 100 % 1 REDD stands for “Reducing Emissions from Deforestation and Forest Degradation” 62
Deutsche Bank Transition toward a sustainable and climate-neutral economy Non-Financial Report 2022 In-house ecology Twelve months ended as of Dec 31,2020 Africa Americas Asia Share Wind energy 0 36,000 27,000 35 % Biomass/biogas 0 0 0 − Efficient cookstoves 0 0 0 − Geothermal energy 0 0 27,000 15 % Hydropower 0 0 0 − 1 Sustainable forest management/REDD 27,000 27,000 36,000 50 % Solar energy/photovoltaics 0 0 0 − Total 27,000 63,000 90,000 180,000 Proportion 15 % 35 % 50 % 100 % 1 REDD stands for “Reducing Emissions from Deforestation and Forest Degradation” GHG emissions from own operations and business travel Twelve months ended as of Variance from in t of CO e previous period 2 (unless stated differently) (in %) Sep 30, 2022¹ Dec 31, 2021² Dec 31, 2020² Scope 1, direct GHG emissions (19.3) 25,110 31,122 39,875 Natural gas consumption (18.9) 18,586 22,925 26,609 Liquid fossil fuels3 (12.9) 322 369 432 4 HFCs (34.2) 2,211 3,360 4,042 Owned/leased vehicles (10.7) 3,991 4,469 8,792 Scope 2, indirect GHG emissions (15.4) 30,751 36,331 78,846 5 Market-based emissions from electricity consumption (31.5) 7,118 10,396 48,491 District heating, steam and cooling (8.9) 23,633 25,935 30,354 6 Scope 3, business travel GHG emissions 238.7 18,438 5,444 14,206 Total Scope 1&2 (market-based) and business travel GHG emissions7 1.92 74,300 72,897 132,927 GHG emissions (market-based, excluding carbon credits) per sqm8 1.32 0.02611 0.02577 0.04689 GHG emissions (market-based, excluding carbon credits) per FTE8 2.91 0.89031 0.86517 1.53380 1 Data reported for 2022 is from the period October 1, 2021, to September 30, 2022. The previous year is always adjusted to January to December. In 2021 total scope 1, 2 (market-based) and business travel GHG emissions were 12% less than reported last year (83,098 tCO2e) mostly due to the use of Q4 2020 data not reflecting the decreased energy use that occurred in Q4 2021. Average uncertainty is +/- 10% for all KPIs. 2 There are several reasons for changes to prior-year figures: updated power grid factors, updates to historical data (such as billing updates), and methodology changes 3 Emissions from liquid fossil fuels decreased in 2022, owing largely to fewer power outages in India and lower office occupancy 4 HFC emissions decreased in 2022. However, the decrease is in the expected range factoring in maintenance work conducted 5 Market based electricity uses a zero emission factor for sites where renewable electricity contracts are in place, or Energy Attribute Certificates (RECs. GOs) are purchased to enable the claim that the attributes of renewable electricity apply to the consumption 6 Business travel includes travel by air, rail, rented vehicles, and taxis. The increase in emissions from business travel reflects global travel restrictions being removed 7 Total emissions are based on actual, estimated, or extrapolated data, including all market-based scope 1 and 2 emissions as well as scope 3, category 6-business travel emissions. The emission factors have been used for each activity data type, from internationally recognized sources, e.g., DEFRA/BEIS (2022), GHG Protocol, eGRID (2022), and IEA (2022), RE-DISS (2020), or, if more relevant, from country or contract specific sources. The factors include all GHGs and the gases’ Global Warming Potential as per the IPCC AR5 assessments. 8 2 All floor area metrics use an annual average from data for the period October 1, 2021, to September 30, 2022 (2.846 million m ). All FTE metrics use an annual average for the period October 1, 2021, to September 30, 2022 (83,454). 63
Deutsche Bank Transition toward a sustainable and climate-neutral economy Non-Financial Report 2022 In-house ecology Key topics in 2022 Energy efficiency and conservation GRI 2-25, 3-3, 302-4 Deutsche Bank continually enhances buildings’ energy efficiency and reduce energy consumption. This is done by using new and more efficient technology, recommissioning equipment, and optimizing building operations. As part of Deutsche Bank’s standard operating procedure, the Bank has always managed energy costs and consumption, and hedge energy with forward purchases which has mitigated most of the recent energy market volatility. Deutsche Bank also changed building management systems to maximize energy efficiency amid low occupancy. This helped reduce energy consumption by 13.3% year-on-year. The EcoPMO conducts an annual in-depth assessment of the contribution of energy-conservation initiatives toward Deutsche Bank’s energy reduction targets. It also shares knowledge and best practices between regions. Deutsche Bank’s offices reduced their energy consumption by a total of 19.4 GWh. About 137 initiatives contributed to this improvement. Some savings are for part of the year, for example, an initiative completed in June delivered six months of savings in 2022; it will deliver 12 months in 2023. The reductions achieved in Deutsche Bank’s consumption includes several types of energy - electricity, district cooling, district heat, and natural gas. Energy and renewable electricity GRI 2-4/25, 302-1/3/4 By purchasing renewable electricity in 29 countries in 2022, altogether, 95.7% of Deutsche Bank’s electricity worldwide was from renewable sources (2021: 94.6%). Deutsche Bank’s certified zero-carbon electricity contracts include Renewable Energy Certificates in the United States and Canada, Renewable Energy Guarantees of Origin for selected offices in the United Kingdom, Guarantees of Origin in Germany and 13 other European countries, and International Renewable Energy Certificates in Brazil, China, Hong Kong, India, Mexico, Philippines. Zero-carbon electricity contracts are also maintained in Austria, Belgium, France, Italy, Luxembourg, Spain, and Switzerland. Energy consumption1 Twelve months ended as of Variance from in GWh previous period (unless stated differently) (in %) Sep 30, 2022¹ Dec 31, 2021² Dec 31, 2020² 3 Total energy consumption in GJ (13.3) 2,078,060 2,397,381 2,601,837 3 Total energy consumption (13.3) 577 666 723 Electricity consumption (13.1) 325 374 411 Energy from primary fuel sources (oil, gas, etc.) (17.5) 120 145 169 4 District heating, steam and cooling (9.7) 133 147 143 Electricity from renewables3 (12.1) 311 354 322 2 5 Space-normalized energy consumption in kWh per m (13.8) 203 235 255 6 Normalized energy consumption in kWh per FTE (12.5) 6,917 7,904 8,339 1 Data reported for 2022 is from the period October 1, 2021, to September 30, 2022. The previous year is always adjusted to January to December. 2021 total energy consumption data is 6% less than reported in the previous report (709 GWh) mostly due to the use of Q4 2020 data not reflecting the decreased energy use that occurred in Q4 2021 An average uncertainty is +/- 10% for all KPIs. 2 There are several reasons for changes to prior-year figures: updated power grid factors, updates to historical data (such as billing updates), and methodology changes 3 Total energy consumption encompasses all sources used in Scopes 1 and 2: natural gas, liquid fossil fuels (mobile and stationary), renewable and grid electricity, district heating, cooling and steam. Standard joule to kWh conversion factors were used. The only renewable energy source used is electricity and equals 311 GWh. There was no sale of electricity, heating, cooling, or steam. 4 Calculated electricity and heating intensities are used to estimate electricity and heating demand where data are unavailable 5 2 All floor area metrics use an annual average derived from data for the period October 1, 2021, to September 30, 2022 (2.846 million m ) 6 All FTE metrics use an annual average from the period October 1, 2021, to September 30, 2022 (83,454) 64
Deutsche Bank Transition toward a sustainable and climate-neutral economy Non-Financial Report 2022 In-house ecology Greenhouse gas emissions GRI 2-4, 305-1/2/3/5 An environmentally extended economic input output (EEIO) model has been used to estimate the emissions in Scope 3 categories 1, 2 and 4 based on the amount spent in each economic sector, and these cover 79% of emissions reported in the table below. Emissions in the bank’s value chain (all Scope 3 excluding investments) amounted to around 1.725 million metric tons of CO e 2 in 2022, a decrease of 4.2% compared to 2021, largely due to the reduced spend on use of IT services. Employee commuting, which also includes emissions of employees working from home, decreased over the last year, which is a direct impact of the return to the office after the pandemic. GHG emissions1 Twelve months ended as of Variance from in t of CO e previous period 2 (unless stated differently) (in %) Sep 30, 2022¹ Dec 31, 2021² Dec 31, 2020² 3,4 Total GHG emissions (market-based) (4.2) 1,725,229 1,800,391 1,843,369 Scope 1, direct GHG emissions (19.3) 25,110 31,122 39,875 Scope 2, indirect GHG emissions (15.4) 30,751 36,331 78,846 4 Scope 3, other indirect GHG emissions (3.7) 1,669,367 1,732,938 1,724,649 Category 1 - purchased goods and services (6.3) 1,273,274 1,358,367 1,367,139 Category 2 - capital goods 123.4 46,303 20,730 8,180 Category 3 - upstream fuel and energy related activities (8.3) 57,140 62,317 51,605 Category 4 - upstream transportation and distribution 29.0 43,585 33,792 37,024 Category 5 - waste generated in operations 112.5 644 303 385 Category 6 - business travel 238.7 18,438 5,444 14,206 5 Category 7 - employee commuting/working from home (13.8) 117,912 136,736 122,026 Category 8 - upstream leased assets N/A N/A N/A 6 Category 9 - downstream transportation and distribution (3.6) 22,569 23,409 27,268 Category 10 - processing of sold products N/A N/A N/A 7, 8 Category 11 - use of sold products N/M not disclosed 1,183 1,375 Category 12 - end-of-life treatment of sold products8 (1.1) 77,059 77,948 78,870 9 Category 13 - downstream leased assets (2.1) 12,443 12,710 16,571 Category 14 - franchises N/M N/A N/A N/A Category 15 - investments N/M See See Relevant, not explanations in explanations in disclosed Climate risk Climate risk chapter chapter 1 Data reported for 2022 is from the period October 1, 2021, to September 30, 2022. The previous year is always adjusted to January to December. Average uncertainty is +/- 10% for all KPIs. Some KPIs have changed more than +/- 10% in 2021 due to the extraordinary nature of the effect of the pandemic on the operations of the bank’s business and buildings in previous years. 2 There are several reasons for changes to prior-year figures: updated power grid factors, updates to historical data (such as billing updates), and methodology changes 3 Total emissions are based on actual, estimated, or extrapolated data, including all market-based Scope 1 and 2 emissions and relevant categories 1 to 14 of Scope 3 emissions. All assumptions and calculation methodologies are in line with the ISO 14064 Standard Guidelines with supporting documentation. The emission factors have been used for each activity data type, from internationally recognized sources, such as DEFRA/BEIS (2022), GHG Protocol, eGRID (2022), and IEA (2022), RE-DISS (2020), or, if more relevant, from country or contract specific sources. The factors include all GHGs and the gases’ Global Warming Potential pursuant to IPCC AR5 assessments. 4 The Greenhouse Gas Protocol Corporate Accounting and Reporting Standard was used to calculate Scope 1, 2 and 3 emissions. Categories 1, 2 and 4 where CEDA emission factors are used include adjustments for changes in inflation. All reported years now use CEDA Global emission factors for Germany instead of United States used in previous reporting years. 5 The GHG emission data disclosed for employee commuting/working from home decreased over the last 2 years, which is a direct impact returning to the office after the pandemic 6 Ad-hoc branch visits not included 7 Not disclosed for 2022 as immaterial 8 Categories 11 and 12 rely on calculating emissions from the number of customers, and these data are based on customer numbers in Germany only 9 Downstream leased assets of Postbank are not included in this data 65
Deutsche Bank Transition toward a sustainable and climate-neutral economy Non-Financial Report 2022 In-house ecology Business travel Deutsche Bank’s travel policies and approvals processes are designed to limit business travel (particularly by air) to reduce emissions as well as costs. Road travel decreased by 6.4%, however all other modes increased, with air travel going up by 256% year-on-year in 2022 compared with an historic low in 2021. The year-on-year increases in various modes of travel ranged from 72% to 311% in 2022 (2021: 38% to 151%). They were due mostly to removal of COVID-19 restrictions and removal of restrictive travel policies. The average number of FTEs declined by 1% in 2022 (2021: 2%). In 2022, Deutsche Bank continued to install charging points in its parking facilities to encourage employees to switch to eMobility. Distance traveled Twelve months ended as of Variance from in km previous period 1 2 2 (unless stated differently) (in %) Sep 30, 2022 Dec 31, 2021 Dec 31, 2020 1 Total distance travelled 119.9 134,649,933 61,222,073 136,788,894 1 Total air travel 256.5 98,855,496 27,728,347 71,359,734 Short-haul air travel 165.1 11,145,138 4,204,413 3,060,457 Medium-haul air travel 240.0 43,084,211 12,671,700 10,595,884 Long-haul air travel 311.2 44,626,147 10,852,233 57,703,392 5 Normalized air travel in km per FTE 260.0 1,185 329 823 3 Total rail travel 72.9 9,711,384 5,617,373 12,012,935 4 Total road travel (6.4) 26,083,051 27,876,354 53,416,225 5 Normalized total distance travelled in km per FTE 122.0 1,613 727 1,578 1 Data reported for 2022 is from the period October 1, 2021, to September 30, 2022. The previous year is always adjusted to January to December. Average uncertainty is +/- 15% for all KPIs. 2021 total distance travelled data is 18% more than reported in the previous report (51,964,935 km) due to the use of Q4 2020 data not reflecting the increased travel that occurred in Q4 2021. Domestic and international air travel is derived from 99.1 % of actual flight data; the remaining 0.9 % is extrapolated based on cost. Air Travel uses GHG Protocol emissions factors. No radiative forcing factor is applied. 2 The reasons for changes to prior-year figures include updates to historical data (such as cancellations and refunds) and methodology changes. A large increase in business travel compared to the reported figures in previous years can be attributed to the removal of COVID-19 restrictions 3 Rail travel is derived from 96.59% of actual rail travel data; the remaining 3.41% is extrapolated based on cost 4 These figures include all road travel from both company owned/leased vehicles, taxis and hired vehicles. Taxi data reported includes data for countries based on cost and is calculated using a country level taxi tariff. Actual distance traveled and fuel data are used for France, Germany, Hungary, Israel, Poland, Russian Federation, the United States, and the United Kingdom. Road travel uses DEFRA/BEIS 2022 emissions factors. 5 All FTE metrics use an annual average from the period October 1, 2021, to September 30, 2022 (83,454) The date of this report’s publication necessitated minor extrapolations to produce the above travel data for 2022. The bank continually assesses whether this makes a material difference to reporting. Paper consumption, waste and water GRI 2-25, 3-3 301-1/2, 303-1/3/5, 306-1/2/3/4/5 Deutsche Bank strives to reduce the amount of paper consumed and the waste produced, particularly in preparation for upcoming EU legislation aimed at limiting the use of plastic. The bank also tries to conserve water where possible, although this has become increasingly difficult due to the success of earlier efforts. Paper consumption The production of paper consumes valuable resources. The bank therefore works continually to use less paper, in part by introducing new technology. Pull-print technology, for example, has enabled Deutsche Bank to reduce the number of printers in its offices. Similarly, desktop-on-demand technology enables meeting participants to view files on screen, thereby eliminating the need to distribute printouts. Paper consumption Twelve months ended as of Variance from in t previous period 1 2 2 (unless stated differently) (in %) Sep 30, 2022 Dec 31, 2021 Dec 31, 2020 3 Copy/print paper consumed (57.3) 788 1,844 2,680 4 Recycled paper (49.2) 61 120 190 Recycled content in % 18.8 7.7 6.5 7.1 5 Normalized paper consumption in t per FTE (56.8) 0.00945 0.02189 0.03093 1 Data reported for 2022 is from the period October 1, 2021, to September 30, 2022. The previous year is always adjusted to January to December. Average uncertainty is +/- 10% for all KPIs. 2 The reasons for changes to prior-year figures include updates to historical data (such as billing updates) and methodology changes 3 Copy/print paper consumed data is extrapolated based on consumption per FTE from 17 countries covering, on average, 71% of FTEs 4 Copy/print paper consumed decreased 57% mainly due to the pandemic-related closure of offices in many countries for some of the reporting year 5 All FTE metrics use an annual average from the period October 1, 2021, to September 30, 2022 (83,454) 66
Deutsche Bank Transition toward a sustainable and climate-neutral economy Non-Financial Report 2022 In-house ecology Waste As part of the bank’s waste reduction strategy all single-use plastic cups, utensils, straws, and sachets have been removed from catering facilities, vending machines, and kitchens with cleaning facilities in most offices across Germany and the United Kingdom and replaced them with reusable alternatives, such as reusable cutlery and crockery. Posters, e-mail banners, and the Global Real Estate intranet have promoted the initiative and educated staff on current challenges, such as the difficulty of recycling plastic due to poor segregation and the contamination of waste streams. Landfilled waste increased due to a new landlord in New York being unable to provide evidence of how the waste was treated, so a conservative approach was taken to assume none of the waste was recycled or incinerated. Significant changes in other waste disposal methods, other recovery methods, anaerobic digestion, and prepared for re-use, are due to the adoption of the new GRI waste standard in January 2022, and the limited availability of data for those categories in 2021. In 2021 Deutsche Bank introduced a waste strategy that aims to emphasize the themes re-think, reduce, reuse, recycle as much waste as possible. Waste Twelve months ended as of Variance from in t previous period 1 2 2 (unless stated differently) (in %) Sep 30, 2022 Dec 31, 2021 Dec 31, 2020 3 Waste produced 4.8 11,978 11,434 13,408 4 Waste recycled (31.6) 5,094 7,448 8,022 Waste recycled in % (34.7) 42.5 65.1 59.8 5 Waste composted (41.5) 161 275 570 Diversion rate in % (35.1) 44 68 64 Waste with energy recovery6 9.6 2,728 2,490 3,568 6 Waste incinerated (without energy recovery) 35.6 727 536 886 Waste landfilled 836.3 986 105 363 Other disposal methods 1,151.4 185 15 n/a Other recovery methods 403.2 41 8 n/a Anaerobic digestion 347.2 78 17 n/a Prepared for reuse 267.5 1,978 538 n/a Waste diverted from disposal (11.3) 7,351 8,287 8,592 Waste directed to disposal 47.0 4,626 3,146 4,816 7 Hazardous waste (68.6) 149 474 326 Nonhazardous waste 7.9 11,829 10,960 13,082 1 Data reported for 2022 are from the period October 1, 2021, to September 30, 2022. The previous year is always adjusted to January to December. Average uncertainty is +/- 10% for all KPIs. Data is not extrapolated for anaerobic digestion, preparation for reuse or composting due to the unique nature of these activities and are assumed to be fully captured by actual data. 2 The reasons for changes to prior-year figures include updates to historical data (such as billing updates) and methodology changes 3 Waste data, including the disposal method and hazardous/non-hazardous split, has been determined by information provided by waste contractors. Waste data is extrapolated based on FTEs from Germany, the United Kingdom, the United States, and from twenty other countries, covering 64% of FTEs. Waste data does not include project waste, such as from refurbishments. 4 The 32% decrease in waste recycled is primarily driven by less IT waste. This contributed to a lower intensity figure used to extrapolate for countries without data. 5 In 2022, there was a 41.5% decrease in composted waste reflecting pandemic-related office and canteen use being less with hybrid working 6 The increase in incinerated waste was attributable to pandemic related office closures 7 The decrease in hazardous waste was the result of less IT waste (which is classified as hazardous) 67
Deutsche Bank Transition toward a sustainable and climate-neutral economy Non-Financial Report 2022 In-house ecology Water Water is an increasingly scarce resource in many countries worldwide, and Deutsche Bank takes a variety of steps to conserve water. For example, in 2022 Deutsche Bank installed sensors in new offices to detect leaks and automatically cut off the water flow. For example, water flow is stopped when floors are not occupied, which prevents waste, such as when a tap is accidentally left running. Low-flow aeration faucets and water-efficient products are installed whenever new services are required or facilities are refurbished. Water consumption in 2022 was again lower year-on-year. However, it is increasingly difficult to achieve further significant reductions owing to the success of earlier efforts. As in previous years, Deutsche Bank’s water came exclusively from the municipal water supply or other public or private water utilities. No surface water, ground water, seawater, produced water, or third-party water is used. Water is not recycled or reused. Water Twelve months ended as of Variance from in m³ previous period (unless stated differently) (in %) Sep 30, 2022¹ Dec 31, 2021² Dec 31, 2020² 3 Total water consumed (potable) (13.1) 773,095 889,176 1,254,751 Normalized water consumption in cbm per FTE4 (12.2) 9.3 10.6 14.5 5 Space-normalized water consumption in m³ per m² (13.6) 0.27 0.31 0.44 1 Data reported for 2022 is from the period October 1, 2021, to September 30, 2022. The previous year is always adjusted to January to December. Average uncertainty is +/- 10% for all KPIs. 2 The reasons for changes to prior-year figures include updates to historical data (such as billing updates) and methodology changes 3 Actual water consumption data is based on meter readings and invoices. Water figures are extrapolated for each building based on occupied area and refer to potable (municipal) water only. 4 All FTE metrics use an annual average from the period October 1, 2021, to September 30, 2022 (83,454) 5 All floor area metrics use an annual average derived from data for the period October 1, 2021, to September 30, 2022 (2.846 million m²) 68
Governance and operations 71 Corporate governance 75 Stakeholder engagement and thought leadership 78 Culture, integrity and conduct 81 Public policy and regulation 85 Anti-昀椀nancial crime 89 Tax 91 Data protection 93 Product responsibility 96 Client satisfaction
Deutsche Bank Non-Financial Report 2022 Governance and operations at a glance Integrity The Code of Conduct sets out standards of Client Innovation behavior and conduct to which the bank and Centricity all its employees are expected to adhere To ensure that sustainability is a priority Deutsche Bank’s throughout the bank, the remuneration of the Values Management Board has been linked to the sustainability strategy and ESG objectives Sustainable Discipline Performance Partnership Facts and 昀椀gures 2022 86 % 81 % 83 >1,900 of the new managers of respondents to our 2022 culture, integrity and conduct employees dedicated to the completed speak-up training People Survey felt able to initiatives across divisions 昀椀ght against 昀椀nancial crime express their views freely in and infrastructure functions as part of a stand-alone, their working environment second line of defense unit Data protection Anti-昀椀nancial crime Public policy Tax Product responsiblity No personal data Signi昀椀cant increase in No permission of The bank has a clear Tailored controls and breaches with material headcount to protect direct or indirect framework setting out governance in place impact to individuals the bank and society contribution to roles and responsibilities across businesses to observed from 昀椀nancial crime political parties to ensure compliance responsibly design and with the tax obligations o昀昀er products and services to clients 70
Deutsche Bank Governance and operations Non-Financial Report 2022 Corporate governance Corporate governance – Governance setup ensures clear separation of responsibilities – Dedicated Chief Sustainability Officer – Senior management’s variable compensation includes non-financial indicators GRI 2-9/10/11/12/13/17/18/19/20, 405-1 Deutsche Bank AG is incorporated as a German stock corporation (Aktiengesellschaft, or AG). Its corporate governance therefore reflects the structure with three separate corporate bodies – Supervisory Board, Management Board, and Shareholders’ Meeting – stipulated by the German Stock Corporation Act (AktG). Each of these three corporate bodies has distinct responsibilities. The Supervisory Board appoints the members of the Management Board and monitors its activities. The Management Board has overarching responsibility for managing Deutsche Bank AG, steering Deutsche Bank Group and setting the bank’s strategic course. The Shareholders’ Meeting appoints the shareholders’ representatives to the Supervisory Board and votes on certain matters established by law and the Company’s Articles of Association. Given the corporate governance structure with its separation of the Management and Supervisory Board, a member of the Supervisory Board is excluded from being a member of the Management Board. The Supervisory Board consists of 20 members, 10 of whom are shareholder representatives elected by the Shareholders’ Meeting, 10 of whom are employee representatives. Pursuant to the German Co-Determination Act (Mitbestimmungsgesetz), the employee representatives are elected by the Deutsche Bank AG’s employees in Germany. Unlike the Management Board, the Supervisory Board generally does not perform management functions or issue direct business instructions to the Management Board. However, it has the authority to subject certain of the Management Board’s decisions to a consent requirement. Moreover, it, together with the Management Board, adopts Deutsche Bank AG’s annual financial statements, approves the Group’s annual financial statements and appoints the members of the Management Board. To maintain the necessary expertise for their responsibilities, the members of the Supervisory Board receive different training throughout the year, including ESG. The report of the Supervisory Board contains further details on the Supervisory Board’s training and education measures. 71
Deutsche Bank Governance and operations Non-Financial Report 2022 Corporate governance Deutsche Bank follows the recommendations of the German Corporate Governance Code which includes specific references to ESG topics. The Deutsche Bank Supervisory Board has established the following nine committees consisting of subsets of its members and each with distinct tasks, as set forth in an abridged form below. The detailed responsibilities are set out in the terms of reference of the respective committees with the exception of the Mediation Committee which is an ad hoc committee. The task to specifically advise and monitor the Management Board with regard to ESG issues, the definition of ESG strategies and their implementation has been moved from the former Integrity Committee (now Regulatory Oversight Committee) to the bank’s Strategy and Sustainability Committee. The Nomination Committee supports the Supervisory Board in identifying suitable candidates to fill positions on the Management Board, drawing up an objective to promote the representation of the underrepresented gender on the Supervisory Board and a strategy for achieving this. More information about Supervisory Board committees can be found in the bank’s Corporate Governance Statement 2022. The Management Board is responsible for managing Deutsche Bank AG in accordance with the law, the Company’s Articles of Association, and its terms of reference. It seeks to create sustainable value in the Company’s interests while taking into consideration the interests of shareholders, employees, and other stakeholders. More specifically, the Management Board’s main responsibilities include establishing a proper and effective business organization, designing Deutsche Bank Group’s corporate strategy, and maintaining adequate risk governance (which includes appropriate and effective risk management), and complying with legal requirements and company policies. Management Board members are collectively responsible for managing Deutsche Bank AG. There may not be any reporting lines between them. Notwithstanding the principle of collective responsibility, the Management Board’s business allocation plan has allocated individual members responsibility for specific functional area(s) and thus ensures segregation of duties within the whole organization up to the Management Board. Management Board members are responsible for delegating their duties to subordinate levels of hierarchy and for clearly assigning responsibilities within the functional area(s) for which they are responsible. Such delegation is necessary for the proper functioning of the business organization and does not except Management Board members from adequately overseeing delegated duties and tasks. The business allocation plan has allocated responsibility for Sustainability to the Chief Executive Officer. The Management Board has delegated it to the Chief Sustainability Officer, who is responsible for implementing the sustainability strategy of Deutsche Bank which is described in more detail in the chapter Sustainability strategy and implementation. The Management Board prefers to rely on individually accountable senior managers rather than committees. It generally only establishes committees for issues that require collective decision-making. For certain overarching topics the Management Board has established the following committees and has delegated certain decision-making authority to them for each of the following issues: 72
Deutsche Bank Governance and operations Non-Financial Report 2022 Corporate governance The Group Sustainability Committee, chaired by Deutsche Bank’s Chief Executive Officer and the Chief Sustainability Officer (Vice Chair), was established in September 2020 to serve as the main governance body for group-wide sustainability issues with the aim of positioning Deutsche Bank to become a sustainable finance champion by integrating environmental, social, and governance (ESG) criteria into business and investment decisions. The Corporate Governance Statement in the Annual Report 2022 contains more information about Management Board composition. Deutsche Bank consistently pursues the goal of being a role model for sustainability in the financial sector, thus contributing to a more environmentally compatible, socially responsible and better managed economy. In order to closely and visibly link the sustainability strategy with the compensation of the Management Board, the Supervisory Board decided at an early stage to reflect the bank's strategic sustainable goals in the compensation system. Already since 2021, the Supervisory Board and Management Board have linked the variable compensation of the bank’s top executives to additional financial and non-financial criteria from the areas of ESG. This further developed system for the compensation of the members of the Management Board of Deutsche Bank, which was approved by the Annual General Meeting in 2021 with a majority of 97.76%, was also applied in 2022. The compensation system forms the basis for the Supervisory Board to determine each member of the Management Board's total compensation. The Supervisory Board is supported by the Compensation Control Committee. Management Board members receive fixed and variable compensation components. The latter consists of two elements (short-term award and long-term award) and reflects the degree to which group, divisional, and individual objectives are achieved. Both awards are linked to several ESG targets. The aim is to closely align compensation with the bank´s sustainability strategy and performance. The ESG targets for the short-term award are contained in individual and divisional balanced scorecards. They can also be part of a Management Board member’s individual targets agreed on at the beginning of a financial year. An ESG rating index representing a composite of five large rating agencies is also factored in. The ESG factor, which is the highest- weight factor in the long-term award, is assessed based on ESG objectives. These are related to impactful Group ESG focus topics that are the Management Board’s responsibility. The objectives, which are transparently disclosed in the Management Compensation Report include factors such as e.g., the amount of sustainable financing and investments, the reduction of electricity consumption in the bank’s buildings, concretely defined targets from the area of climate risk management as well as the improvement in gender diversity. In addition, the objectives include employee feedback culture, as well as achievements and positive developments regarding the bank’s control environment and remediation activities. The targets are linked to measurable key performance indicators (KPIs) to ensure an objective assessment of performance. Deutsche Bank has already published the corresponding targets and KPIs for the financial year in detail in the Outlook of the Compensation Report 2021, including target values, thresholds and caps, and discloses the results in the Compensation Report 2022. The compensation policy and the compensation system covered by it are implemented in individual but uniform and rule-compliant contracts for all Management Board members in compliance with banking law pursuant to Section 10 (4) of the German Remuneration Ordinance for Institutions (InstitutsVergV) and were approved by the Supervisory Board. 73
Deutsche Bank Governance and operations Non-Financial Report 2022 Corporate governance Using contract templates and standardized annexes, the variable compensation components are directly linked to the plan, claw back, and forfeiture conditions as well as the shareholding obligations. Diversity, equity and inclusion are essential for the bank’s success. They help Deutsche Bank forge enduring relationships with clients, business partners and employees, make balanced decisions, spur innovation, and play an active role in the countries and communities where the bank does business. The bank’s broad understanding of diversity, equality and inclusion encompasses age, gender, sexual and gender identity, ability, ethnicity, religion, nationality, education, professional background, and other aspects (see the Corporate Governance Statement in the Annual Report 2022). In line with the diversity principles of its Suitability Guidelines for selecting Management Board members, the Supervisory Board considers aspects of diversity when filling positions. It has set a target for at least 20% of the Management Board to consist of women by June 30, 2022. At year end 2022, there were two women on the Management Board. Women account for 30% of the Supervisory Board (the Corporate Governance Statement in the Annual Report 2022 contains more details). The Management Board remains committed to increasing diverse representation at all levels and has renewed the targets for women’s representation in leadership positions (see the “Employment and employability” chapter and the “Employee” chapter of this report and the Annual Report 2022). 40% of Management Board members are between 30 and 50 years of age, and 60% are older than 50. The bank’s Corporate Governance Statement in the Annual Report 2022 (information pursuant to Section 315a (1) of the German Commercial Code) contain additional information on corporate governance. Detailed information about Management Board compensation can be found in the Compensation Report 2022. The Risk Report, which is part of the Annual Report 2022, describes the bank’s risk governance. The disclosures in the aforementioned reports are not subject to the limited assurance engagement for this Non-Financial Report 2022. Specific sections of this report describe concrete governance information on how the bank manages non-financial issues. 74
Deutsche Bank Governance and operations Non-Financial Report 2022 Stakeholder engagement and thought leadership Stakeholder engagement and thought leadership – Climate change and decarbonization remained a stakeholder focus – Participation at UN Climate Change Conference for the second time GRI 2-12/29, FS3 Fair and open dialog with all its stakeholder groups is very important to Deutsche Bank. The bank wants to understand their expectations and concerns about its strategy, business activities and social responsibilities. This helps the bank identify its potentially positive and negative impacts. Deutsche Bank’s core stakeholders belong to the following groups: clients, employees, investors, regulators, and society at large, including e. g. media and non-governmental organizations. The bank has clearly defined responsibilities toward each stakeholder group. Mandates for interaction are delegated to the respective business division or infrastructure function. They use a variety of formats to engage with stakeholders. In addition, a materiality assessment helps identify its stakeholders’ sentiment on the topics they regard as most relevant to the bank. Clients Sustainability has gained significant momentum across all the bank’s client groups. The bank sees it as its responsibility to advise its clients in areas where they are looking for guidance and support for their transformation. Regular dialog helps the bank to understand its clients’ expectations, interests and needs and translate them into action. Deutsche Bank engages with its clients in many ways, including for example, personal or virtual meetings, calls, regular surveys, and the analysis of feedback it receives e. g. via its branches or hotlines. Deutsche Bank representatives are involved in discussions at various conferences and events. The bank also communicates via digital communication channels and publishes papers on sustainability topics. Climate change and the transition of the global economy towards sustainability remained an important topic for clients in the Corporate Bank and Investment Bank as well as investors, keeping the interest in sustainable finance products and services at a high level. Private clients requested best-in-class transparency and ESG advisory and shifted their behavior strongly towards digital channels. In 2022, Deutsche Bank continued to support its clients with its financial expertise and product offerings on their path to sustainability. For details, see “Sustainable finance” chapter. Employees Employees are at the heart of Deutsche Bank’s success. The ideas and skills as well as the commitment and wellbeing of its employees are essential to a productive workforce. Strong relationships, open communication, and learning from feedback are key in fostering a trusting environment in which employees take accountability and collaborate. The bank’s annual People Survey, exit and pulse surveys as well as a continuous dialogue with its employees help to understand its employees’ motivation and their perceived productivity. Several communication channels including team meetings, employee networks, emails, newsletters, townhalls and the ability to comment on intranet pages encourage the bank’s employees to share their thoughts and give feedback. In 2022, the bank’s People Survey indicated that employees’ commitment and sense that they are enabled remained at the high levels brought about by the bank’s response to COVID-19 and the strengthened focus on leadership and behaviors at that time. Renewed focus on these areas shall continue to support cultural progress of the recent years and strengthen employee commitment. How Deutsche Bank managed employee-related aspects is detailed in the “Employment and employability” chapter. Investors Investors expect Deutsche Bank to execute its strategy and transformation program to build a strong business that delivers consistent returns while managing risk responsibly. This includes the bank proactively addressing strategic opportunities and risks related to sustainability, including the transition towards a climate-neutral economy as well as social and governance aspects. 75
Deutsche Bank Governance and operations Non-Financial Report 2022 Stakeholder engagement and thought leadership Deutsche Bank discusses sustainability-related risks and opportunities with its private and institutional investors in one-on- one meetings and calls. The bank hosts investor and sustainability deep dives and invites shareholders to its annual general meeting. Furthermore, the bank uses digital communication channels and publishes quarterly and annual reports on the bank’s financial and non-financial performance. In 2022, the following topics were important to investors: – Progress in implementing the bank’s sustainability strategy, with a focus on climate risk management, environmental policies, and reporting. – Opportunities arising from sustainable finance offering and the bank’s approach towards clients and transactions in sectors with an inherently elevated potential for negative environmental and social impacts – Understanding of decarbonization pathways – Improvements related to the bank’s controls as well as compliance and governance topics – Progress in promoting gender diversity, equality, and inclusion Deutsche Bank exchanged views on these topics on a regular basis with capital market participants as well as improvements in overall governance and controls. In March 2022, the bank held its Investor Deep Dive, outlining its strategic evolution and financial targets to 2025. For Deutsche Bank’s third virtual Annual General Meeting, the bank introduced some further shareholder-friendly features to expand its interactive nature. The live audio and video broadcast of the Annual General Meeting was publicly available and viewed by around 10,300 shareholders in total. In 2022, Deutsche Bank continued publishing company information, presentations, speeches, financial results, and non-financial reports on its Investor Relations website to meet information needs of clients, creditors, and investors. The bank also implemented a dedicated Investor Relations ESG section, which went live in February 2023, and webcasts investor events on its website. Regulators Constructive dialog with relevant regulatory and political stakeholders has become even more important admit greater regulatory activity worldwide. It helps the bank make decisions to achieve its strategic priorities and supports the effective functioning of economies globally. Deutsche Bank engages with regulators and governments via in-person and virtual meetings, participation in government-led forums, or responding to consultations through trade associations or individually. Key regulatory topics in 2022 included: – Digitization of banking and society – The EU Banking Union and the Capital Markets Union’s progress – The implementation of the final Basel III rules, and the review of the EU macroprudential framework, the review of the Markets in Financial Instruments Directive, clearing, and – The European Commission’s sustainable finance agenda. Deutsche Bank convened and participated in seminars and public panels, held conversations with policymakers on each of the issues mentioned above. The bank’s Political Affairs function also monitored emerging policymaking and regulatory developments that may impact the bank and developed and coordinates its position on them. Media Deutsche Bank seeks to maintain constructive relationships with journalists and media representatives all over the word. Timely, effective and open communications with the media are essential for building and maintaining Deutsche Bank’s reputation and brand. The bank’s dialogue with media representatives focuses on key topics driven by the economy, investors, regulators and society at large. Sustainability is another key topic. In 2022, the bank’s experts engaged with the media in many ways, including by providing: – Updates on the bank’s progress in implementing its sustainability strategy, with an emphasis on climate risk management, environmental policies and sustainability reporting. – Comments and statements in response to a number of reports and studies from non-governmental organizations, with a focus on information about financing and investment volumes, as well as its sustainability policies and frameworks. – Information on the bank’s approach to climate protection, especially in relation to its loan exposure in highly carbon- intensive sectors (e.g., the bank’s net zero targets), and commitments to climate action 76
Deutsche Bank Governance and operations Non-Financial Report 2022 Stakeholder engagement and thought leadership In 2022, Deutsche Bank responded to numerous media queries and its communications experts accompanied journalists for interviews or background talks with a number of the bank’s senior managers. Furthermore, Deutsche Bank convened and participated in various conferences and public panels, and offered a range of media events and platforms for further dialogue with its stakeholders. Non-governmental organizations Deutsche Bank engages with stakeholders from broader society to understand their views on global environmental and social trends and challenges. For example, the bank continually engages with non-governmental organizations and participates in numerous sustainability-related initiatives. In 2022 the following were important topics of non-governmental organizations engagement: – Climate change, especially in relation to topics such as the financing of the fossil fuels sector in general, and with regards to specific companies and projects – Respect of human rights, partly in the context of specific sectors and regions, e.g., mining in Latin America or the hospitality sector in Qatar – Deforestation, with a sector focus on agriculture and a regional focus on Brazil/Latin America, Africa (e.g., the Congo Basin) and Southeast Asia In 2022, Deutsche Bank responded to written requests, surveys, or questionnaires, and repeatedly met non-governmental organizations in person to discuss the themes of their engagement. Memberships and commitments GRI 2-28 As part of Deutsche Bank’s long-standing commitment to sustainability, the bank has formally endorsed universal sustainability frameworks and initiatives (see “Sustainability strategy). Furthermore, the bank supports several organizations that promote sustainability, and collaborates in industry initiatives at the global, EU, and national level. The bank contributes its expertise to help shape the transition toward a sustainable and climate-neutral economy. In 2022, Deutsche Bank made new commitments to the following initiatives, which address important aspects of its sustainability activities: The bank: – Became an official network partner for the German Ocean Decade Committee, after signing a memorandum of understanding to actively support the United Nations Decade of Ocean Science and Sustainable Development in Germany: the Partnership aims to promote ocean literacy in Germany, raise awareness of the ten challenges outlined by the UN Ocean Decade (*) and to act as a link between German and international Ocean Decade activities – Became a member of RE100, a global initiative led by the Climate Group, that brings together influential businesses committed to using 100% renewable electricity across their operations – Became a member of the EP100 initiative, a global energy productivity initiative also led by the international non-profit Climate Group. EP100 members are committed to doubling their energy productivity, rolling out energy management systems, or achieving net zero carbon buildings, all within set timeframes – Signed up to the World Green Building Council’s Net Zero Carbon Buildings Commitment, pledging to reduce and compensate operational emissions associated with energy used to light, heat, cool buildings, for assets over which it has direct control – Deutsche Bank and The Nature Conservancy started a new partnership to help conserve and restore marine biodiversity across the Asia Pacific region: the partnership consists of four community conservation projects in Indonesia, Hong Kong, China and Australia led by The Nature Conservancy: they aim to safeguard wildlife species and replenish shellfish reefs, one of the world’s most critically endangered marine ecosystems – Joined as a member the Taskforce on Nature-related Financial Disclosures Other examples of its ESG-related memberships and commitments are published on the bank’s responsibility website (*). 77
Deutsche Bank Governance and operations Non-Financial Report 2022 Culture, integrity and conduct Culture, integrity and conduct – Over 500 key central communications promoting a sustainable performance culture – Delivery of a cross-divisional financial crime risk management and culture program GRI 2-16/23/26, 3-3 The commitment to integrity guides everything the bank and its employees do. The bank expects its employees to conduct themselves ethically at all times, to adhere to its policies and procedures and to comply with all applicable laws and regulations. Anything less would prevent the bank from thriving, deepening stakeholders’ trust and safeguarding its reputation. The bank’s core values — integrity, sustainable performance, client centricity, innovation, discipline and partnership — are articulated in a Code of Conduct (*). Its purpose is to guide employees’ interactions with each other as well as the bank’s dealings with its clients, competitors, shareholders, business partners, government and regulatory authorities and society as a whole. The Code is also designed to foster an open, diverse and inclusive environment in which Deutsche Bank’s employees understand what the bank expects of them. It also serves as the foundation for company policies, provides guidance on legal and regulatory compliance and helps Deutsche Bank achieve its corporate purpose. In addition, the Raising Concerns (including Whistleblowing) Policy actively encourages employees to report, without fear of retaliation, any potential misconduct, inappropriate behavior, serious conduct risk and related concerns or suspicions. Employees may do so using the Whistleblowing Integrity Hotline operated by the Whistleblowing Central Function, anonymously if they prefer. The Whistleblowing Central Function is a dedicated team within the bank’s Anti-Financial Crime Function tasked with – Operation of the secure escalation channels – The end-to-end coordination of escalations, thus ensuring appropriate follow-up of reports alleging possible violations of laws, rules, regulations, or policies and procedures to which, violations may result in disciplinary action The Whistleblowing Central Function has personnel in Frankfurt and London. Quarterly reporting on trends and themes is provided to senior management as well as the Supervisory Board’s Audit Committee. In 2022, the Whistleblowing Central Function updated its processes in line with the EU Whistleblowing Directive and aims at continuing to do so in line with country implementation laws as required. These changes widen the protections against retaliation and enhance communication with individuals who raise possible violations. Deutsche Bank recognizes that managing risks effectively is integral to its governance and corporate culture. The bank is committed to constantly challenging itself to improve, learning lessons from past events and applying them to improve in the future. Pursuant to its risk management principles and risk governance outlined in the 2022 Deutsche Bank Annual Report – Management Report – Risk Report, the bank has three Lines of Defense for managing risks, which is integral to the bank’s risk culture, a sub-component of culture, with roles and responsibilities of the three Lines of Defense being outlined in Deutsche Bank’s risk management framework. Culture, Integrity and Conduct program Purpose and governance GRI 2-9/12/13/23/24, 3-3 The bank’s Culture, Integrity and Conduct (CIC) program has been in place since early 2018. Its purpose is to reinforce the bank’s aforementioned values and further enhance integrity and ethical conduct across the organization. It is overseen by the Culture, Integrity and Conduct Committee, a committee established by the whole management board. The program is a part of the Committee’s mandate, with the Committee being co-chaired by the Chief Administrative Officer and the Management Board member responsible for Investment Bank and Corporate Bank. It consists of representatives of each business division and key infrastructure functions, who are appointed by the Management Board member responsible for the respective division or function. 78
Deutsche Bank Governance and operations Non-Financial Report 2022 Culture, integrity and conduct The Committee creates a central plan annually for promoting ethical culture at the bank, including company-wide communications plans and Human Resources programs. In addition, the bank’s divisions and infrastructure functions develop and implement their own culture plans and are responsible for promoting ethical culture in each of their respective units. These plans incorporate mandatory initiatives defined by the Committee as well as the divisions’ and infrastructure functions’ own initiatives to address their key individual requirements. The Committee oversees the Culture, Integrity and Conduct program as well as the divisions’ and functions’ efforts to promote ethical culture. The divisions and functions set their own milestones and timelines and report them to the Committee annually. In addition, they provide the Committee with quarterly updates on the implementation of their plans and must submit evidence of progress to ensure that the plans are on track with the timeline of the Culture, Integrity and Conduct program. On a quarterly basis, the Committee reviews and evaluates 26 key culture-related metrics across the bank, such as employee complaints, analysis of employees’ adherence to certain risk-related policies and procedures, results of investigations (Human Resources, Group Audit and Anti-financial Crime). In addition, it assesses information gleaned from surveys and input from business leaders in order to identify key culture and conduct focus areas. The Committee also produces an annual Global Report which evaluates what the Committee has accomplished and how it can effectively work to further improve ethical culture in the following year (the Culture, Integrity and Conduct book of work). The divisions produce their own Culture, Integrity and Conduct Divisional Reports which are tailored to their specific profiles and are drawn on for the Global Report. The annual People Survey asks employees for feedback to gauge how they experience working for the bank and measure progress on key aspects of its culture, including key indicators such as commitment and enablement. In 2022 the survey included eleven questions to provide insights into how employees experience ethics, conduct and the Speak-Up Culture at the bank and seven questions about raising concerns. Results showed that people continue to experience an environment that lives up to the bank's standards with the vast majority feeling able to express themselves. The results demonstrated that compared to the previous years, more people feel able to raise concerns and know how to do so. More information on the People Survey can be found in the section on “Employee Feedback Culture”. Key topics and initiatives in 2022 GRI 2-26, 404-2 Deutsche Bank’s long-term aim is to foster a sustainable performance culture in which all employees and managers feel empowered and can realize their potential. In 2022, the Culture, Integrity and Conduct program continued to focus on Purpose, Trust and Accountability. With a focus on trust, the bank built upon the Speak-Up activities and expanded their reach and scope beyond raising concerns to empowerment and purpose. This revised Speak-Up message supports the bank’s focus on accountability by enhancing the supervision culture, and as such supports the continued evolution of the Culture, Integrity and Conduct agenda. Commencing in 2022 all new managers are now automatically enrolled onto the two-and-a-half-hour virtual classroom course on Speak-Up. The Culture, Integrity and Conduct program has undertaken a number of initiatives during 2022 to achieve its aim, and continues to conduct ongoing company-wide and divisional specific communications initiatives on the focus areas (trust, accountability and purpose), which are integral to the bank’s efforts to cultivate an environment where employees feel safe, included, productive and comfortable getting involved and proposing innovations. In 2022 over 500 messages relating to culture, integrity and conduct related topics were launched, with topics including: – Fostering the bank’s Speak-Up Culture, particularly regarding potential misconduct such as the use of unauthorized communication channels – Regular engagement by management with their staff about topics related to culture, integrity and conduct Further, the Culture, Integrity and Conduct program provides the bank’s divisions and functions with toolkits to help bring these topics to life, e.g., the Leadership Kompass Manager Guide, Unconscious Bias toolkit and Everyday Inclusion trainings. Human Resources continues to enhance the Consequence Management framework for large-scale, long-running and complex investigations. In order to support the bank’s view that consistent and transparent outcomes will enhance employee compliance as well as corporate culture and work environment, in which work has been undertaken to consolidate the Managing Performance & Developing Careers policy with the Compensation & Benefits Policy and Framework along with Consequence Management to provide a single stop source for employees and managers to refer to; the document is planned to be published in the second quarter of 2023 as part of a Performance Consequences and Reward Policy. 79
Deutsche Bank Governance and operations Non-Financial Report 2022 Culture, integrity and conduct Financial Crime Risk Management has been a focus for the culture, integrity and conduct during 2022, whereby the bank designed, delivered and completed a cross-divisional Financial Crime Risk Management & Culture program, which delivered a global financial crime risk education and culture strategy for use across all divisions, with stakeholders from across all three Lines of Defense brought together to collectively oversee, coordinate, and drive financial crime risk education under a consistent bank-wide strategy. This strategy included – The establishment of a Global Financial Crime Risk Education Working Group, implementation of cross-divisional minimum standards – Annual cross-divisional financial crime risk training needs analysis across six key areas of financial crime risk which supported the creation and implementation of financial crime risk education plans Another key initiative overseen by the Culture, Integrity and Conduct program in 2022 is the supervision and culture read across (in response to an operational incident) to assess potential related enhancements to the supervisory framework, control framework and overall culture. The read-across exercise noted a number of themes which were taken forward for development and implementation and included – Enhanced communications around lessons learned for sensitive investigations (providing guidance on how tailored scenarios and discussion content can be prepared and shared with impacted employees without compromising the confidentiality requirements of the investigation) – A comprehensive, scenario-based training exercise designed and rolled out to all supervisors within the impacted divisions – A Culture Review Framework which seeks to identify areas of the organization that may be exhibiting poor or negative culture, with the aim to making relevant recommendations for enhancement 80
Deutsche Bank Governance and operations Non-Financial Report 2022 Public policy and regulation Public policy and regulation – Continuing political dialogue – Clear rules for engagement with politicians and regulators – Sustainable finance, Basel III and digitalization of particular importance GRI 3-3 The banking industry is subject to extensive, complex, and frequently reviewed policies and regulations. This exposes the bank to significant regulatory risks. Deutsche Bank systematically prioritizes these risks and assigns clear accountability for identifying regulatory changes, assessing their impact, and taking the steps necessary to ensure compliance. Governance GRI 2-13, 3-3, FS3 Deutsche Bank has a clearly structured framework for managing the risk of regulatory change and enhancing its profile in policy and regulatory debates. The framework enables Deutsche Bank to engage with relevant regulatory and political stakeholders. It also ensures informed strategic decision-making and provides oversight and control over how key regulatory initiatives are implemented. Amid greater regulatory activity worldwide, advocacy has become even more important for the bank. The Political Affairs function is responsible for conducting transparent and constructive government and regulatory advocacy on behalf of the bank. The function’s aim is for this advocacy to support not only the bank but also the governments and regulators, as well as all Deutsche Bank’s stakeholders: employees, clients, investors, and the countries where the bank operates. The Political Affairs function also monitors emerging policymaking and regulatory developments that may impact the bank and develops and coordinates the bank’s position on them. In addition, it advises senior management and clients on global political trends and geopolitical risk. Effective September 2022, this function is assigned from the Chief Executive Officer to the Global Head of Corporate Affairs & Strategy, who reports to the Chief Executive Officer. All other responsibilities and setup did not change. The global Political Affairs team is led by the Global Head of Political Affairs, who reports directly to the Global Head of Corporate Affairs & Strategy. The team consists of around 20 employees (Full Time Equivalent, FTE) in key business and political hubs: Frankfurt, London, New York, Berlin, Brussels, and Washington. The Political Affairs function works closely with the Regulatory Affairs function. The latter is the principal point of contact for key supervisors and is responsible for managing the bank’s relationships and collaboration with them. It also supports senior management’s interactions with these supervisors. The Regulatory Affairs function provides insights into emerging supervisory priorities so that the bank can respond swiftly and appropriately, and ensures continual focus on ongoing matters, such as onsite visits as well as findings and commitments. The function is led by the Global Head of Regulatory Affairs, who reports directly to the Chief Administrative Officer. Employee-stakeholder interaction GRI 2-12/23, FS1 Deutsche Bank sets clear rules and procedures for interactions between employees and policy and regulatory stakeholders. The Supervisory Authorities Engagement Policy governs interactions with core regulators in the United States, Europe, Hong Kong, and Singapore. It requires all such interactions to be logged and minuted by the relevant Regulatory Management Group. In addition, interactions with the German Federal Government and the German Parliament as well as with the EU institutions must comply with the bank’s policy on Representation of Interests. This policy sets the standards for interactions with representatives of the German Federal Government and the German Parliament as well as of the EU institutions. It provides a centralized clearance of the contacts with representatives of these institutions in so far, they are carried out with the aim of directly or indirectly influencing the decision-making process and especially the formulation or implementation of policy or legislation. Deutsche Bank also has policies regarding its U.S. lobbying activities and employees’ political contributions to Deutsche Bank Americas’ Political Action Committee (for more information, see “Group policy does not permit donations to political parties” below). 81
Deutsche Bank Governance and operations Non-Financial Report 2022 Public policy and regulation In addition, Deutsche Bank has a global policy in place to ensure that its communications with supervisory authorities are consistent. Regarding engagements in political dialogue, all employees must adhere to the bank’s global Anti-Bribery and Corruption Policy. This policy lays out rules for the offering and acceptance of gifts by Deutsche Bank employees, employees’ participation in events organized by third parties, and the associated record keeping. Financial transparency GRI 415-1 (*), which requires it to comply with the register’s code of conduct The bank is a signatory to the EU Transparency Register and to disclose an estimation of expenditures for advocacy toward EU institutions. In 2022, the bank had three employees (full time equivalent) focused on political engagement in the EU. Annual estimated costs related to activities covered by the Register were € 1,750,000 to € 1,999,999. These costs consisted of, among other things, expenses for the bank‘s Brussels offices, including staff there as well as staff outside of Brussels and a percentage of membership fees in associations active at the EU level. In addition, Deutsche Bank is a signatory to the Federal German Lobbying Register, which requires to comply with a code of conduct and to disclose, among others, an estimation of expenditures for advocacy toward the Federal German Government and German Parliament. Annual estimated costs, based on the provision of law and related to activities covered by the Register, were € 3,570,001 to € 3,580,000. In addition, Deutsche Bank is also reported in the respective Lobbying Registers in the States of Bavaria and Baden-Württemberg. Those registers improve the transparency of Deutsche Bank’s political engagement in Germany. Group policy does not permit donations to political parties GRI 2-23, FS1 Pursuant to the bank’s Group Policy on Donations, Memberships & Sponsorships, the Group does not permit direct or indirect donations to political parties. The bank’s Anti-Bribery and Corruption function must pre-approve donations to organizations affiliated with political parties or activities relating to governments and/or political parties. Employees who are U.S. Citizens or green card holders living in the United States may make voluntary donations to the Deutsche Bank Americas’ Political Action Committee (PAC). The PAC is regulated by the U.S. Federal Election Commission; the PAC makes monthly public filings to the Federal Election Commission as required by law. Corporate contributions to federal elections are prohibited. U.S. law therefore prohibits contributions by the bank to the PAC, although the bank may pay the PAC’s administrative costs. Memberships in trade associations GRI 2-28, 415-1 Deutsche Bank is a member of a number of trade associations globally. Deutsche Bank engages with trade associations and brings in inhouse experts into their relevant working groups, supports their work on consultation processes and filters back feedback on their positions where Deutsche Bank considers this relevant or can leverage inhouse expertise. The Chief Executive Officer Christian Sewing is president of the Associations of German Banks (Bundesverband deutscher Banken, BdB) and designated president of the European Banking Federation (EBF – starting March 2023), he has highlighted the relevance of the banking sector to shape the transformation to a digital and sustainable economy. 82
Deutsche Bank Governance and operations Non-Financial Report 2022 Public policy and regulation Memberships in important trade associations in 2022 A selection Region Association of German Banks (Bundesverband deutscher Banken - BdB), including regional associations EU Association for Financial Markets in Europe (AFME) EU International Swaps and Derivatives Association, Inc (ISDA) EU German Derivative Association (Deutscher Derivate Verband - DDV) EU Association of German Pfandbrief Banks (Verband deutscher Pfandbriefbanken - VdP) EU UK Finance UK Institute of International Bankers (IIB) USA Council on Foreign Relations, Inc (CFR) USA Trade Association for the Emerging Markets (EMTA) USA American Bankers Association (ABA) USA National Automated Clearing House Association (NACH) USA Structured Finance Industry Group USA National Council of Real Estate USA Securities Industry and Financial Markets Association (SIFMA) USA Investment Company Institute (ICI) USA U.S. Chamber of Commerce (USCC) USA Institute of International Finance (IIF) USA National Association of Financial Market Institutional Investor China (NAFMII) APAC Asia Securities Industry & Financial Markets Association (ASIFMA) APAC International Bankers Association (IBA) APAC Japan Securities Dealers Association (JSDA) APAC Key topics in 2022 In 2022, Deutsche Bank convened and participated in seminars, public panels and held conversations with policymakers on the digitalization of banking and society, the EU Banking Union and the Capital Markets Union’s progress, the implementation of the final Basel III rules, the review of the EU macroprudential framework, the MiFID review, clearing, and the European Commission’s sustainable finance agenda. On each of these issues the bank also submitted written input, for instance, in public consultations. On the implementation of the final Basel III rules, in the EU, the implementation is through amendments to the EU prudential framework (Capital Requirements Regulation and Directive: CRR/CRD). The European Commission issued proposals in October 2021, which are currently debated by Member States (Council) and European Parliament. The proposals change the way banks calculate their Risk-Weighted Assets and restrict the use of internal models for all types of risk. They also cover other topics, such as suitability assessment for certain bank managers. The bank is convening and participating in meetings with policymakers related to this file. The final Basel III rules will also be implemented in other jurisdictions, with the UK launched this process in November 2022 and U.S. is expected to follow soon. In 2022, legislation related to sustainable finance also played a role in the bank’s engagement with political stakeholders and contributions to trade associations regarding these topics. The further development of the EU Taxonomy was an important aspect. In this context, the Commission’s proposal for a voluntary European Green Bond Standard which aligns projects financed to the rules of the EU Taxonomy is currently under negotiations in Brussels. The Corporate Sustainability Reporting Directive (CSRD) was finalized in 2022 and will apply for Deutsche Bank for the full year reporting 2024. Another important development was the publication of the draft proposal for a Corporate Sustainability Due Diligence Directive (CSDDD) in February. The CSDDD among other aspects establishes due diligence obligations for corporates to avoid and mitigate human rights and environmental risks in companies’ value chains. In Germany corporates prepared for the implementation of the German Supply Chain Due Diligence Act which became applicable on 1 January 2023. In June 2022, the new term of the German Sustainable Finance Advisory Committee started. It supports the German federal government in developing Germany into a leading location for sustainable finance in line with the guiding principle of financial stability and sustainability. The Chief Financial Officer Investment Bank, Corporate Bank & ESG has been nominated again as a member of the Committee. Deutsche Bank sent a delegation to attend the 2022 UN climate conference. The bank’s sustainability experts engaged on sustainability issues at COP27, which was held in Sharm El Sheikh, Egypt. U.S. regulators continued to focus on climate-related initiatives and policies within their existing remits in 2022. Notable developments include, in March 2022, the Securities and Exchange Commission released their anticipated proposal on climate disclosures for public companies which would require certain climate-related information (including scope 1, 2 and 3 emissions) to be included within a company’s annual filings. This also may affect Deutsche Bank’s Group reporting, as the bank’s share is listed at the New York Stock Exchange. Depending on the circumstances, these reporting requirements may not be aligned to corporate reporting requirements stemming from EU regulation. 83
Deutsche Bank Governance and operations Non-Financial Report 2022 Public policy and regulation On digital topics, regulatory activity had a strong focus on cloud, data and resilience. Political discussions in the EU are dominated by the ambition to achieve “digital sovereignty”, manifesting in increasing scrutiny of cross-border data flows and non-EU service providers. In 2022, the European Commission published a proposal for an EU-Data Act, with the aim of facilitating data access and sharing and setting a general framework for sectoral data access obligations. This framework will provide the basis for potential future legislation on Open Finance. The EU-Data Act also introduces requirements for the switching of cloud services, to increase interoperability and address vendor lock-in. In parallel, there is ongoing work on cybersecurity requirements for cloud services, following strict approaches towards the use of non-European cloud service providers. The Council of the EU adopted the Digital Operational Resilience Act, which introduces a direct oversight regime for critical technology providers in November while the UK authorities (Bank of England, His Majesty’s Treasury and Financial Conduct Authority) published a discussion paper on Critical Third Parties in September. The US Treasury is working on a report on cloud computing originally expected to be published before the end of 2022. The draft EU Regulation on Artificial Intelligence (AI) is still under development. In September 2022, the European Commission also published a proposal for a Directive on liability for artificial intelligence applications, which will be negotiated in parallel. The emergence of crypto assets and their use for investment and payment purposes required supervisors to provide targeted guidance for an ecosystem that lacks a robust legal basis and adequate consumer protection measures. In parallel, regulators across the globe review their frameworks and, where appropriate, extend them to crypto assets. This became particular imminent in the course of numerous insolvency and fraud cases related to individual crypto assets or -platforms. Whilst Deutsche Bank does not yet actively engage in any business models related to crypto assets, it closely follows the regulatory developments worldwide. In parallel, and in response to the progressing digitalization of the economies and societies and with a view to retaining the sovereignty of their national currencies, 90% of the central banks globally are assessing or have assessed the feasibility of issuing central bank digital currencies as a new form of central bank money. This has the potential to significantly change monetary systems and is therefore of key relevance for banks. Moreover, governments and central banks worldwide are focusing on increasing the use of real-time payments, increasing the supply of and access to payment services through innovative new solutions, as well as enhancing cross-border payments. For example, the European Commission reviews the impact of the revised Payment Services Directive, in effect since 2018, and published a legislative proposal for instant payments in October 2022. The G20 countries further developed the multi- year action plan for cross-border payments agreed in 2020, including the definition of key performance indicators to measure progress and priorities for future regulatory initiatives. 84
Deutsche Bank Governance and operations Non-Financial Report 2022 Anti-financial crime Anti-financial crime – Preventing, deterring, detecting and reporting financial crime – Maintaining a regular dialogue with supervisory control functions – Continuing to increase investments in financial crime controls Vision and mission GRI 2-12/23/24, 3-3 Financial crime has a detrimental impact on society and can have severe consequences for individuals. Organized crime engages in fraud, bribery, corruption, money laundering, terrorist financing as well as human, drug and arms trafficking. The outcome harms individuals, institutions, and the integrity of the financial system. Criminals use complex schemes including targeted placement and layering across different borders in their attempt to integrate the proceeds of their crimes back into the global financial system. Deutsche Bank is targeted directly by criminal organizations who want to exploit the bank’s global financial products and services to support their illegal activities. Effective anti-financial crime controls are critical components of Deutsche Bank’s strategy to prevent, detect, and report these illegal activities. This includes in-depth knowledge about Deutsche Bank’s customers, their source of funds, and their source of wealth. If criminals find a way around these control measures, individuals or institutions can be harmed and Deutsche Bank can suffer reputational damage as well as severe financial penalties. Fighting financial crime is an integral part of the bank’s business activities and continuous improvements to the Group’s capabilities in fighting financial crime are a critical priority. The Management Board, and all employees, are required to adhere to the highest standards of conduct to fight financial crime. Every employee is responsible for the management of financial crime risk. This includes: (i) The prevention of financial crime by observing obligations, policies and procedures. All financial crime risk policies are available in a dedicated policy portal, reviewed annually and changes are communicated to all employees. Familiarity is reinforced through mandatory training and failure to comply can lead to disciplinary action. (ii) The detection of unusual or suspicious behavior or patterns including the use of transaction monitoring systems which generate alerts that are reviewed by dedicated and trained teams of employees and (iii) The reporting of customers, third parties and/or transactions that appear unusual. Governance GRI 2-9/12/13/24, 3-3 The ultimate decision and authority regarding financial crime risks lies with the Group Anti-Money Laundering Officer, who is, at the same time, the Head of Deutsche Bank’s Anti-Financial Crime function (AFC) and reports to the Chief Administration Officer. The Group Anti-Money Laundering Officer is a delegated authority from the Management Board authorized to establish a financial crime risk management framework and take any measures necessary to manage financial crime risks appropriately and in consideration of applicable legal requirements. AFC acts as an independent function, setting policies and standards for the management and mitigation of financial crime risks at Deutsche Bank. Deutsche Bank’s business divisions are responsible and accountable for the implementation and operationalization of these policies and standards. The Management Board ensures that AFC can execute its tasks independently and effectively. The Supervisory Board of Deutsche Bank is informed about the status of financial crime risk management on a regular basis by the Management Board and the Group Anti-Money Laundering Officer according to German law. For example, the Group Anti-Money Laundering Officer and the responsible Management Board member provided quarterly updates to the Supervisory Board’s Audit Committee. The Supervisory Board and Management Board execute strong engagement and tone from the top with focus on compliance and financial crime risk matters in key committees. The Supervisory Board is well staffed and equipped to oversee the bank’s efforts in this regard. Since 2020, the Supervisory Board has set-up a dedicated Financial Crime Risk Working Group to conduct additional monitoring and to provide holistic advice to the Management Board for the purpose of remedying shortcomings in the Anti-Money Laundering function. In 2022, the Regulatory Oversight Committee has been established, which is mandated to provide central oversight across regulatory engagement and remediation across the bank. 85
Deutsche Bank Governance and operations Non-Financial Report 2022 Anti-financial crime Key topics in 2022 GRI 3-3 Resources and transformation execution There are dedicated employees within AFC, the business divisions, and Deutsche Bank’s technology function whose main task is to manage financial crime risks. In 2022, AFC initiated a hiring strategy to strengthen execution and leadership capabilities, which led to a substantial increase of AFC’s headcount. The AFC leadership team was enhanced with a number of senior hires including heads for the regions Americas, United Kingdom and Ireland, and a Head of Financial Crime Data & Risk Intelligence. At year end 2022, AFC had 1,932 employees (Full Time Equivalent, FTE), which is an increase of 343 FTE as compared to 2021. At year end 2022, AFC was also supported by 192 contingent workers. Beyond hiring, Deutsche Bank continued to execute core change initiatives focused on remediating internally and externally identified issues and proactively enhancing controls for financial crime risks. The oversight of the central financial crime risk remediation program now falls under the additional oversight of Deutsche Bank’s Chief Transformation Office for consistency and to support the integration across remediation plans. This central program is expected to move Deutsche Bank into a sustainable environment, including robust Know Your Client (KYC) checks by business divisions for client adoption, ongoing monitoring by control functions, dynamic risk assessments, risk appetite matching and independent audits by a specialized audit team. Partnerships The fight against financial crime requires an exchange of knowledge and experiences to improve and further develop an effective management of financial crime risks. In 2022, Deutsche Bank deepened its existing industry engagements by strengthening its ties with its associations, such as the Wolfsberg Group of Banks, but also its involvement in public private partnerships (collaborations between the public and private sector), such as (1) the German Anti Financial Crime Alliance (AFCA) which is composed of representatives from both the financial and non-financial sector, as well as the public authorities including Germany’s Financial Intelligence Unit, German Federal Financial Supervisory Authority (Bundesanstalt für Finanzdienstleistungsaufsicht, BaFin) and the German Federal Criminal Police Office (Bundeskriminalamt, BKA) and where Deutsche Bank’s Management Board member Stefan Simon became part of the AFCA Board; (2) Europol’s Financial Intelligence Public Private Partnership (EFIPPP) where the deputy Head of AFC became part of EFIPPP’s Steering Group and (3) the UK Joint Money Laundering Intelligence Taskforce. Furthermore, Deutsche Bank and Visa announced a collaboration on the prevention of online retail frauds with an automated fraud detection system, Cybersource, owned by Visa. Russian sanctions The Russian invasion of Ukraine led to a significant increase in sanctions against Russian state entities, companies and individuals linked to Russia. Deutsche Bank manages these sanctions with enhanced communications, guidance, and operational support led by AFC’s Sanctions & Embargoes team. Orders and fines related to financial crime risk On September 28, 2022, BaFin ordered Deutsche Bank AG to take specific measures aimed at preventing money laundering and terrorist financing in order to implement the orders that BaFin issued on September 21, 2018, and February 15, 2019. In July 2022 the bank accepted a fine of € 7 million for the administrative offence of delayed filing of two Suspicious Activity Reports (SAR) in a historic matter thereby ending the Frankfurt public prosecutor’s investigation into this matter, in relation to which a search took place at Deutsche Bank’s headquarters on April 29, 2022. Risk exposure and controls GRI 2-23/24/25/26, 3-3, 205-1/2/3, FS1, FS3 Deutsche Bank’s inherent exposure to financial crime risks is influenced by its clients’ footprint and transaction behavior, the geographies in which it operates, the products and services offered, and the sales channels used. The exposure to various financial crime risks is subsumed under money laundering, terrorist financing, sanctions and embargoes, internal and external fraud and bribery and corruption. 86
Deutsche Bank Governance and operations Non-Financial Report 2022 Anti-financial crime Money laundering and terrorist financing Money laundering and terrorist financing are significant risks to Deutsche Bank, e.g., in the Corporate Bank which provides banking facilities to correspondent banks and their customers. To control these risks, minimum control standards are defined including, among others, risk-based client due diligence, the monitoring of transactions, name list screening, investigation of alerts and the filing of suspicious activity reports to authorities. These Suspicious Activity Reports can be triggered by alerts from Transaction Monitoring, internal referrals from employees, enquiries of law enforcement or referrals from other banks. Further measures include assessing the risk exposure in the client population and reducing the exposure through, for example, terminating relevant client relationships and liquidating or reducing risk in relevant and associated positions. The Anti-Money Laundering Policy contains the minimum control requirements and is updated regularly in line with regulatory developments and supplemented with internal safeguarding measures. Sanctions and embargos Deutsche Bank is committed to complying with sanctions imposed by the United Nations, European Union, and Germany globally as well as sanctions applicable in the jurisdictions in which it operates, especially the United States and United Kingdom. To control this risk, transactions are filtered, client and counterparty data is screened, trade in sanctioned financial instruments is restricted, and further measures such as rejecting or freezing a transaction, restricting client activities, or exiting a client relationship are taken. The Sanctions Policy – Deutsche Bank Group sets out the requirements and standards that apply globally within the bank. Anti-fraud, bribery and corruption Deutsche Bank has no tolerance for its employees, or third parties acting on its behalf, to engage in bribery or corruption and is committed to compliance with anti-bribery and corruption laws in the jurisdictions in which it operates. On an annual basis the Bank undertakes an assessment of inherent bribery and corruption risks and corresponding controls across all of its businesses. All Bank employees, including board members, are required to complete mandatory online anti-bribery and corruption training. Employees who do not complete their training are subject to potential disciplinary action. The bank has policies, procedures, and controls to mitigate the risk of bribery and corruption across key risk areas such as gifts and entertainment, hiring practices, use of third-party intermediaries, and participation in joint ventures as well as in strategic investments. These controls include the escalation of approvals, enhanced due diligence, contractual limitations, and ongoing monitoring to identify behaviors that could be indicative of bribery and corruption. As with all AFC policies, changes to the anti- corruption policies are communicated to all employees. The Bank has continued to reduce its exposure to areas that present a higher inherent risk of bribery and corruption, such as use of Business Development Consultants. Finally, potential instances of bribery or corruption would be investigated, and any employee determined to be engaged in such behavior would be subject to disciplinary action up to and including termination of employment. The Bank has implemented a holistic Fraud Risk Management Framework across all Lines of Defense, defining governance and minimum standards, and establishing key controls to mitigate the risk of fraud, such as Mandatory Time Away and Fraud Transaction Monitoring. Targets and measures GRI 2-24/26, 3-3, 205-2, 404-2, FS4 At Deutsche Bank, AFC defines the uniform strategy for the prevention of financial crime, including the preparation of group- wide policies and overseeing the implementation. The accountability for the definition and regular review of the risks controlled by AFC lies with the Group Anti-Money Laundering Officer. In order to be able to understand the required measures, it is important to capture, identify and weigh the financial crime risk Deutsche Bank is faced with. AFC regularly conducts an analysis of the financial crime risks and prepares a risk assessment for Deutsche Bank Group, as well as relevant subsidiaries to the extent required by applicable legal requirements. The risk analysis is reviewed annually and approved by the responsible Management Board member. Changes within the organization, but also the offering of new products can have an impact on the bank’s risk exposure. AFC is involved in structural divisional changes such as new products, new lines of business, expansions to new countries or new client categories to ensure the changes are within the Bank’s risk appetite and that effective risk assessment, monitoring and controls are defined before their launch. In order to adjust the strategy in a timely way to an ever-changing legal environment, AFC monitors requirements and advises and supports the Management Board and employees in the business divisions on changed requirements and their implementation into relevant policies. 87
Deutsche Bank Governance and operations Non-Financial Report 2022 Anti-financial crime Deutsche Bank’s most critical asset against financial crime risks are its employees. Deutsche Bank promotes a risk culture that encourages employees to speak-up and a thorough awareness for financial crime risks. Deutsche Bank has carefully nurtured a culture of compliance and integrity in the bank, including the fight against financial crime. Tone from the top is extremely important and senior management is highly committed to drive cultural change through behavioral changes and reinforcing the change. Culture initiatives are driven both on group and divisional level across Deutsche Bank and a culture review framework is in place to identify areas that may be exhibiting poor culture to act through targeted culture reviews. Special focus is put on speak-up, which is subject of wide-ranging training efforts and communication campaigns. Regular (at least annual) training for all employees is conducted covering all financial crime risks and testing their policy knowledge. There is a mandatory curriculum accompanied by other additional facultative training offerings. The training modules highlight the importance of identifying financial crime risks and raising concerns or suspicions including the use of the anonymous whistle-blower hotline. Modules articulate personal, professional, financial, regulatory, and societal consequences of failing to manage financial crime risks. A completion rate of 99,96% has been achieved for the learners required to complete the mandatory anti-financial crime training by year end 2022. Learners who have not completed the training within the final due date are reported to the Compliance red flag team for investigation and may receive a red flag, if eligible. Management Board members receive ongoing periodic online training about financial crime topics as well as in-person tailored training and briefings on topics such as the risks of cryptocurrency. (*) which Deutsche Bank discloses ESG related reports and events under its Investor Relations website ESG – Deutsche Bank includes both certifications and documentations and discloses on AML, Know Your Customer (KYC) and the U.S. Patriot Act KYC/AML/Patriot Act – Deutsche Bank (*). 88
Deutsche Bank Governance and operations Non-Financial Report 2022 Tax Tax – Clear principles of conduct and behavior as they relate to the bank’s tax affairs – Tax governance and control framework fully embedded into the bank’s operating principles and models GRI 3-3, 207-1/3/4 Deutsche Bank’s tax strategy and related policies set out principles of conduct and behavior as they relate to the bank’s tax affairs. These key principles are: – Deutsche Bank undertakes its tax affairs on a basis which generates sustainable value while meeting applicable legal and regulatory tax requirements – Deutsche Bank gives due regard to the intent and spirit of tax laws, the social context within which the bank operates, and the bank’s standing and reputation with the public, tax administrations, regulators, and political representatives (*) and principles, which have been approved by the Management Board, apply to all businesses and The Tax Strategy entities. They enable the bank to manage the tax affairs in a way which aims to ensure that the tax consequences of business operations are appropriately aligned with the economic, regulatory and commercial consequences of those business operations, with due regard being given to the potential perspective of the relevant tax authorities. The bank aims for its dealings with tax authorities to be undertaken in a proactive, transparent, professional, courteous, and timely manner and seeks to develop and foster good working relationships with tax authorities. The bank monitors developments and legislative changes and routinely updates its tax strategy and related policies and procedures in response. In recent years the EU’s mandatory tax disclosure directive known as DAC6 has been an area of significant focus for the bank. DAC6 required EU member states to introduce tax reporting obligations for taxpayers and intermediaries (such as banks) in relation to cross-border arrangements containing specified tax hallmarks. The bank evaluated its products and services against DAC6’s reporting requirements, taking into account administrative guidance where available, and introduced policies and workflow procedures to ensure continuing compliance. The bank’s tax strategy was updated accordingly. The OECD and the European Union (EU) continue to be focused on wide ranging changes in the principles of international taxation emanating from the OECD's Base Erosion and Profit Shifting agenda. On December 20, 2021, the OECD issued model rules for a global minimum tax under Pillar Two (‘Global Anti-Base Erosion Model Rules’). These model rules create an internationally coordinated system of taxation intended to ensure that multinational enterprises pay a minimum level of tax of 15% in each jurisdiction in which they operate. The United States are not expected to implement a global minimum tax under the Pillar Two OECD model rules in the near future. Instead, in August 2022, the U.S. enacted the corporate alternative minimum tax (CAMT). The CAMT is imposed at a rate of 15% on profits before tax, typically determined under U.S. Generally Accepted Accounting Principles. The CAMT is not expected to increase the bank’s overall tax burden but may accelerate tax payments. The bank is estimated to be subject to the CAMT starting in 2023 or 2024. Unlike the U.S., the EU issued a draft directive to implement the OECD model rules on December 22, 2021, and the directive was adopted on December 15, 2022. The provisions under the EU directive will need to be transposed into national law by Germany and the other EU member states and are expected to take effect beginning with tax year 2024. The bank’s in-house tax function has set up a working group to monitor developments and start assessing potential future implications and implementation efforts. Deutsche Bank is represented with its active subsidiaries and branches in almost 60 jurisdictions. On a combined basis Deutsche Bank’s blended statutory tax rate across all these jurisdictions on average amounts to 28% to 30%, which is significantly higher than the contemplated minimum tax of 15%. Of the close to 60 countries, six apply a statutory tax rate of less than 15% to the bank’s operations. As of December 31, 2022, none of these countries are listed on the EU list of non- cooperative jurisdictions for tax purposes. On February 14th, 2023, the Council of the EU added Russia to such list. The implications for Deutsche Bank and its Russian operations are currently under review. As a matter of principle, Deutsche Bank reports its profits in the countries in which they are generated, this means that profits are also taxed in those countries. The intercompany transactions are undertaken on an arm’s length basis in accordance with internationally accepted OECD transfer pricing principles, giving due consideration to applicable local rules and requirements. Deutsche Bank does not undertake uncommercial artificial steps for the purpose of obtaining tax benefits. 89
Deutsche Bank Governance and operations Non-Financial Report 2022 Tax Further details on the bank’s international operations are provided in Deutsche Bank’s 2022 Annual Report, which discloses the income tax expense or benefit in the jurisdictions in which the bank operates (see Annual report 2022, Note 43 – Country by country reporting). For information on the domicile of the companies, names and their primary activities please refer to the shareholdings list (see Annual Report 2022, Note 44 – Shareholdings). The geographical location of subsidiaries and branches considers the country of incorporation or residence. To enhance the understanding of the Country by Country reporting the following explanatory information is provided. The Country-by-Country information reported is derived from the IFRS Group accounts of Deutsche Bank. It is, however, not directly reconcilable to other financial information in the Annual Report because of specific guidance published by the Bundesbank on December 16, 2014, which includes the requirement to present the country information prior to the elimination of cross-border intragroup transactions. In line with this requirement, only intragroup transactions within the same country are eliminated. As an example, the dividend income received by a group entity in Country X from a subsidiary in Country Y is not included in the IFRS Group accounts, as these are eliminated in consolidation. However, they are included in and reported in the results of Country X in the Country-by-Country reporting. As a matter of principle such intra-group dividend income is generally tax-exempt in most jurisdictions to avoid double or multiple layers of taxation. Accordingly, these specific reporting requirements can have a significant impact on the jurisdictional effective tax rate shown in the Country-by-Country reporting, which may differ from the country’s statutory tax rate. Moreover, the disclosed income tax expense or benefit may also reflect various other adjustments required by tax law, e.g., non-tax-deductible expenses or tax-exempt income. In 2022, Deutsche Bank Group total income tax benefit amounted to € 64 million (see Annual Report 2022, Consolidated Statement of Income as well as Note 34 – Income Taxes) and income taxes paid during 2022 amounted to € 1,288 million in the year 2022 (see Annual Report 2022, Consolidated Statement of Cash Flows). Governance GRI 3-3, 207-2 Deutsche Bank operates a Three Lines of Defense risk management model. Based on this model, the bank has a clear framework setting out roles and responsibilities among the various functions for defined tax types to ensure that it remains compliant with the bank’s tax obligations. For example, the in-house tax function is an independent risk and control function separate to the business divisions and the bank employs skilled professionals to ensure that its position with respect to the bank’s own tax matters is robust. Preventing infringements GRI 3-3, 207-2, FS3 The bank operates a control framework and governance to ensure, in all material aspects, that it is compliant with applicable tax laws, files accurate tax returns, and pays the amount of tax due. In addition, tax evasion, which is a financial crime, is illegal and goes against Deutsche Bank’s culture, values and beliefs and the bank’s policies strictly prohibit aiding or abetting tax evasion. Deutsche Bank advocates for the development of sound regulations and internal procedures to combat financial crime, including tax evasion, and does not endorse actions that for example seek to undermine tax reporting of financial account information under applicable legislation, such as the Common Reporting Standard (CRS) and the Foreign Account Tax Compliance Act (FATCA). These requirements are also intended to prevent the bank from committing or facilitating – intentionally or negligently – criminal offenses. For more information on termination/discontinuation of relationships with clients, see also the chapter “Anti-financial crime – Inherent exposure to financial crime”. 90
Deutsche Bank Governance and operations Non-Financial Report 2022 Data protection Data protection – Completing review of vendor contract portfolio to comply with Schrems II – No personal data breaches with material impact to individuals observed GRI 3-3 Data protection is required by law and is also an important social value as clients, employees and other stakeholders expect that the personal data they entrusted to the bank is treated with the highest care. Deutsche Bank is therefore committed to protecting personal data, complying with the General Data Protection Regulation and similar laws, and meeting the related demands of clients, employees, business partners, and regulators. Governance GRI 2-13/23/24/25, 3-3 Group Data Privacy is a specialized, independent control function at Deutsche Bank for advising on and monitoring the collection, processing, and use of personal data by the bank’s business divisions and infrastructure functions. Group Data Privacy is supported by local Data Protection Officers in the countries where Deutsche Bank conducts business and the Chief Data Privacy Officer has a direct functional reporting line to the Management Board member responsible for the Chief Administrative Office. The bank’s data protection policies and procedures define data protection principles and compliance requirements in the organization, such as personal data breach reporting, access rights requests, consent and information requirements. Where legally required, privacy notices are directly provided to Deutsche Bank clients and employees by business divisions and infrastructure functions or made available on their respective public websites including the website *). These notices provide an overview of how specific privacy notices. Examples for the Corporate Bank can be found here ( Deutsche Bank processes personal data and the rights of individuals whose personal data is being processed, under data protection law. Based on Deutsche Bank’s Group-wide Non-Financial Risk Management framework, Group Data Privacy has established minimum control standards which the business divisions and infrastructure functions must adhere to. These include the permissibility review of new activities that involve processing of personal data in the bank, for example when processing personal data using artificial intelligence. Data privacy/protection controls are integrated in Group-wide governance processes like new product approval or vendor risk management as appropriate. In addition, Group Data Privacy closely collaborates with the Technology, Data and Innovation function and the Information Security function (Chief Security Office) to implement specific data protection principles, e.g., aiming to ensure the security of personal data via encryption of emails according to their classification or access rights controls. Details on information security can be found in the corresponding chapter of this report. In 2022, Group Data Privacy further strengthened the minimum control standards and worked together with the business divisions and infrastructure functions as part of a Group-wide initiative led by Non-Financial Risk Management to document and further improve the key controls that must be in place to mitigate data protection risk in the bank, e.g., to consult Group Data Privacy also for new internal processes and client products not in scope of Group-wide governance processes. Moreover, monitoring and testing the effectiveness of Deutsche Bank’s implementation of applicable data protection requirements was continued and no major deficiencies were identified. The results were considered by Group Data Privacy in the bank’s Group-wide annual risk and control assessment to review and challenge the business divisions’ and infrastructure functions’ own assessment of their data protection risk exposure and control effectiveness. Furthermore, Group Data Privacy also assesses emerging data protection laws and regulations on an ongoing basis and, if necessary, adjusts its policies and procedures as well as the minimum control standards. The same applies to technical developments and new digital business models. Training and awareness GRI 2-24, 3-3, 404-2, FS4 Employee training on the implications of data protection/privacy laws for the bank’s day-to-day business is a key factor in ensuring adequate data protection in all operating processes. Deutsche Bank requires mandatory data protection training for all employees including eligible contractor staff. This training encompasses the content of the data protection and privacy policy, the key requirements to ensure compliance with applicable legal rules for handling personal data and what steps must be taken in the event of a personal data breach. For Deutsche Bank employees, failure to complete this training and late completion can result in disciplinary consequences. The bank continually assesses its data protection training offering to strengthen data protection culture and updates the training as necessary. Within 2022, an eLearning completion rate of 99,96% was achieved for the mandatory data protection training. 91
Deutsche Bank Governance and operations Non-Financial Report 2022 Data protection New regulatory developments in data protection are continuously monitored and information is shared about them with the local Data Protection Officers to assess their relevance and potential consequences for the bank. If a need for adjustments to processes and products is identified, implementation actions are agreed with the business divisions and infrastructure functions. In addition, awareness of employees on data protection is fostered by internal online events and intranet posts. For example, in 2022 Group Data Privacy organized several regional webinars to raise more awareness on the importance of data protection and privacy, on handling of personal data, where to get support for data protection matters in the bank, what are individual’s rights, best practices for organizations to protect personal data, principles and trends in data protection and privacy and what can be the consequences of poor data protection practices. Key topics in 2022 Deutsche Bank ran a project to comply with the recommendations from the European Data Protection Board and the new EU Standard Contractual Clauses following the Schrems II ruling by the EU Court of Justice. This included the amendment of relevant existing contracts with vendors. Group Data Privacy also continued to assess new data protection legislation in the countries where Deutsche Bank does business. In 2022, the Thai Personal Data Protection Act entered into force and proposals for a Personal Data Protection Act in Sri Lanka and Indonesia were ratified by parliaments and will enter into force in 2023 respectively 2024. In addition, Group Data Privacy is closely monitoring the proposed amendment to the British Data Protection Act and the development of an EU-U.S. Data Privacy Framework. Where necessary, the bank is taking steps to ensure compliance. As part of the ongoing cloud transformation project with Google Cloud, Deutsche Bank implemented an application onboarding framework which includes specific data protection controls. No personal data breaches of material impact to individuals observed GRI 418-1 In 2022, Deutsche Bank again did not observe any personal data breaches of material impact to individuals. The bank’s reporting processes and pathways from the business divisions and infrastructure functions to Group Data Privacy aim to ensure that potential personal data breaches can be assessed and handled in a timely manner. They are described in a global data protection procedure. Should a personal data breach occur, Deutsche Bank as part of its global security incident management process takes coordinated follow-up actions. Group Data Privacy as a stakeholder in this process advises on the necessary regulatory actions and, if required, informs the affected individuals and notifies the relevant data protection authorities. 92
Deutsche Bank Governance and operations Non-Financial Report 2022 Product responsibility Product responsibility – Reinforcing Values and Beliefs through regular training – Evolving product responsibility policy, process, and governance – Collaborating across business and control functions in product reviews GRI 2-23/25, 3-3, 404-2, FS4 Deutsche Bank’s commitment to product responsibility is underpinned by its Code of Conduct (*), which is approved by the bank’s Chief Compliance Officer and applies to all employees and members of the bank’s Management Board. The Code is regularly reviewed and is updated as necessary in response to industry developments or incidents. Employees are required to attest to having read and understood the Code of Conduct on a regular basis. Furthermore, the bank has an extensive policy framework in place with accompanying governance designed to review and communicate policy requirements as required. Policies are widely available internally via a portal and in certain instances may be shared with other parties including vendors or made publicly available. It is when the bank delivers its products and services with integrity that trusting relationships with clients are developed and sustainable performance is achieved. In practice, this means the bank’s products and services are designed with input from various control functions, checking that the business have appropriately considered the intended target market and alignment with the bank’s objectives and values. Deutsche Bank seeks to adhere to relevant rules and regulations and endeavors to be fair, clear, and accurate when marketing its products and services. The bank has implemented checks and processes designed to screen potential and existing clients across multiple dimensions. The extent of screening varies by client, product risk profiles and jurisdictional requirements. The bank aims to minimize and/or appropriately mitigate any conflicts of interest the bank may encounter when providing products or services. The variable components of senior management’s compensation plans are carefully designed to establish appropriate incentives, particularly in relation to conduct and adherence to the bank’s values and beliefs. For more information, see the bank’s Compensation Report within the Annual Report 2022. Consequently, Deutsche Bank’s Compliance training program is tailored to address these important areas. Specifically, there are training modules on communicating with clients, identifying and managing conflicts, and checking products’ suitability and appropriateness. The module on the Code of Conduct includes topics related to product responsibility as well. Deutsche Bank believes it is vital for all employees to complete this training. Failure to do so can adversely affect employees’ compensation and their manager’s. Employees in the Investment Bank, Corporate Bank, and International Private Bank are required to complete an online training module named “The Essentials of our Duties to Customers” or, depending on the Employee’s client base, a similar module that addresses consumer protection. Employees of the aforementioned divisions must also take “The Essentials of Managing our Conflicts of Interest”. The in-scope employees complete these modules upon joining the bank and generally every two years thereafter. The latter module, which previously focused on business conflicts, was updated in recent years to include content on personal conflicts that was formerly part of a separate module; a new section on personal conflicts tailored to the needs of Infrastructure staff was added as well. If a client expresses dissatisfaction with a product or service, the bank has procedures in place to resolve the situation equitably, which may include, where relevant, notifying regulators through the provision of individual complaint details, aggregate complaint data or otherwise. The complaint process may vary by product type and jurisdiction, information can be found at db.com (*) or through a Deutsche Bank representative. Product design and advisory principles GRI 2-23, 3-3 Deutsche Bank’s New Product Approval and Systematic Product Review processes form a control framework designed to manage the risks associated with new products and services and their lifecycle management. These processes are overseen by Product Governance, within the Non-Financial Risk function. Existing products and services are reviewed in one- to three- year cycles designed to assess whether they remain fit for purpose and consistent with their respective target markets’ characteristics and objectives. Each product or service must be sponsored by a business Managing Director who bears ultimate accountability for it. Breaches of the New Product Approval requirements are in scope of the bank’s Red Flag program and as such may adversely affect employees’ compensation. 93
Deutsche Bank Governance and operations Non-Financial Report 2022 Product responsibility Product suitability and appropriateness FS1 Deutsche Bank’s Global Client Suitability and Appropriateness Policy outlines minimum standards that all divisions must meet, including implementing controls related to the performance of suitability and appropriateness assessments as relevant, the clarity of warnings and notifications provided to clients, and the effectiveness of such warnings. Further consideration is given to metrics, governance, and training. Suitability and appropriateness metrics relating to the underlying products and services are provided monthly to the Bank’s Non-Financial Risk Committee. They include trends on relevant customer complaints, New Product Approval breaches, and other metrics. The divisional Product Governance Policies support the bank’s efforts to offer products and services based on processes and principles designed to comply with legal and regulatory requirements. For example, they outline factors that may be considered for monitoring to determine whether products have only been sold to the appropriate client group. In accordance with regulatory requirements, the bank assesses where required various parameters, including a product’s complexity as well as clients’ product knowledge, experience, regulatory classification, and investment objectives. The bank may be subject to litigation in instances where clients believe they have been sold an unsuitable or inappropriate product or service and these grievances cannot otherwise be resolved. Any material matters would be disclosed in Note 27 “Provisions” of the Annual Report 2022. Selling practices and marketing GRI 2-23/25, 3-3, 417-1 Deutsche Bank is committed to marketing products and services responsibly and to providing information clients can trust. This not only supports clients’ interests but promotes market efficiency by providing all market participants with the opportunity to act on information that is neither false nor misleading. Accordingly, the bank’s Business Communications Policy requires all communications, independent of format, medium, or audience, to meet certain minimum standards and requirements for content in addition to being fair, clear, and accurate. For example, any mention of the prospective profit or advantages of a transaction must be balanced by reference to relevant risk factors. Deutsche Bank’s business divisions and units have varied and nuanced controls that reflect products and services it offers. For example, the Origination & Advisory business periodically compares a sample of its pitchbooks against a predefined checklist to verify products and services have been presented fairly and clearly and include appropriate disclosures and disclaimers. The output of such controls, such as the number of exceptions, are included in materials discussed in senior governance fora in order identify any negative trends and, if necessary, propose remediation steps. Furthermore, the business conducts regular risk assessments in addition to Compliance’s annual assessment that considers the appropriateness of the control environment across the divisions. These assessments consider numerous factors including client base, product availability, business volumes, regulatory requirements, past incidents, and issues identified, that is, no single factor such as associated revenue determines the extent of controls. At Private Bank Germany, each loan application includes an analysis of the clients’ situation in order to protect the clients, mainly retail clients, from over-indebtedness. The bank’s loan processes, and staff training reflect this commitment. The bank takes a variety of steps to mitigate hardship in conjunction with nonperforming loans. The bank notifies clients early if they fail to repay loans or repay late. In addition, the bank’s products aim to benefit individual clients while not harming society at large. This rules out, for example, advisory of mutual funds that involve the manufacturing or sale of nuclear weapons, cluster munitions, and landmines, promote or use child labor, violate human rights, or support drug trafficking or money laundering. Conflicts of interest GRI 2-15 The potential for a conflict of interest occurring, including between the bank and its clients, between employees and clients, or between one or more clients in the course of provision of services by the bank, is present daily and an inherent part of the bank’s activities. Deutsche Bank’s Conflicts of Interest Policy (*) outlines the types of conflicts that may arise and requires all employees to identify, report, and manage them appropriately. Conflicts of interest can arise in conjunction with the services and activities carried out on behalf of the bank’s clients; its own corporate activities; and its employees’ activities, whether through trading for their own accounts, their outside business interests, or their family and close personal relationships. Some conflicts of interest are not permitted as a matter of law or regulation and others are permitted so long as the bank has appropriate means by which to manage them. 94
Deutsche Bank Governance and operations Non-Financial Report 2022 Product responsibility Each business division must have measures in place to identify and manage conflicts appropriately, including a Conflicts of Interest Register, which lists conflicts of interest that have arisen or may arise within the division. The maintenance of this register falls within the remit of an oversight body consisting of senior representatives of the division’s management who receive input from Compliance. Beyond the business divisions, the bank has numerous control functions that directly or indirectly manage conflicts of interest. For example, the Business Selection and Conflicts Office is responsible primarily for managing transaction-related conflicts and reports to the Management Board at least once a year. In addition, the bank’s Employee Compliance program is designed to check whether employees’ personal transactions are conducted in line with regulatory requirements and are not harmful to clients or the market. Further, the bank’s Compliance Control Room team support the management of conflicts by recording the flow of inside information and insiders. 95
Deutsche Bank Governance and operations Non-Financial Report 2022 Client satisfaction Client satisfaction – Client centricity is one of the bank’s core values – Client satisfaction remained largely stable in 2022 GRI 2-23/24/29 Client centricity is one of the six core values articulated in Deutsche Bank’s Code of Conduct and a focus area of its management agenda. Satisfied and loyal clients are vital for sustainable growth and the bank’s ongoing success. That is why gathering client feedback systematically is an important aspect of Deutsche Bank’s client centricity strategy, which is central to its transformation initiatives. Deutsche Bank strives continually to orientate its actions toward clients’ needs and expectations while ensuring that it complies with laws and regulations relating to the provision of financial products and services. As of December 31, 2022, the bank was organized into four business divisions: Corporate Bank, Investment Bank, Private Bank, and Asset Management. In addition, the bank has a country and regional organizational layer. Each of the bank’s business divisions assesses client satisfaction in ways that make sense for its specific client groups. Deutsche Bank draws on client feedback to conduct quality assurance and, if necessary, to design improvement programs. Aggregated feedback on the main trends, insights gained, and corrective actions is communicated to senior management and other relevant stakeholders inside the bank. Client satisfaction in 2022 was largely unchanged from 2021. Deutsche Bank attributes this success in part to its swift, client- centric response. Corporate Bank actively monitors clients’ satisfaction with its services to gain a client-specific understanding of where potential improvements exist. Over 843 day-to-day clients of Deutsche Bank’s Corporate Cash Management unit provided feedback in 2022 based on their experiences with customer service, technology, and operations. Corporate Bank used the feedback from service recipients to create client-specific action plans, initiate product developments and understand evolving client expectations in the end-to-end client journey. In 2022, 90 % of Deutsche Bank’s Corporate Cash Management clients stated they were mainly or fully satisfied with how Corporate Bank dealt with their feedback, compared to 91 % in 2021. Investment Bank (IB) tracks wallet share and client satisfaction through broker reviews but also external benchmark providers such as Coalition Greenwich. The feedback is used to regularly review and reassess client strategies. Private Bank serves a variety of customer groups. In Germany, the bank targets private retail customers with two complementary brands – Deutsche Bank and Postbank. Internationally it focuses on wealthy individuals, entrepreneurs and family associations, as well as small and medium-sized enterprises in selected European countries. Customer satisfaction is foremost measured on the basis of the Net Promoter Score (NPS), an internationally recognized metric. The NPS measures the willingness of customers to recommend a company and the reasons for doing so. It is considered as an essential indicator of loyalty and satisfaction. This customer-centric approach increases transparency, both internally and externally. At Private Bank Germany, a variety of methods is used to survey the NPS: On the one hand, customers are surveyed immediately after an interaction with a branch, after using selected online service or product completion routes or after an interaction with the call center. On the other hand, these surveys are supplemented by regular panel surveys of customers and non-customers to create an overall picture. In 2022, the NPS was measured across the board in all 400 branches of the Deutsche Bank brand, in all seven regional advisory centers, in the call center as well as in digital channels for products that can be purchased online. For the Postbank brand, more than 200 out of a total of 650 branches were connected. Here, the nationwide implementation is aimed to be finished in 2023. Initial results show that customers interacting with a branch or on multiple channels recommend the bank more likely than customers who rely exclusively on online and mobile banking. A survey of customer by age conducted in third quarter of 2022 showed that the NPS of customers aged 45 and above was slightly higher than of customers under 45. Across all distribution channels and client’s segments, the NPS at Private Bank Germany was 65 after a contact with Deutsche Bank brand. In 2022, more than 123,000 clients gave their feedback: 75% of the clients surveyed could be considered as so-called “promoters” who rated their willingness to recommend Deutsche Bank with nine or ten on a scale of zero to ten, 15% as “passive” who rate their readiness to recommend with a score of seven or eight and 10% were considered as “detractors” (with a score of 0-6). For Postbank brand, the first values are planned to be reported after the further rollout of NPS in 2023. 96
Deutsche Bank Governance and operations Non-Financial Report 2022 Client satisfaction In addition to the German retail and private banking businesses, International Private Bank (IPB) brings together globally connected Wealth Management clients across Germany, Europe, Americas, Asia and the Middle East and Africa, along with private clients and small and medium-sized enterprises in Italy, Spain, Belgium and India and therefore different approaches to measure client satisfaction continue to apply. In the second quarter 2022, International Private Bank adjusted reported client segments to “Premium Banking” (previously Personal Banking) and “Wealth Management & Bank for Entrepreneurs” (previously “Private Banking and Wealth Management”). Wealth Management & Bank for Entrepreneurs combines the coverage of private banking, high-net-worth and ultra-high-net-worth clients, as well as business clients that are covered as part of the Bank for Entrepreneurs proposition. International Private Bank Premium Banking includes retail and affluent customers as well as commercial banking clients (i.e., all small business clients and small sized corporate clients that are not covered as part of the Bank for Entrepreneurs). International Private Bank uses both Net Promoter Score (NPS) and client satisfaction (CSAT) index metrics. In International Private Bank markets primarily focused on Wealth Management & Bank for Entrepreneurs, only Net Promoter Score is used. Alongside Net Promoter Score, International Private Bank also compiles a client satisfaction (CSAT) index in Spain and Italy, focused primarily on Premium Banking clients. This broader index measures clients’ overall satisfaction with Deutsche Bank, including all the items that affect their relationship with the Bank. As per previous years, the client satisfaction (CSAT) index and Net Promoter Scores were weighted based on the revenue contribution from the respective areas of the business, as opposed to the number of respondents to the survey, making it more representative of the business mix. Prior to 2022, within Wealth Management & Bank for Entrepreneurs, only Wealth Management Germany used the Net Promoter Score methodology. In 2022, Net Promoter Score methodology was rolled out across additional Wealth Management & Bank for Entrepreneurs markets to gain a global perspective. Therefore in 2022, Wealth Management & Bank for Entrepreneurs clients within the six International Private Bank reporting regions (Americas, APAC, EMEA, Germany, Italy and Spain) were sent online surveys to ascertain Net Promoter Score performance, rendering prior years data incomparable. Results show approximately 60% of clients globally are "promoters" of the brand with an overall Net Promoter Score of 44.5 (without regional revenue weighting applied). Client satisfaction as well as service quality for International Private Bank is represented as follows in 2022. The figures for International Private Bank include figures for the six reporting regions for International Private Bank which use region or country-specific survey methods with different scales and different business segmentation. Client satisfaction for International Private Bank Dec 31, 2022 Dec 31, 2021 Dec 31, 2020 Client satisfaction International Private Bank CSAT Index International Private Bank1 73.4 73.6 73.9 NPS International Private Bank - Wealth Management and Bank for Entrepreneurs2 32.7 N/A N/A 3 NPS International Private Bank - excluding Wealth Management and Bank for Entrepreneurs 8.2 10.7 9.5 4 Number of clients taking part in the survey 24,156 26,392 19,765 1 Client satisfaction (CSAT) Index is recorded and reported for International Private Bank (IPB) Italy and Spain only, IPB’s largest Premium Banking markets. The result is the average rate given by clients on a 0 - 100 scale weighted by revenue contribution. The combined figures shown are based on the revenue contribution in each country. Therefore, in 2022 Italy represented 69% and Spain 31%; in 2021, Italy represented 68% and Spain 32% of weighting and in 2020 Italy represented 67% and Spain 33%. 2 The global Net Promoter Score (NPS) for Wealth Management and Bank for Entrepreneurs has been calculated by using regional NPS scores, which have been adjusted to reflect regional-weighted revenue contribution across the six Wealth Management and Bank for Entrepreneurs regions. Due to Italy’s business mix, Wealth Management and Private Banking is reflected for Italy in this calculation. 3 Net Promoter Score (NPS) is shown for International Private Bank (IPB) Italy and Spain only (excluding Wealth Management and Bank for Entrepreneurs) reflected by revenue contribution which is 69% for Italy and 31% for Spain in 2022. In 2020 & 2021, NPS reporting for International Private Bank excluded Wealth Management. This metric is reported here again in 2022, however in line with new client segmentation, this now reflects the Premium Banking segment, which excludes Consumer Finance. 4 In 2022, Net Promoter Score (NPS) surveys for the Wealth Management and Bank for Entrepreneurs segment were primarily conducted by online methodologies. In 2020, the client satisfaction (CSAT) scores and findings in Italy were primarily based on telephone interviews. In 2021, the process for Italy was amended to broaden the calculation base and also include online respondents. In 2022, Italy and Spain used both telephone and online survey methodologies. In addition, International Private Bank used mystery shopper interactions to check that its advisory processes meet its clients’ needs. In 2022, 432 test purchases were undertaken (2021: 333 test purchases). In 2022, International Private Bank Premium Banking conducted test purchases in Spain and Italy only, while International Private Bank Premium Banking’s other countries (Belgium and India) did not participate in the mystery shopping program. In Spain, an independent market study using mystery shopping identified Deutsche Bank Spain as the best bank for service quality in 2022 (Source: Stigacx.com EQUOS study 2022). Mystery Shopping index for International Private Bank (Premium Banking) Dec 31, 2022 Dec 31, 2021 Dec 31, 2020 International Private Bank1 Mystery Shopping Index 81.5 84.2 86.2 1 The index figures for 2020 contain test purchases from Spain only. The figures for IPB are based on country-specific survey methods with different scales. The results have been converted to a uniform scale of 0 – 100%. 97
Deutsche Bank Governance and operations Non-Financial Report 2022 Client satisfaction DWS, the bank’s asset manager, conducts annual client satisfaction surveys for its clients. The topics of one of the surveys in DWS’ home market include for example friendliness of staff, professional competence, comprehensibility and solution orientation as well as sales-specific questions. For this survey, the overall participation increased to 9.6% from 9.2% compared to 2021. Other surveys are for example conducted in the US for insurance clients. This survey continues to show a consistently positive overall satisfaction rating of above 90% over the last five years. In 2022 DWS also introduced a new customer satisfaction survey for DWS top 50 global clients, including strategic partners. The so-called Net Promoter Score indicates how likely DWS is to be recommended to a business partner. DWS achieved a score of 50, compared to an average of 28 in the investment firm industry. DWS’ plan is to expand the Net Promoter Score survey to their entire customer base to continuously monitor and improve customer satisfaction. Complaint management GRI 2-25/26/29, 404-2 Deutsche Bank has established global processes for dealing with customer complaints. They are delineated in the global Minimum Requirements for Handling and Recording of Complaints policy and detailed in the Governance Procedure for Handling of Customer Complaints. Further policies and procedures at country and/or divisional level supplement the global standards as required. The global policy and procedure comply with the “Guidelines for complaints-handling for the securities (European Securities and Markets Authority) and banking (European Banking Authority) sectors,” as jointly issued by the Europeans Securities and Markets Authority (ESMA) and the European Banking Authority (EBA) and with their interpretation by the German Federal Financial Supervisory Authority (Bundesanstalt für Finanzdienstleistungsaufsicht, BaFin). Their objectives are to set global minimum standards for handling complaints and to ensure that all locations, branches, and subsidiaries handle and resolve complaints impartially and without undue delay. It applies to all business divisions and supporting infrastructure functions (together Units). All Units are responsible for implementing the global policy and the global procedure respectively. As a matter of principle, Deutsche Bank strives to prevent complaints from arising. The bank does this by aspiring to address challenges before they arise. If this is not possible, the bank seeks to contact complainants (clients and non-clients) and reach a solution at the first contact. Complainants can address their complaints in any local branch, by email, online, or phone, and through authorized third parties. Deutsche Bank strives to confirm receipt of complaints as soon as possible and to work on resolving them quickly and transparently. Furthermore, the bank continuously monitors complaints to detect emerging trends and to identify the root causes. Additionally, Deutsche Bank screens its complaints for reoccurring issues. Respective metrics are included in reports to the Senior Management including the Management Board and are also shared with the Compliance function. Among others, the number of complaints, their root causes, risk type (clustered by the Bank’s group-wide non- financial risk type taxonomy), the non-financial impact category, and time to closure are reported through the bank’s management information systems. Complaints that pose a particularly high risk of causing significant harm to Deutsche Bank or its customers are being escalated promptly to relevant functions to commence further investigations where necessary. In 2022, Corporate Bank's oversight and management of its complaint’s governance framework (via the Complaints Oversight Forum) has transitioned into an integrated global program. Corporate Bank continued to enhance the program through additional risk-mitigating activities conducted in 2021, including integration of feedback from previous Controls Testing reviews, to further strengthen the framework. There has also been an improvement in the Controls Testing reviews conducted in 2022, validating the design and operating effectiveness of the Complaints Handling Framework within Corporate Bank. There continues to be a concentration of complaints for Corporate Bank received by Business Banking in Germany. The top root cause categories of complaints across Corporate Bank are: Operational issues; Client communications; and Application issues. Investment Bank likewise continued its efforts to improve complaint management and took steps to further improve control and governance. Complaints are reviewed by business and Compliance each month and checklists are utilized by the Divisional Control Office to ensure that complaint logs are complete and accurate. Recent focus has been on escalation to relevant 2LoD to ensure complaints are resolved with input from all stakeholders and in particular anything relating to alleged misconduct is properly investigated and escalated in accordance with the Bank’s regulatory reporting obligations. In 2022 the most common root cause of complaints continues to be operational issues, but complaints have also been recorded relating to pricing or trade execution issues, and a handful in relation to alleged misconduct in Fixed Income and Currencies (none of which were upheld). Private Bank does business in several countries and offers a wide range of products and services to heterogenous client segments. This makes its complaint management correspondingly complex. Nevertheless, Private Bank has established reliable and effective complaint management with sub-divisional processes, enabling it to address in compliance with the laws and regulations of the countries in which the division operates. 98
Deutsche Bank Governance and operations Non-Financial Report 2022 Client satisfaction Private Bank Germany conducts an integrated complaint management for its Deutsche Bank and Postbank brands focusing on client-oriented solutions and regular analytic reporting to both management and sales channels. This information is considered in other processes like Product Lifecycle Reviews to continuously improve the quality of customer experience, product portfolio, and advisory. Complaints are recorded in a digital register and forwarded to the responsible department which analyses and processes the facts carefully and answers the customer. As a general rule, the complainant receives a final reply within three weeks of receipt of the complaint. The number of complaints in 2022 was at the level of the previous year. There was an increased number of complaints related to closures of savings products. On the other hand, customer reactions with regards to the topics “Updating business partner data” and “Estate regulations” declined significantly. Private Bank Germany participates in applicable dispute-resolution schemes run by national ombudsmen. These schemes offer a free service to clients who prefer not to dispute directly with the bank. Alternatively, clients can also contact the respective division in supervisory authority BaFin. Client complaints at International Private Bank decreased by 14% in 2022 compared to 2021. Italy experienced a decrease of 27% driven primarily by lower number of complaints related to process improvements and client communication topics, while Belgium experienced a drop of 23% mostly driven by a decrease in the number of complaints related to product pricing topics and process improvements. In 2022, International Private Bank registered less than 1% of complaints related to breaches of client privacy from third parties (substantiated), none of which were of systemic relevance. The Global Product Risk & Oversight Governance Forum conducts quarterly reviews of the output of product life cycle analysis and management processes for International Private Bank globally. In particular, the Global Product Risk & Oversight Governance Forum reviews product-related client complaints relating to capital markets products (incl. illiquid funds). In 2022 the International Private Bank worked on the expansion of the governance framework, to incorporate product-related complaints. For DWS, the volume of client complaints trended slightly down. A significant number of client complaints in previous years was in relation to DWS´s Digital Investment Platform. DWS agreed with BlackFin Capital Partners on a long-term strategic partnership to jointly evolve the Digital Investment Platform by transferring the business into a new company, MorgenFund GmbH, in which DWS maintains a minority stake of 30%. The transaction was completed in November 2022. DWS will not report client complaints raised against MorgenFund GmbH. DWS received a number of protest emails and letters in November 2022 as a result of a concerted action by an NGO which were also dealt with by the client complaint department. 99
Technology, data and innovation 102 Digitization and innovation 105 Information security
Deutsche Bank Non-Financial Report 2022 Technology, data and innovation at a glance Drivers of technology, data and innovation Digital COVID-19 Arti昀椀cial Fin Tighter Natives Pandemic Intelligence Techs Regulation Facts and 昀椀gures 2022 Deutsche Bank announced the opening of its next Technology Center in Berlin, Germany. The center will primarily support the ambition of the Investment Bank and the Corporate Bank through application development and the integration of new technologies. Security remains a signi昀椀cant topic. Therefore Deutsche Bank continually adapts its security controls based on an evolving threat landscape to protect the con昀椀dentiality, integrity, and availability of its clients' and business partners' data and its own information assets. Over 1,350 Over 1,400 176 participants in a hackathon across engineers graduated DB Cloud sessions held as part of monthly 18 locations worldwide to create Engineer learning program Engineering Days innovative apps for a good cause New York Berlin London Palo Alto Deutsche Bank’s global Singapore innovation network with o昀케ces around the world 101
Deutsche Bank Technology, data and innovation Non-Financial Report 2022 Digitization and innovation Digitization and innovation – Opening of a new technology center in Berlin – Innovation partnership with NVIDIA announced – Corporate Venture Capital group made further startup investments GRI 2-28 Technology continues to shape clients’ expectations and thus drives disruption in the banking sector. For example, post- millennial clients, who are digital natives, expect banks’ products and pricing models to be more transparent. In addition, digital trends like artificial intelligence are challenging the viability of banks’ business models, while fintech and other new competitors enter the financial services sector. Simultaneously, financial regulation is becoming tighter. These factors have forced banking sector incumbents to rethink their business models and strategies. However, disruption is also an opportunity. New, enabling technologies can provide the basis for innovative products and services that make business activities simpler, more agile, and more efficient. In 2022, the bank continued its engagement with political stakeholders in Berlin and Brussels with a focus on cloud, data and resilience, as well as crypto assets. Among others, Deutsche Bank participated in panel discussions on artificial intelligence, the digital euro and the transition to a sustainable economy. The events helped raise awareness of potential obstacles that regulation may create for innovation and resilience as well as highlighted opportunities of innovative technologies. The bank’s membership in a number of trade associations, such as the Association for Financial Markets in Europe, the European Banking Federation, the Association of German Banks (Bundesverband deutscher Banken – BdB) and the European Financial Services Roundtable, has enabled the bank to play an active role in public discussions that help facilitate consensus on policy issues in the financial industry. Governance GRI 2-13/23/24/25, 3-3 Deutsche Bank has a Technology, Data and Innovation function, headed by the Chief Technology, Data, and Innovation Officer, who is also a member of the Management Board. The function’s purpose is to ensure that the bank’s IT, data, and security agenda is integrated and consistent across all of the organizations’ operational activities, functions, and divisions. It also defines the policies and operational standards on how technology is used in the bank. The Supervisory Board has a dedicated Technology, Data and Innovation Committee (*) that discusses the progress of the bank’s key technology transformation programs on a regular basis and oversees the Management Board work. The bank’s digitization vision is to transform its core businesses by adopting fully digitized, end-to-end banking processes. The aim is to create a digital ecosystem that enables the bank to reach new clients through innovative business models and to increase revenues through platforms that offer the best possible products, including those from third parties. The goal is to draw on the bank’s storehouse of data to generate insights that serve clients and their needs. The bank remains focused on delivering key aspects of its technology strategy, adopted in 2019, aimed at fundamentally changing the way it develops technological solutions. This includes bringing together businesses and technology experts in agile teams, strengthening internal engineering expertise and fostering a new engineering culture by increasing the proportion of engineers in IT roles. In addition, the bank continues to simplify its processes and make them more flexible by modernizing IT infrastructure and adopting cloud solutions where feasible and sensible. In 2022, enterprise architecture principles that provide an objective means of assessing the alignment of the bank’s change programs with strategic intentions continued to be measured with enhanced process key deliverables. The principles cover aspects including data, reuse of components, automation, and security. The bank’s portfolio of change projects is rigorously and consistently evaluated against them, with deviations challenged to ensure progress toward a simpler, more efficient target state architecture. In support of Deutsche Bank’s sustainability strategy, a dedicated Sustainability Data & Technology Program was established in early 2022. It is focused on sourcing and managing sustainability data and integrating it into the technology systems which serve the bank’s business processes. This is aimed at enabling the bank to advise clients on their net zero journey, support the bank’s risk management, as well as allow the assessment of supply chains against the bank’s sustainability goals. In 2022 Deutsche Bank built the capability to capture and manage sustainability data and then use it to support financial reporting for the bank's sustainable finance business. 102
Deutsche Bank Technology, data and innovation Non-Financial Report 2022 Digitization and innovation Within the scope of the strategic partnership formed with Google Cloud in late 2020 (*), the bank focused on migrating applications to the cloud with now over 200 applications running in the cloud across production, development and testing. In parallel new services have been built using Google Cloud including a cash flow management and invoicing solution for corporate clients, as well as a new online banking platform which is planned to first go live for Postbank clients. In June 2022 (*) Deutsche Bank announced the opening of its next Technology Centre in Berlin, Germany. The center primarily supports the ambitions of the Investment Bank and the Corporate Bank through application development and the integration of new technologies. In general, the Deutsche Bank Technology Centers deliver application development and support to the bank’s businesses and infrastructure functions and currently operate in the USA, Europe and Asia. In December 2022 (*) the bank announced a multi-year innovation partnership with the technology company NVIDIA, known as provider of artificial intelligence hard- and software, to accelerate the use of artificial intelligence and machine learning in the financial services sector. The partnership aims to enrich the bank’s leadership in risk management, improve efficiency and enhance customer service by leveraging a broad range of applications, including intelligent avatars, speech artificial intelligence, and fraud detection. Training and awareness GRI 3-3, 404-2, FS14 The bank continued to strengthen its internal engineering expertise and achieved its objective to have more than 50 % of the Technology, Data and Innovation staff working as engineers by end of 2022, as announced at the 2020 Investor Day (*). The bank is committed to ensuring that it has the right skills and capabilities to become a truly digital organization. One priority is to attract, develop, and retain world-class engineering talent and to provide an environment and toolset to support them. These include: – The Engineering Career Development Framework lays out the capabilities and behaviors needed at each stage of an engineering career path, updated for 2022 to support the User-Experience and Quality Assurance engineering communities – A thriving engineering community to support the ongoing design and curation of learning curriculums – Monthly Engineering Days dedicated to increasing the bank’s engineering capabilities, enhancing skills and knowledge, and bringing people together across organizational and geographical boundaries; in 2022, the bank held a total of 176 Engineering Day sessions in coding, learning, culture, and development, attracting 10,639 registrations – Since Engineering Day’s launch in mid-2020, a total of 973 sessions have attracted more than 61,274 registrations – The technical career fast- track promotion process recognizes the bank’s junior engineering talent and allowing them to progress at an accelerated pace – DB Cloud Engineer is a structured learning program to upskill the bank’s engineering workforce at scale and in-depth. Over 1,400 engineers across Deutsche Bank successfully graduated so far, with more learning sprints under way and planned for 2023; additionally, to deepen cloud expertise, professional learning sprints were launched in 2022; DB Cloud Data Engineer, DB DevOps Engineer, DB Cloud Architect delivered the first graduating cohorts recently As part of the bank’s overall gender diversity strategy, a Global Technical Accelerator program, now in its fourth year, offers female employees in TDI the opportunity to start or revisit a career in software engineering. The intense twelve-week program teaches basic programming skills and provides a foundation in good technical practices. The participants then join high performing application teams where their learning journey continues, with 47 female participants to date. Deutsche Bank works systematically to cultivate a technology-led work environment that encourages employees to help propel the bank’s digital transformation. This includes the organization of talks and discussions on the latest technology trends, such as artificial intelligence and quantum computing, enabling employees to hear how the bank and outside experts are shaping the latest technology trends. Each year Deutsche Bank hosts a Global 24-Hour Hackathon where employees come together to create innovative new applications and solutions for a good cause. As part of the bank’s drive to attract young talent, teams are also joined by (*). In 2022, the theme of the hackathon was sponsored students such as the Arkwright Engineering Scholarship Trust ‘Transforming Mental Health’ in support of Deutsche Bank’s Charity of the Year – MQ Mental Health Research (MQ). Over 1,350 employees took part across 18 locations – including one team working in the Metaverse – with the challenge to create a well-designed prototype App for Learning Effective New Strategies (LENS), a theory-driven, evidenced-based, accessible, digital therapy that was developed at King’s College London with funding from MQ. Innovation approach The leitmotif of the bank’s digitization is customer-focused innovation. Deutsche Bank wants to focus on its core strength and innovate in its core business in areas where customers expect new solutions and where the bank can reach an advantageous position in the marketplace. 103
Deutsche Bank Technology, data and innovation Non-Financial Report 2022 Digitization and innovation The bank has a global innovation network with offices in Berlin, London, New York, Palo Alto, and Singapore, which continuously scout, identify, and evaluate the solutions provided by startups and technology companies and match them with the requirements of the business divisions and infrastructure functions. The process usually starts with a specific question from a business or infrastructure function for which the innovation network finds suitable innovative solutions from startups or, when appropriate, decides to invest in in-house development. This ensures upfront sponsorship and facilitates alignment with Deutsche Bank’s business strategy. Deutsche Bank strongly believes that banks and startups can bring their comparative advantages together. For example, collaboration with Fintechs and startups is integral to the development of many of Deutsche Bank’s online and mobile banking features for private clients in Germany, such as the integration of third-party bank accounts and Deutsche Bank’s deposit market platform. The bank also invests selectively in startups. The focus is on strategic corporate venture capital investments in companies that use technology to support or enable banking and financial services. In addition to investments that support its business, the bank invests in enterprise technology solutions. As part of its Corporate Venture Capital (CVC) group (*) in 2022 Deutsche Bank invested into Synthesized (*), a leading data generation platform provider, as well as into SkyHive (*), a cloud-based workforce management and reskilling software provider. Open innovation The bank continues to proactively engage with open-source software, partly driven through its membership with the Fintech Open Source Foundation (FINOS). By hosting projects including Plexus Interop, which defines open standards for desktop (*) application interoperability, Waltz, the bank’s architecture information service, as well as Springbot, a Symphony-based platform for the development of chat bots and applications on FINOS increases external reach, enables larger numbers of developers to engage and further contributes to these solutions. Deutsche Bank’s contribution to Maven, one of the most widely used build automation platforms for Java projects that is among the most popular programming languages, continues to exhibit benefits for the firm. The more recent contribution in September significantly reduces developer time to publish jobs, now taking 1-15 minutes instead of 30-40 minutes. Other developments in 2022 FS14 In May (*), Deutsche Bank announced its partnership with FinLync, a global fintech company offering products that are transforming corporate finance and treasury offices. The partnership accelerates the adoption of real-time treasury among corporates, reducing IT efforts and time spent for treasurers connecting to Deutsche Bank APIs. In July (*), Deutsche Bank announced to develop its own BNPL (buy now, pay later) solution for invoice and instalment purchases in collaboration with Vienna-based fintech Credi2. The white-label – own brand – solution for online merchants and e-commerce marketplaces in Germany can be flexibly integrated into the payment process. Deutsche Bank and Visa are entering into a new collaboration to help prevent online retail fraud, as announced in September (*). Merchants who process their e-commerce payments via Deutsche Bank can now use “Decision Manager”, an automated fraud detection system from Visa-owned company CyberSource. The solution works like a risk management system and calculates a risk value for each individual transaction using artificial intelligence and specified rules. In October (*), the bank introduced a new accessibility tool which allows Deutsche Bank website users with visual disabilities to adapt the website content according to their visual needs. The tool also works on mobile web browsers and is currently available in 26 languages. 104
Deutsche Bank Technology, data and innovation Non-Financial Report 2022 Information security Information security – Preserving the confidentiality, integrity, and availability of information assets – Continually adapting security controls based on an evolving threat landscape GRI 3-3 Clients expect access to their bank’s services anytime, anywhere, and through a variety of channels. Deutsche Bank operates in an environment with increasing levels of digitization and a continually evolving threat landscape related to information security. Cyber-attacks could lead to technology failures, security breaches, unauthorized access, loss, destruction of data, unavailability of services, and the inaccessibility of systems and/or data. Amid these threats and challenges, Deutsche Bank has the responsibility to preserve the confidentiality, integrity, and availability of clients’ and business partners’ data and its own information assets. Doing so consistently and effectively is essential for retaining stakeholders’ trust. Consequently, information security remains a significant topic and therefore the bank continues to invest in risk mitigation. In 2022, Deutsche Bank again adapted its security capabilities to keep pace with evolving threats. The bank’s group-wide security strategy articulates the steps it takes to safeguard its ability to provide products and services to clients, thereby ensuring revenue streams. Security strategy, framework, and governance GRI 2-12/13/23/24/25, 3-3 Responsible for security matters at Deutsche Bank is the Chief Security Officer. The Chief Security Officer has delegated authority from the Management Board and reports directly to the Chief Technology, Data, and Innovation Officer, who is a member of the Management Board. The Management Board receives a comprehensive quarterly information security risk posture report as well as ad hoc information if required. Furthermore, the Chief Security Officer provides the Supervisory Board’s Committee responsible for Technology, Data and Innovation with regular updates on material topics relating to security. The Chief Security Office develops the bank’s group-wide security strategy and oversees its implementation and operationalization globally. This strategy is reviewed continually to address changes in the threat landscape, technology, the regulatory environment, the bank’s corporate and IT strategy, and other internal and external parameters. Deutsche Bank’s strategy framework provides comprehensive and layered security controls. This framework is strengthened by a threat-driven approach to direct and adjust the security investment, including the continual review and assessment of the maturity of the bank’s security implementation. The Chief Security Officer is supported by information security role holders at various seniority levels to ensure that security requirements are met both at a regional level as well as from a divisional and technical perspective. All information security activities are overseen by governance forums chaired by the Chief Security Officer. The fora include the Group IT Security Council (for the bank’s IT functions) and the Group Information Security Committee (for the bank’s business divisions) that reviews and endorses the bank´s information security policies and procedures. Security policies and their implementation are guided by international standards and best practices. The bank’s Information Security Management System has been certified and recertified to ISO 27001 in all information security domains since 2012 and was again successfully recertified in 2021, including a yearly certification-follow-up in 2022, which ensures compliance between the certification terms. Deutsche Bank has a well-established global regulatory engagement model to understand, identify and implement controls related to applicable regulatory change, as necessary. The effectiveness of the overall approach to information security is evaluated on a regular basis by third-party organizations that compare the bank’s approach with industry benchmarks. In addition, the independent Group Audit function frequently includes the assessment of security controls in its audit plan. 105
Deutsche Bank Technology, data and innovation Non-Financial Report 2022 Information security Security measures Layered security controls GRI 3-3 To fend off evolving security threats, the bank aims to build information security controls into every layer of technology, including identity, data, infrastructure, devices and applications, complemented by organizational controls and security training and awareness. The purpose of this layered approach is to provide end-to-end protection as well as multiple opportunities to detect, prevent, respond to, and recover from cyber threats. Deutsche Bank has in place a variety of prevention methods and controls, such as threat intelligence, data leakage prevention, cyber hygiene, or encryption solutions. This also includes placing a strong emphasis on detection, backed by a robust incident- response process. Over the course of 2022, Deutsche Bank further matured its integrated security function across information and physical security. As an example, the established threat intelligence function expanded to cover a broader spectrum of the cyber and physical security threat landscape through enhanced threat analysis capabilities and the utilization of additional threat intelligence feeds. The bank also established a Responsible Disclosure process through which it encourages the active sharing of suspected security vulnerabilities with the bank’s security teams. The bank actively shares best practices and threat information with national and international security organizations, government authorities, and peer organizations. These relationships help ensure that the bank’s security technology and procedures reflect current industry best practices and keep pace with the threat environment. Deutsche Bank’s security incident management covers cyber-security events that may affect itself, its clients and business partners, or employees. The related management and reporting processes are designed to be enabled to respond quickly and effectively to cyber-attacks or information security threats, to minimize loss, leakage, or disruption, and to use insights gained from the handling of incidents to continuously improve the bank’s processes. The bank’s Cyber Intelligence and Response Centers in Asia-Pacific, Europe, and the United States provide global 24/7 monitoring, which enhances its ability to detect threats and respond to incidents worldwide. In 2022, there were no material negative impacts to the bank’s systems, information assets, or client information as a result of an attempted cyber-attack or other information security incident. Fostering a security culture GRI 2-23, 3-3, 404-2, FS4 A key element of the bank’s security strategy is to foster and maintain a bank-wide security culture characterized by strong collaboration across divisions and functions and an active awareness among its employees of their important role as a human firewall. This is reinforced by conducting “Time to be aware – you are security,” a security awareness campaign communicated to all employees worldwide. It consists of basic security practices and useful tips for typical work situations both at the office and on the go, complemented by detailed and continually updated information about key issues. Another way the bank reinforces security awareness is by periodically conducting simulated phishing attacks. The dynamics of the cyber threat environment make ongoing personnel training essential. Deutsche Bank requires mandatory information security training for all employees including eligible contractor staff. This training encompasses the content of the information security policy, important and current security threats as well as the process to report security incidents or any other security-related concerns. For Deutsche Bank employees, failure to complete this training and late completion can result in disciplinary consequences. Deutsche Bank continually assesses its information security training offering to strengthen security culture and updates the trainings as necessary. Within 2022, a learning completion rate of 99,98 % was achieved for the e-Learning-based mandatory information security training. Third-party security risk management GRI 3-3 Reliance on third parties’ products and services that support critical operations can affect the bank’s risk posture, because it can be the target of new and evolving information security attacks. This risk, along with increased regulatory requirements, has necessitated detailed oversight and continuous monitoring of third-party security as well as the continued maturing of the bank’s technology driven third party security capabilities. Deutsche Bank manages information security third-party risk by means of its global third-party risk management program, which includes requisite obligations of information security controls, as applicable. 106
Employees and corporate social responsibility 109 Employment and employability 120 Corporate social responsibility 124 Art, culture and sports
Deutsche Bank Non-Financial Report 2022 Employees and corporate social responsibility at a glance Countries Nationalities 1 Total FTE 58 157 84,930 13,980 1 Corporate Bank FTE per region 35,594 Germany 7,657 Investment Bank 26,951 Private Bank 4,283 Asset Management 23,236 194 APAC Capital Release Unit 7,721 31,865 Americas 18,379 Infrastructure EMEA 11,783 Part time employees (in Headcount) 1 Numbers may not add up due to rounding Employee commitment index Employee enablement index 69 71 69 76 73 73 2020 2021 2022 2020 2021 2022 % of our employee survey respondents feel committed % of our employee survey respondents feel enabled to the Bank to do their jobs Facts and 昀椀gures 2022 46.4 % 30,7 % € 33.5million of our workforce are female Women in senior Corporate Titles Managing spent for employee Director, Director, Vice President training in 2022 1,278 € 55.1 million Over 18,700 graduates and vocational invested in CSR initiatives and employees worldwide trainees hired in 2022 art, culture, and sports projects by volunteered Deutsche Bank and its foundations 108
Deutsche Bank Employees and corporate social responsibility Non-Financial Report 2022 Employment and employability Employment and employability – Employee feedback culture index increased to 73% – Increasing gender diversity targets for senior corporate titles to 35% by 2025 GRI 2-25, 3-3 Deutsche Bank’s success depends largely on its employees - their ideas, skills, commitment, and health. The bank’s Human Capital agenda seeks to create an environment where employees unleash their full potential and are empowered to work together to continually enhance the bank’s sustainable performance culture. Transforming the way Deutsche Bank works is an essential part of the bank’s strategy 2025+ as announced in the Investor Deep Dive in March 2022. By focusing on the bank’s Human Capital cornerstones, the bank enables the strategic transformation and reflects latest workforce trends as well as Management Board objectives, agreed on with the Supervisory Board. – Enable all leaders to lead the future: In a co-creational approach the bank agreed a new leadership DNA, fostering equity, innovation, inspiration, client-centricity and purpose-led leadership – the bank’s ‘Leadership Kompass’; this leadership aspiration is in line with the bank’s Code of Conduct, its Values and Beliefs and gets embedded into the bank’s people processes; diversity, equity, and inclusion remains a priority and to be successful at embedding diversity, equity and inclusion in the bank’s culture, behaviors and processes, the bank relies on its leaders to understand how to manage diverse teams, be inclusive, and take responsibility for guiding and empowering its employees – Unleash potential of all employees: In order to retain and attract talents, up- and reskilling opportunities as well as the launch of a new state-of-the-art learning platform enables the bank’s employees to foster their skills development at scale and to have a personalized learning experience – Align workforce to future business needs: The bank is in the process of strengthening the link between skills and roles in its frameworks to enable more consistent and transparent career paths across functions; the bank emphasizes agile work practices and strengthens forms of collaboration by, for example, continuously working on its meeting culture with fewer, smaller and shorter meetings – giving time back to its employees, to use more productively; by strengthening flexible work arrangements that promote a healthy work-life balance, the bank continues to provide an attractive and inclusive work environment for different generations – Keep the bank safe: The bank’s compensation framework promotes and rewards outperformance that is achieved in line with its values and beliefs; speaking up, providing and receiving feedback, as well as aligning employee’s priorities to the bank’s strategy, remain vital parts of the bank’s corporate culture Information on additional employee-related aspects, such as employee engagement, performance management, and health management, is published separately in the bank’s Human Capital Report (*). Governance GRI 2-12/13/23/24/25, 3-3, FS1 The mandate of the bank’s Global HR Executive Committee is to oversee and to take responsibility for the definition and execution of the HR strategy and priorities. The committee consists of the bank’s Global Head of HR, divisional, functional, and regional HR heads, as well as the HR heads responsible for processes and products in the countries where the bank operates. The bank’s HR governance is guided by its Code of Conduct and international frameworks, standards, and principles. These include the Guidelines for Internal and External Human Capital Reporting issued by the International Organization for Standardization (ISO 30414) in December 2018. The bank’s group-wide policies cover a wide range of HR topics, such as hiring, performance and career management and development, the assessment of managers and key function holders, international assignments, diversity and inclusion, compensation, offboarding, termination, and employee-related incident management. The bank also has guidelines and policies for performance management procedures, disciplinary action and dismissal, grievances, harassment and bullying, and other issues. HR KPIs, such as the number of Full Time Equivalent (FTE), workforce movements, and employee turnover rates are presented to the Management Board, Supervisory Board, and senior management on a regular basis. Deutsche Bank’s Code of Conduct (*) defines the standards of behavior and conduct to which the bank expects all of its employees and the bank as an organization to adhere to. The purpose of the Code of Conduct is to ensure that the bank conducts itself ethically, with integrity, and in accordance with the bank’s policies and procedures as well as applicable laws and regulations. Beyond mere compliance, however, the bank is committed to always doing what is right and proper. 109
Deutsche Bank Employees and corporate social responsibility Non-Financial Report 2022 Employment and employability The bank’s monthly HR Controls Dashboard monitors HR’s operating performance in managing employment practices risk and provides an overview of important control indicators regarding the employee life cycle. The results are presented to the bank’s HR Executive Committee, which determines whether the matter needs to be reported to the Management Board. Since its implementation in 2019, the dashboard has reinforced risk awareness among the bank’s HR leaders and has thus helped strengthen HR’s control environment. Workforce management Workforce development GRI 2-6/7/8/25/30, 3-3, 401-1/2, 404-2 At year end 2022, Deutsche Bank increased the number of employees by 1,961 (2.4%) year-on-year, from 82,969 to 84,930 mainly due to business growth, strengthening the IT function and internalizations. The number of embedded external workforce (contractors, agency temps and IT vendor resources) increased by 88 (1.3%) year-on-year, from 6,874 to 6,962. FTE by employment relationship In FTE Dec 31, 2022 Dec 31, 2021 Dec 31, 2020 Thereof: Thereof: Thereof: Deutsche Bank Deutsche Bank Deutsche Bank Deutsche Bank Deutsche Bank Deutsche Bank Group AG Group AG Group AG Permanent employees 84,492 35,204 82,495 34,770 84,194 36,282 Temporary employees1 438 81 474 89 465 59 Total 84,930 35,285 82,969 34,859 84,659 36,341 1 Primarily in Germany Full-time and part-time employment Deutsche Bank Group by region In % Dec 31, 2022 Dec 31, 2021 Dec 31, 2020 Female part- Female full- Female part- Female full- Female part- Female full- Part-time time time Part-time time time Part-time time time 2 3 4 2 3 4 2 3 4 employees employees employees employees employees employees employees employees employees All regions 12.9 87.7 40.3 13.8 88.3 39.9 14.3 88.7 39.4 Germany 26.0 88.1 39.8 26.8 88.5 40.4 27.2 88.7 40.5 1 Europe , Middle East 5.4 84.6 38.6 5.6 86.4 37.5 5.8 88.5 36.8 and Africa Americas 0.3 68.2 38.7 0.3 73.9 37.8 0.2 77.8 37.2 APAC 0.1 89.3 42.8 0.2 90.3 42.2 0.1 100.0 41.0 Note: full-time employees in % of total employees = total employees minus part-time employees in % of total employees 1 Outside of Germany 2 In % of total employees 3 In % of total part-time employees 4 In % of total full-time employees 110
Deutsche Bank Employees and corporate social responsibility Non-Financial Report 2022 Employment and employability New employee hires and employee turnover by region In FTE1 Dec 31, 2022 Dec 31, 2021 Dec 31, 2020 Thereof: Thereof: Thereof: Deutsche Bank Deutsche Bank Deutsche Bank Deutsche Bank Deutsche Bank Deutsche Bank Group AG Group AG Group AG All Regions FTE at year end 84,930 35,285 82,969 34,859 84,659 36,341 New employee hires 12,717 2,889 8,983 2,178 7,202 1,753 Employee turnover (10,337) (2,920) (9,447) (2,751) (8,000) (1,940) 2 Other (419) 457 (1,227) (909) (2,140) 11,201 Germany FTE at year end 35,594 22,201 35,741 21,589 37,315 22,305 New employee hires 1,670 971 1,179 611 1,337 397 Employee turnover (2,397) (968) (2,017) (755) (2,616) (439) 2 Other 580 609 (736) (573) (1,897) 11,215 3 Europe , Middle East and Africa FTE at year end 18,379 7,879 19,311 8,061 19,617 8,470 New employee hires 2,275 896 2,487 823 1,796 821 Employee turnover (2,310) (1,071) (2,607) (1,062) (1,743) (816) 2 Other (898) (6) (186) (170) (108) (7) Americas FTE at year end 7,721 447 7,701 454 8,297 560 New employee hires 1,544 84 1,144 64 1,053 50 Employee turnover (1,531) (79) (1,655) (115) (1,205) (105) 2 Other 7 (12) (85) (55) (113) (29) APAC FTE at year end 23,236 4,758 20,215 4,755 19,430 5,005 New employee hires 7,228 939 4,173 680 3,016 485 Employee turnover (4,099) (801) (3,168) (819) (2,437) (580) 2 Other (107) (135) (220) (111) (24) 22 Note: In 2022, Deutsche Bank aligned its FTE movement definition, FTE movements for 2020/21 retroactively adjusted (2020: 11 FTE; 2021: 18 FTE) 1 Numbers may not add up due to rounding 2 Other consists primarily of FTE changes, divestments and transfers, e.g., from AG to subsidiaries and vice versa; examples include the merger of DB Privat- und Firmenkundenbank AG into Deutsche Bank AG in 2020 3 Outside Germany New employee hires by age structure In %1 Dec 31, 2022 Dec 31, 2021 Dec 31, 2020 Thereof: Thereof: Thereof: Deutsche Bank Deutsche Bank Deutsche Bank Deutsche Bank Deutsche Bank Deutsche Bank Group AG Group AG Group AG 15 - 29 years 43.7 36.1 43.8 35.5 46.6 36.4 30 - 39 years 39.3 38.1 36.9 35.3 34.4 35.5 40 - 49 years 12.9 19.1 14.4 20.7 13.3 21.5 50 - 59 years 3.6 5.6 4.5 8.2 5.2 6.5 Over 59 years 0.5 0.8 0.4 0.4 0.6 0.2 1 Numbers may not add up due to rounding New employee hires by gender In %1 Dec 31, 2022 Dec 31, 2021 Dec 31, 2020 Thereof: Thereof: Thereof: Deutsche Bank Deutsche Bank Deutsche Bank Deutsche Bank Deutsche Bank Deutsche Bank Group AG Group AG Group AG Women 43.2 41.4 42.3 38.1 41.5 35.9 Men 56.7 58.5 57.6 61.9 58.5 64.1 1 Numbers may not add up due to rounding Employee turnover by age structure In %1 Dec 31, 2022 Dec 31, 2021 Dec 31, 2020 Thereof: Thereof: Thereof: Deutsche Bank Deutsche Bank Deutsche Bank Deutsche Bank Deutsche Bank Deutsche Bank Group AG Group AG Group AG 15 - 29 years 25.9 19.2 26.4 20.7 24.0 17.6 30 - 39 years 37.0 32.9 34.6 33.6 32.9 35.1 40 - 49 years 17.3 23.7 16.7 22.3 18.1 27.5 50 - 59 years 11.8 13.9 12.7 15.2 14.6 13.4 Over 59 years 7.9 10.3 9.7 8.3 10.5 6.4 1 Numbers may not add up due to rounding 111
Deutsche Bank Employees and corporate social responsibility Non-Financial Report 2022 Employment and employability Employee turnover by gender In %1 Dec 31, 2022 Dec 31, 2021 Dec 31, 2020 Thereof: Thereof: Thereof: Deutsche Bank Deutsche Bank Deutsche Bank Deutsche Bank Deutsche Bank Deutsche Bank Group AG Group AG Group AG Women 42.2 40.2 40.0 38.4 41.6 36.0 Men 57.8 59.8 60.0 61.5 58.4 64.0 1 Numbers may not add up due to rounding Deutsche Bank is committed to collective bargaining, concluding collective bargaining agreements, and amending or refining existing agreements. Deutsche Bank’s close and constructive cooperation with employee representatives and social partners is characterized by mutual trust. Deutsche Bank remains committed to carrying out employee reductions in a transparent and socially responsible manner. Restructuring measures generally provide an appropriate notice period for employees. Termination periods (as well as consultation or negotiation requirements, if such apply) reflect the legal norm in each country, such as laws, collective bargaining agreements, employee handbooks, and/or individual employment contracts. In Germany, for example, tariff employees are subject to the termination periods laid down in the respective collective bargaining agreements. In contrast, non-tariff employees are subject to contractual or statutory termination periods. The bank cooperates with employee representatives and their councils based on applicable laws. In Germany, for example, where the majority of the bank’s employees are based, the Works Constitution Act (Betriebsverfassungsgesetz, BetrVG) governs the involvement of works councils by stipulating their rights and duties and by prescribing the cases and form in which employers are required to involve a works council. Workers councils, whose members are elected every four years, represent employees’ interests through discussions and negotiations with Deutsche Bank. The bank’s executive employees have their own representative committee, which is likewise governed by German law (Sprecherausschussgesetz). Based on the agreement on cross-border information and consultation of Deutsche Bank employees in the EU, concluded on September 10, 1996, the European Works Council represents all employees working in the EU. This amounts to about half of the bank’s workforce. As German law prohibits the bank from asking employees whether they belong to a labor union, there is no record of how many of the bank’s employees are union members. The bank’s approach to organizational change is holistic and embedded in its social plan. Its purpose is to support employees affected by restructuring measures by enhancing their employability and offering them individually tailored coaching in change scenarios. Employees, managers, members of the works council, and Human Resource advisors involved in change processes have access to a comprehensive set of measures. In addition, the approach supports the bank’s strategy to fill open jobs with suitable candidates from inside the organization and to utilize a network of specialist firms to identify job opportunities outside the organization. Deutsche Bank tries to comply with all applicable laws, rules and regulations of the countries in which it operates. This includes sovereign state legislation on collective agreements, bargaining and freedom of association. Together with employee representatives, the bank seeks solutions that best align the interests of the employees possibly affected by labor-law measures and of Deutsche Bank. This includes adhering to all local statutory and regulatory requirements. The bank maintains a constructive dialogue with all its employee representatives and trade unions and interact in partnership and in a spirit of trust. In Germany (45% of the Group’s Headcount) about 60% of all employees are covered by collective bargaining agreements; about 96% of all employees in Germany are covered by works councils/works council agreements. Recruiting and talent development GRI 2-25, 3-3, 401-1/2, 404-2 In 2022, recruiting talent remained a key priority for the bank. Hiring focused on filling front office roles in growth areas (such as at International Private Bank and Asset Management), strengthening the IT function, replacing operation-center employees who left voluntarily and onboarding talents to meet the growing demand for regulatory roles (such as Client Lifecycle Management and Anti-Financial Crime). The bank also insourced 1,806 external roles (2021: 1,697), particularly in IT. Average time to fill vacant positions increased in 2022 post COVID-19 pandemic. 112
Deutsche Bank Employees and corporate social responsibility Non-Financial Report 2022 Employment and employability Average time to fill vacant positions 1,2 In days 2022 2021 2020 Thereof: Thereof: Thereof: Deutsche Bank Deutsche Bank Deutsche Bank Deutsche Bank Deutsche Bank Deutsche Bank Group AG Group AG Group AG Average length to fill vacant positions 86 81 81 74 74 69 1 Days elapsed between the creation of a job opening and the date a job offer was made 2 Excluding Postbank Graduates and vocational trainees Deutsche Bank remains committed to its strategic priority of hiring university graduates, as they help propel the bank’s change agenda. In 2022, the bank conducted a fully virtual orientation and training program for the bank’s global, cross-divisional graduates. The focus on hiring graduates was in the Investment Bank, Corporate Bank, International Private Bank, and the Technology, Data & Innovation, as part of the bank’s efforts to reinforce its capability and engineering culture. Vocational training and work-study programs are essential components of the bank’s junior employee strategy. Particularly in Germany they offer an additional opportunity to attract junior talent. Hired global graduates and vocational trainees In headcount 2022 2021 2020 Thereof: Thereof: Thereof: Deutsche Bank Deutsche Bank Deutsche Bank Deutsche Bank Deutsche Bank Deutsche Bank Group AG Group AG Group AG Recruitment and talent management Hired global graduates 793 312 890 300 717 309 Hired vocational trainees 485 253 530 292 570 336 Learning & Development Building the bank’s learning culture and providing quality and inclusive solutions for all employees is a critical pillar of the bank’s ongoing HR strategy. In addition to its rigorous calendar of regulatory and mandatory training the bank has developed its learning offering significantly. Besides the bank’s learning management system, Deutsche Bank launched the LearningHub in March 2022. This state-of- the-art system uses Machine Learning to feed personalized learning recommendations to employees across the globe. Teams of experts across the bank can create and curate learning paths specific to their divisional needs - therefore enabling faster and more relevant skill development. In 2022, around 621 thousand hours regarding mandatory governance, primarily risk management and compliance trainings have been conducted. The bank believes learning is everywhere - not only in formal courses and events. Experience based learning continues with evolving the mystery coffee tool to connect employees virtually or face - aligning with the bank’s future of work strategy. This tool enabled over 40,000 matches and thereby triggered conversations between colleagues who otherwise would not have met. Internal career mobility Internal mobility plays a vital role in developing and retaining qualified, talented employees and ensuring that the bank continues to benefit from their expertise and experience. The bank fosters mobility between divisions, which enables employees to broaden their skills and experience. Moreover, internal mobility helps reduce the bank’s redundancy and recruitment costs. In 2022, Deutsche Bank continued to implement its internal mobility strategy and live up to its commitment to filling one-third of all vacant positions with suitable candidates from within the organization. Vacant positions (except for Managing Directors) are typically first advertised inside the group for at least two weeks. Prioritizing internal candidates helps employees affected by restructuring find new roles in the bank. Internal fill rates and saving from redeployment 2022 2021 2020 Thereof: Thereof: Thereof: Deutsche Bank Deutsche Bank Deutsche Bank Deutsche Bank Deutsche Bank Deutsche Bank Group AG Group AG Group AG 1 Internal job vacancy fill rate (in %) 27.3 46.1 31.0 50.2 35.9 47.4 thereof Managing Directors and Directors 42.7 53.1 38.7 46.6 52.7 53.1 thereof Vice Presidents 47.3 55.7 43.3 52.6 52.0 48.4 thereof Critical business positions2 71.0 72.0 57.1 53.3 96.4 96.0 1,3 Savings from redeployment (in € m) 12 10 32 28 24 20 1 Excluding Postbank 2 Definition in line with ISO 30414 – Human Capital Reporting 3 Sum of avoided severance/restructuring costs and saved hiring costs 113
Deutsche Bank Employees and corporate social responsibility Non-Financial Report 2022 Employment and employability Leadership development Through its Leadership Kompass (Kompass) the bank has set out eight behaviors that support its way forward and serve as a guide on how the bank can bring its leadership DNA to life. The Kompass specifies the leadership standards for the bank. It provides guidance for the bank’s leadership culture and shows where it needs to build its capabilities. A complex and fast- moving environment requires new ways of working together, connecting, and leading with purpose, based on a common leadership language, vision and behaviors. Kompass sets out the behaviors that support sustainable business practices, the development and well-being of its people and the way the bank puts customers at the heart of all its decisions, in line with its values and beliefs. Kompass behaviors are explored in deep dive sessions and flanked by a comprehensive upward feedback tool in 2023. To bring Kompass to life and support Deutsche Bank's strategy by transforming the way the bank leads, the bank builds up a consistent manager curriculum. It aims to create a common bank-wide framework for leadership development. The First-time Manager Program, piloted in autumn 2022, is the first initiative in this direction. It is designed to be a global, cross-divisional program targeted at people managers who lead a team for the first-time at Deutsche Bank and is based on Kompass. The First-time Manager Program equips managers with the essential knowledge and skills required to be a successful manager at Deutsche Bank. The First-time Manager Program offers two versions - the Core and the Senior Leaders Version, which differ in length and design depending on the managerial level. Training content on leadership styles, coaching, feedback, wellbeing, inclusion, hybrid working, conflict management and motivation has been specifically compiled and tailored into virtual training content. dbBOLD, an investment in the career development and growth of Black Vice Presidents and Directors, underscores the bank’s commitment to building a robust and diverse pipeline of Black talent. Talent acceleration Deutsche Bank’s talent acceleration programs aim to help employees develop professionally and personally and to accelerate their readiness to take on more senior roles. They provide participants with high-quality instruction, ample networking opportunities, and time to focus on their development. The bank updated content of the programs aims to ensure that it remains at the cutting edge of business thinking in a rapidly changing world. The Accomplished Top Leaders Advancement Strategy (ATLAS) program is aimed at accelerating the readiness of senior, high-potential women to take on broader roles in the organization and increasing the number of women in senior, influential positions across the bank. One aspect of this is strengthening the female talent pipeline for managing director roles by enhancing capabilities in areas like business strategy, functional expertise, and leadership. Another purpose of the program is to raise the profile of women senior managers and, in collaboration with the female talent networks drawn from all of the acceleration programs, to foster collaboration across divisions and empower women to act as a catalyst for change. The Vice President and Director talent acceleration programs develop the capabilities of high-potential talent across the bank, readying them for their next step of their career, a bigger role, or a new role elsewhere in the organization. Each program is tailored to its intended audience, covering topics such as agile leadership, change leadership, and leading with authenticity. Participants also have the opportunity to interact with the bank’s senior leaders, enabling them to raise their profile and share their ideas with a senior audience. These programs play an important role in the bank’s progress toward its diversity targets. The Director program, for example, has a module specifically for woman called Women Global Leaders. It draws on research to identify paths for accelerating career growth and provides personal guidance on strengthening vital leadership networks, especially with the women in the other acceleration programs. Its overall aim is to empower female leaders to maximize their impact. The talent acceleration alumni group, created in 2020, aims to continue the engagement with the bank’s top talent, even after they have completed their Acceleration program. The network grew in 2022 and had more interactions with senior management and with each other in talent-develops-talent sessions. The Women Global Leaders’ alumni were invited to host small career coaching circles for the Vice President participants, a new and successful addition to the programs in 2022. The Schneider-Lenné Cadre named after Ellen Schneider-Lenné, the first woman on Deutsche Bank’s Management Board, is a community of the bank’s senior women leaders consisting of senior management risk takers as well as current and former ATLAS participants. Cadre members discuss key issues with senior management, support the development of female talent, and accelerate cultural change, particularly to help the bank achieve its gender diversity targets. 114
Deutsche Bank Employees and corporate social responsibility Non-Financial Report 2022 Employment and employability Acceleration programs 2022 2021 2020¹ Thereof: Thereof: Thereof: Deutsche Bank Deutsche Bank Deutsche Bank Deutsche Bank Deutsche Bank Deutsche Bank Group AG Group AG Group AG Participation in cross divisional talent acceleration programs (headcount) ATLAS acceleration program for senior 18 13 19 13 n/a n/a female Managing Directors Director acceleration program 123 94 115 76 n/a n/a thereof women (in %) 41.5 43.6 47.0 43.4 n/a n/a Vice President acceleration program 300 197 291 176 n/a n/a thereof women (in %) 49.7 49.7 45.0 43.2 n/a n/a 1 In-person talent acceleration programs were suspended in 2020 owing to COVID-19 pandemic Employee feedback culture GRI 2-18/23/29 Deutsche Bank puts care into hiring the right people, developing them, and ensuring they have the relevant skills. In turn, the bank’s employees need to be heard, included, recognized, cared for, and provided with positive leadership to promote productivity. Strong relationships, open communication, and learning from feedback are essential for fostering this environment. The bank has therefore made regular conversations between manager and employee a central feature of how it manages and develops performance and careers in the long term. The bank believes these conversations promote a trusting environment in which employees feel comfortable bringing up personal issues, asking for support in solving business problems, and addressing performance or behavior issues that need to improve, change, or stop. The bank’s annual People Survey asks employees to say how they feel about their job, the bank, what it does well, and where it needs to improve. The survey measures key indicators, such as commitment (degree of pride and motivation as employees, willingness to recommend the bank to friends and family), enablement (degree of productivity in their role, its challenge and interest to them, and whether they have the right skills, tools, and resources to perform it well), and engagement with the bank’s values (familiarity with the values and the behaviors that contribute to a productive environment). The survey also addresses strategically important issues, such as active and visible leadership and the bank’s ethics, conduct, and Speak-Up Culture. The People Survey contains four questions about the frequency and quality of upward and downward feedback, team meetings, and appreciation with results consistently showing that regular conversations (once a month or more frequently) make a positive difference in employees’ motivation and perceived productivity. Since 2020 these four questions have been asked in a quarterly survey to provide for a feedback culture KPI, which is reported to the Management Board. In 2022 the feedback culture survey and KPI were renamed ‘Culture Pulse KPI’ and enhanced by the addition of a question about productive behaviors and an increased target. Goal and progress of the bank’s feedback culture 2022 2021 2020 Goal Result Result Result 1 Employee Feedback Culture Index (in%) 72 73 70 71 Deutsche Bank Group 1 Employee feedback culture index represents the average favorability score in the fourth quarter in percent An index of 70% or higher indicates a healthy corporate culture in which employees have frequent and high-quality interactions with their manager, know expected behaviors, and feel productive and motivated. Future of Work GRI 2-25, 3-3, 401-2, 403-1/5/6, 404-2 Hybrid work model Deutsche Bank is a leading global organization because of its employees. Many of the bank’s employees had not experienced remote work until the COVID-19 pandemic. The bank’s regular Future of Work survey asked whether they would like to retain it to some degree. The majority of the bank’s employees prefer to work remotely one day per week or more. The bank believes hybrid work enables employees to combine the benefits of both remote and in-office work. The latter, however, remains critical for the face-to-face collaboration that fosters team spirit and creativity and that enables the bank to live up to its responsibilities toward its clients. Voluntary arrangements enable eligible employees to work remotely one to three days a week. The agreed-on schedule requires flexibility from both sides: employees may occasionally need to stay home on an in-office day or work in the office on a remote workday. 115
Deutsche Bank Employees and corporate social responsibility Non-Financial Report 2022 Employment and employability Health and well-being Deutsche Bank aims to create a health-promoting and caring work environment where its people can be themselves, feel supported and happy, so they can perform at their best and thrive in their careers. The goal is to embed health and well-being at the heart of the bank’s culture. Deutsche Bank wants to proactively empower its people to prioritize their own well-being and support those around them in doing the same. Health and well-being are about everyday behaviors, based on the following four dimensions: physically thriving, emotionally and mentally balanced, socially connected and financially secure. The bank is working continuously to align its well-being offerings with the benefit portfolios, Diversity & Inclusion initiatives, the new hybrid working model and the Talent & Development agenda, including Leadership development, to share best practices across the organization, and implement the well-being agenda in line with the bank’s governance and cost requirements. To make the bank’s well-being offerings more transparent to employees, raise awareness and be better aligned across divisions and regions the new global “Deutsche Bank Well-being Hub” was launched in September 2022. The hub brings together an array of existing resources, initiatives, and benefits from across the bank into one place, making it easier for employees to find information on places to go for support (for example Employee Assistance Program 24 hours hotline, Mental Health First Aider, company doctors, etc.) or for resources about personal development. There are also several useful hints on how to boost well-being. Employees’ mental health remains a top priority. The number of Mental Health First Aiders - employees who volunteer to actively support their colleagues’ mental health - remains on a high level with 423 aiders in 2022 (447 in 2021), who are organized in an international working group to better coordinate their efforts. In addition, the bank is offering an in-house eLearning module on mental health awareness. The message “It’s ok not to be ok” is included in senior management communication and across the platform on a regular basis. On World Mental Health Day in 2022, Management Board member and well-being sponsor Fabrizio Campelli reiterated the bank’s commitment to its well-being agenda and participated in some of numerous in-house events worldwide. The overview of the bank’s health service is available here (*). ISO 30414, “Human resource management,” also recommends disclosing lost-time injuries, the number of occupational accidents, and the number of employees killed on the job. Serious incidents like these are extremely rare at a bank and are more relevant to the safety reporting of other industries. Diversity, equity and inclusion GRI 2-25, 3-3, 401-2 Diversity and Inclusion are the foundations on which the bank’s values are built and are pre-requisites for its Global Hausbank ambitions. The bank aims to attract, develop, and retain talented employees from all cultures, countries, races, ethnicities, genders, sexual orientations, disabilities, beliefs, backgrounds, and experiences. The bank wants all its employees to feel a sense of belonging by creating an inclusive work environment where everyone feels welcomed, respected, listened to, treated fairly and can contribute and grow. The bank’s leaders understand the importance of building inclusive teams of employees with different skills, backgrounds, and experiences who are empowered to contribute their best work and supported to create a fulfilling career. They are expected to shape a more equitable culture where open dialogue and diversity of views are encouraged to enable continuous learning. Throughout 2022 the bank continued to embed diversity, equity and inclusion in its culture and employee practices by supporting the advancement of women and members of other under-represented groups. The steps the bank takes include targeted outreach to attract and hire, enhanced career planning, leadership development, exposure opportunities, and senior leader sponsorship. The bank continues to equip its people with resources to practice inclusion and understand how to make equitable people-related decisions. The bank’s inclusive culture and work environment encompasses full-time, part-time, and temporary employees. In line with laws in the European Union and the United Kingdom, the bank provides all benefits available to full-time employees to part- time employees as well. Deutsche Bank operates more than 850 employee benefit plans in its different locations that include life insurance, health care, disability coverage, parental leave, retirement provision, stock ownership, medical insurance, risk cover, vacation/leave, transportation, meals/nutrition, childcare, and many other benefits. Temporary employees may also be eligible depending on the nature of the benefit. The number of the bank’s part-time and temporary employees outside Europe is not material. The overview of rewards and benefits is available here (*). 116
Deutsche Bank Employees and corporate social responsibility Non-Financial Report 2022 Employment and employability Gender diversity GRI 2-25, 3-3, 405-1 At year end 2022, six or 30% of Supervisory Board members were women (2021: 30%). This met the statutory requirement of 30% for publicly listed and codetermined German companies pursuant to gender quota legislation that took effect in 2015. The Supervisory Board’s goal, set in 2017, is to have at least 20% women on the Management Board by June 30, 2022. Two women would be required to achieve this goal on a Management Board with between eight and twelve members. With Christiana Riley and Rebecca Short on the Management Board, this goal was met on June 30, 2022. The current German Gender Quota Law (Zweites Führungspositionen-Gesetz, FüPoG II) requires appointing at least one woman and one man to a management board with more than three members, no additional goals must be laid down. The bank exceeded this requirement as of December 31, 2022. As part of the bank’s 35 by 25 commitment, the bank aims to have women to represent at least 35% of its Managing Director, Director, and Vice President population by 2025 (excluding Asset Management and Capital Release Unit). The bank also plans to have at least 30% women in the positions one and two levels below the Management Board (excluding Asset Management and Capital Release Unit). Goals and results for the representation of women Dec 31, 2022 Dec 31, 2021 Dec 31, 2020 Goal Result Result Result 1 Level (headcount, in %) Supervisory Board 30.0 30.0 30.0 30.0 2 Management Board 20.0 20.0 20.0 10.0 3 Management Board level -1 30.0 17.1 20.0 20.0 3 Management Board level -2 30.0 29.6 27.5 23.9 4,5 Corporate Title (headcount, in %) Managing Directors, Directors, Vice Presidents 35.0 30.7 29.9 29.6 1 Pursuant to Germany’s Law for the Equal Participation of Women and Men in Management Positions in the Private and Public Sectors 2 Goal reflects June 2022 3 Goal reflects December 2025 4 Goal reflects December 2025 including the following year’s promotions 5 Excluding Asset Management and Capital Release Unit The bank’s promotion and appointment decisions in particular are based on candidates’ suitability for a role, their potential, and their demonstrated performance. Gender diversity Dec 31, 2022 Dec 31, 2021 Dec 31, 2020 Thereof: Thereof: Thereof: Deutsche Bank Deutsche Bank Deutsche Bank Deutsche Bank Deutsche Bank Deutsche Bank Group AG Group AG Group AG Female employees by corporate title 1,2 (headcount, in %) Managing Directors 20.9 22.1 19.3 20.8 18.4 19.8 Directors 26.7 26.4 25.7 25.5 25.1 25.0 Vice Presidents 33.5 33.1 32.8 32.5 32.4 32.4 Assistant Vice Presidents and Associates 41.8 44.4 41.3 45.0 40.6 44.5 Non-Officer 59.7 61.3 60.4 62.3 59.9 63.1 1 Total female employees (headcount, in %) 46.4 45.1 46.6 45.5 46.4 45.8 1 Numbers may not add up due to rounding 2 Corporate titles for Postbank (including subsidiaries) are technically derived The bank is committed to increasing the proportion of women in senior leadership positions across the organization, but it is the bank’s individual businesses that deliver on this commitment. Since cultures and social challenges vary by country and type of business, each of the bank’s regions and business has its own diversity, equity, and inclusion efforts. The Management Board is committed to these targets, and the bank has put in place targeted initiatives to accelerate change. These initiatives have been implemented across the entire employee life cycle, from attracting and hiring talent to developing, retaining, and promoting it. A law enacted in 2017 requires all companies in the United Kingdom with 250 or more employees to report their gender pay gap annually. In March 2022, the bank published its fifth UK Gender Pay Gap Report. The median hourly pay gap slightly increased from 25.6% in 2020 to 25.7% in 2021. The median bonus pay gap narrowed from 48.5% to 48.0%. The effort and initiatives in place are expected to have a positive impact on the gap over time. The UK Gender and Ethnicity Pay Gap Report for 2022 planned to be disclosed end of March 2023. 117
Deutsche Bank Employees and corporate social responsibility Non-Financial Report 2022 Employment and employability An inclusive work environment GRI 2-25, 3-3, 405-1, 406-1 The bank has affirmed for almost two decades that having a diverse, equitable and inclusive work environment is important to its overall success. During this time, it has forged strategic partnerships with organizations worldwide, such as Charta der Vielfalt (Charter of Diversity), the U.K. Treasury’s Women in Finance Charter, CEO Action for Diversity & Inclusion, the Diversity & Inclusion in Asia Network, the UN Standards of Conduct for Business for Tackling Discrimination Against LGBTI People, Open for Business, the Partnership for Global LGBTI Equality and Racial Justice in Business initiative, and the Valuable 500. These partnerships help the bank advance its agenda both internally and externally. Everyone, including historically marginalized groups, is free to bring their best selves to work, and their different backgrounds and experiences bring inclusiveness to daily interactions. To make further progress, particularly in racial and ethnic diversity the bank has outlined specific steps to advance the bank’s inclusive culture, beginning in the United States and the United Kingdom. These steps include holding conversations about race, improving diversity in leadership development and advancement, and changing hiring practices. In December 2020, the bank announced its targets to increase the number of Black colleagues at the bank’s two highest title levels in the United States by 50% over the next three years and to increase the proportion of Black talent in the bank’s graduate programs to 10% by 2025. The bank is taking targeted action to achieve these targets and monitoring progress on a regular basis. In addition to that, the bank agreed an ambition to increase Black representation in the UK by over 30% by December 31, 2025. To reach this goal the bank will be focusing on both the retention and lateral hiring rates for Black talent across all corporate titles. The bank is also seeking to increase the intake of Black graduates in the UK, with a goal of 7% starting in 2022, and 10% across Early Careers (pre graduate) programs. In 2022, the bank took part in Germany in the pilot project “Antiracist Awareness Raising – Strengthening competencies for diversity in the workplace” initiated by Charta der Vielfalt e.V.. Since 2021, the bank has published the annual summaries of its submission to the U.S. Equal Employment Opportunity (EEO) Commission, voluntarily disclosing U.S. regional diversity statistics. The racial and ethnic diversity of the bank’s US workforce has increased by approximately 1% overall. Diversity, equity and inclusion are key success factors for the bank and many of its clients. The data voluntarily published reflects the bank’s commitment to transparency. U.S. diversity statistics according to U.S. Equal Employment Opportunities (EEO) Commission for Dec. 2022 Dec 1, 2022 Native Hawaiian or Pacific Native American Two or More in % White Asian Latinx Black Islander or Alaska Native Races EEO-1 Level Executive / Senior Level Officials and Managers 90.00 5.00 0.00 5.00 0.00 0.00 0.00 First / Mid Level Officials and Managers 68.43 19.20 7.58 3.54 0.31 0.06 0.87 Professionals 46.36 32.90 8.36 10.18 0.27 0.16 1.78 Sales Workers 46.69 15.66 21.08 14.46 0.00 0.30 1.81 Administrative Support Workers 41.18 11.03 21.32 20.96 0.74 0.37 4.41 Total 51.61 27.77 9.31 9.22 0.28 0.15 1.66 U.S. diversity statistics according to U.S. Equal Employment Opportunities (EEO) Commission for Dec. 2021 Dec 1, 2021 Native Hawaiian or Pacific Native American Two or More in % White Asian Latinx Black Islander or Alaska Native Races EEO-1 Level Executive / Senior Level Officials and Managers 90.48 4.76 0.00 4.76 0.00 0.00 0.00 First / Mid Level Officials and Managers 69.59 17.78 7.89 3.74 0.12 0.12 0.76 Professionals 46.23 35.19 7.97 9.15 0.18 0.14 1.14 Sales Workers 47.56 16.16 17.68 17.38 0.00 0.30 0.91 Administrative Support Workers 48.08 8.89 18.51 20.91 0.00 0.24 3.37 Total 52.35 28.27 9.03 8.90 0.15 0.15 1.16 118
Deutsche Bank Employees and corporate social responsibility Non-Financial Report 2022 Employment and employability LGBTQI (Lesbian, Gay, Bisexual, Transgender, Queer, and Intersex) inclusion is also an important diversity priority. The bank is an acknowledged industry leader for taking a strong stance on worldwide LGBTQI rights, is one of 15 founding members of the Accelerating LGBTQI+ Inclusion Globally initiative, has been awarded the maximum score of 100 in the Human Rights Campaign’s annual Corporate Equality Index for 19 consecutive years, and has paused hiring and removed suppliers where discrimination has occurred. In 2022, the bank won prestigious awards: Human Rights Campaign Foundation’s “Best places to work for LGBTQ Equality” and Yahoo Finance’s “OUTstanding LGBT+ Role Model Lists.” The bank’s long-standing Ally program is one of the ways it supports LGBTQI people. Allies are individuals who do not necessarily self-identify as members of the LGBTQI community but who are willing to be visible champions of LGBTQI employees and their loved ones. The bank is proud to have and support several voluntary and employee-led Employee Resource Groups. Increasing acceptance, awareness and support for under-represented groups and highlighting challenges, these groups host a variety of events, learning and development opportunities, discussions on relevant topics and community outreach. Depending on the location the bank’s Employee Resource Groups currently support a variety of communities such as women, LGBTQI employees, employees from multicultural backgrounds, parents, different generations, and veterans as well as address physical and mental wellbeing. The bank also knows that different generations have different needs. The bank is therefore committed to providing employees with benefits and support suited to each stage of their life and opportunities at every stage of their career. Benefits include childcare, elder care, a wide range of flexible work options, and learning opportunities suited to different career stages. Reverse mentoring programs, in which junior staff mentor more senior colleagues, are helping the bank’s workforce to effectively collaborate across generations in order to maximize ideas and perspectives. Age structure Dec 31, 2022 Dec 31, 2021 Dec 31, 2020 Thereof: Thereof: Thereof: Deutsche Bank Deutsche Bank Deutsche Bank Deutsche Bank Deutsche Bank Deutsche Bank Group AG Group AG Group AG 1 Age (headcount, in %) 15 - 29 years 15.4 11.6 14.7 11.2 14.9 11.8 30 - 39 years 28.1 23.3 28.1 23.4 28.4 24.1 40 - 49 years 26.7 30.2 27.1 31.0 27.1 31.4 50 - 59 years 25.0 30.0 25.7 29.9 25.2 28.5 Over 59 years 4.8 5.0 4.5 4.6 4.4 4.2 1 Numbers may not add up due to rounding Deutsche Bank does not employ children between the age of 0-14 years 119
Deutsche Bank Employees and corporate social responsibility Non-Financial Report 2022 Corporate social responsibility Corporate social responsibility – Reaching more than 1.4 million people with Deutsche Bank’s CSR programs in 2022 – Launching the “How We Live” environmental impact program with 51 projects – Providing more than € 1.5 million for Ukraine relief GRI 3-3, 203-1, 413-1 Deutsche Bank’s corporate social responsibility (CSR) initiatives contribute to the bank’s stated purpose of enabling economic growth and societal progress. They are how the bank makes a positive impact for people and communities. The strategic focus of this social engagement is on education, enterprise, and community. In the reporting year, the bank also added the new How We Live environmental impact program to its global CSR strategy. The bank encourages its employees to contribute their professional expertise and life skills. It aims to maximize the impact of its CSR activities by engaging its stakeholders, forging long-term partnerships with charities, supporting advocacy initiatives, and working with other companies and organizations to promote impact monitoring. All CSR activities help build trust, deepen employee commitment and client loyalty, and enhance Deutsche Bank’s reputation as a socially minded enabler, reliable partner, and catalyst for societal change. According to an internal survey, employees see CSR as a strategic factor (86%) and think that CSR (88%) and corporate volunteering (87%) help to improve the bank’s reputation. countries. The Born to Be, Deutsche Bank’s youth engagement program, (*) consists of 128 education projects in 27 program’s purpose is to empower the next generation by raising aspirations, fostering skills, and improving access to education and employment opportunities. In cooperation with Save the Children Germany, Postbank supports a literacy project in after- school care centers at primary schools to promote educational opportunities. Employees and customers can contribute by donating. In 10 countries, Deutsche Bank’s Made for Good enterprise program (*) helps social and creative enterprises scale their offers by providing advice and support as well as better access to networks and funding. Deutsche Bank helps build strong and inclusive communities (*) wherever it does business. The bank focuses on projects that deliver basic welfare, support individuals experiencing homelessness, promote affordable housing, and improve essential infrastructure. In addition, the bank provides emergency relief in crises and supports disaster recovery. In 2022, 117 community projects in 27 countries CSR environmental impact program How We Live (*) helps protect and restore nature were supported. The newly established and, through education, aims to build a deeper understanding and motivate the next generation to not only care for the natural world, but to lead the way in building a more climate-friendly society. In 24 countries, the bank supported 51 projects focused on oceans and coastlines, rivers and wetlands, forests, farmland and urban green spaces. For more than 25 years, the Plus You volunteering and giving community (*) has enabled employees to volunteer at, and donate to, charitable causes. Corporate volunteering gives the bank’s CSR programs greater impact and enhances employees’ personal development, motivation, and commitment. Governance GRI 2-23, 3-3, FS1 The Corporate Affairs & Strategy department, which includes the Communications and CSR team, reports directly to the CEO. “The Donations, Memberships, Sponsorships Policy – Deutsche Bank Group” defines the mandatory operating framework for Deutsche Bank and external partners acting on its behalf. CSR initiatives are implemented by regional units and endowed foundations. Depending on the amount of the investment, proposals for new initiatives require the approval of local CSR teams, regional CSR councils, and/or board members. In markets with defined legal or regulatory demands on social commitment, the bank’s CSR initiatives go beyond the minimum regulatory requirements. Deutsche Bank fully endorses the Companies Act 2013 in India and the Black Economic Empowerment Act in South Africa. For over 25 years, the bank has consistently received an outstanding rating for its Community Reinvestment Act performance from the Federal Reserve Bank of New York. 120
Deutsche Bank Employees and corporate social responsibility Non-Financial Report 2022 Corporate social responsibility Key topics and impact in 2022 GRI 203-1, 413-1, FS16 Support for Ukraine Deutsche Bank made a € 1 million donation to support relief efforts in Ukraine and launched a global fundraising drive. Employees donated more than € 500,000, bringing the bank’s overall support to more than € 1.5 million. Donations went to Red Cross organizations and the International Medical Corps. In light of the paramount humanitarian needs of refugees from Ukraine, employees in Poland, Romania, Hungary, Germany and other countries organized and participated in local relief projects such as donation drives for essential goods. The bank also directed all funds from its German payroll giving scheme to wellcome gGmbH, a charity that helps Ukrainian mothers and their young children. Deutsche Bank Foundation supported the school start package initiative of the charity CARE Deutschland e.V. with € 350,000. The project enables schoolchildren who fled Ukraine to attend classes quickly. And Deutsche Bank joined forces with JobAidUkraine, a free-to-use website that encourages companies to post available jobs and matches them with Ukrainian refugees. Launch of environmental impact program How We Live In 2022, the global CSR strategy was aligned more closely with the bank’s ESG agenda by launching the How We Live program for environmental impact. Alongside the sustainable finance for clients and the steps the bank is taking to improve its own business, aim of the new program is to give employees the chance to get involved in protecting and restoring nature and providing education about their environment. In cooperation with local grassroots organizations, environmental groups, and charities, How We Live targets critical issues for nature and communities across the world. For example, in 2022, the bank launched a new partnership with The Nature Conservancy to support community conservation projects in Indonesia, Hong Kong, Mainland China and Australia, which aims to safeguard wildlife species and replenish shellfish reefs. In 2022, more than 2,800 employees were engaged in How We Live projects. For example, they volunteered in reforestation projects and planted over 108,000 trees in 2022 alone. On top of that, over 26,000 people and 64 schools were reached through environmental awareness initiatives or training. Promoting financial literacy Deutsche Bank’s CSR agenda further focused on the financial education of the next generation. In Germany, employees impart praxis-oriented financial knowledge to school students from grade 5 onwards. The project “So geht Geld” offers 90- minute teaching units on financial topics in schools and additional digital learning modules. To further raise the social impact, a clear goal was set in 2021 to have 700 colleagues by year end 2022 and for each of them to give at least one lesson on financial literacy per year. The bank exceeded this target. As of year end 2022, 1,056 employees in Germany registered. They visited 593 schools and held 1,072 workshops. The bank's financial education initiative helps address the results of a study conducted by the Association of German Banks (Bundesverband deutscher Banken, BdB) in 2021 which highlighted that more than three quarters of young people in Germany aged 14 to 24 do not feel well informed about economic issues. In addition, (*) promotes 12 financial literacy projects in Asia-Pacific, the United Kingdom, the the Born to Be youth engagement program United States, and Europe. Impact measurement and targets To ensure that resources are deployed efficiently and that projects are fully aligned with the CSR agenda’s strategic objectives, Deutsche Bank uses the Global Impact Tracking tool to monitor its investments’ direct impact and systematically gather feedback from community partners on an annual basis. The bank also measures its projects’ social return on investment according to the London Benchmarking Group methodology, with a focus on strategic community investments. The insights from these analyses have enabled the bank to improve its CSR strategy and portfolio over time. Deutsche Bank aims to further enhance the positive impact of its initiatives by prioritizing the CSR focus areas and encouraging employees to serve as corporate volunteers. Quantitative targets for each CSR focus area have been set: With its Born to Be youth engagement program, the bank aims to make a positive impact on the lives of seven million children and youngsters by 2025 (since 2014). For the Made for Good enterprise program, the bank has set itself the goal to reach a total of 45,000 enterprises by 2025 (since 2016). With the community initiatives, the bank plans to reach six million people by 2025 (since 2015). With regard to employee engagement, the goal is to keep the annual corporate volunteering rate at around 20 %, continuing the focus on skills-based volunteering. Deutsche Bank aims to maintain annual giving totals in matching and payroll giving programs at around € 10 million (employees and bank combined). In all areas, the bank is well under way to reaching its targets. The figures are also disclosed in the Appendix – ESG-related goals of this report. (*) CSR websites provide This report highlights some of Deutsche Bank’s CSR activities. The Deutsche Bank (*) and Postbank information about others. 121
Deutsche Bank Employees and corporate social responsibility Non-Financial Report 2022 Corporate social responsibility CSR key performance indicators 2022 2021 2020 Total investments, in € m. 55.1 52.1 51.7 Investments per area of activity (in %) Born to Be/Education 24 18 17 Made for Good/Enterprise 5 5 4 1 In the Community (incl. How We Live ) 30 33 36 Plus You/Corporate Volunteering 8 8 9 Art, Culture and Sports 33 36 34 Investments per region (in %) Germany 48 52 53 Americas 20 18 19 Asia/Pacific (incl. Japan) 20 16 15 UK 10 12 10 Europe/Middle East/Africa 2 2 3 2 Motivation of contribution (in % of projects) Community investments 49 51 46 Mandatory contributions (Community Reinvestment Act investments US, Companies Act India) 31 31 31 Charitable donations 16 16 21 Commercial sponsorships 4 2 2 3 External perception of Deutsche Bank as a responsible corporate citizen (global B2B market) / (in %) 52 64 67 People reached with initiatives in m. 3.3 3.2 3.7 1 CSR programs: Born to Be, Made for Good, In the Community (incl. How We Live ) 1.4 1.8 2.4 Art, Culture & Sports 1.9 1.4 1.3 Born to Be Born to Be projects supported by corporate volunteers (in %) 49 59 57 Cumulative Born to Be beneficiaries in m. (since 2014) 5.7 5.3 4.9 Made for Good Made for Good enterprise projects supported by corporate volunteers (in %) 34 26 33 Cumulative number of participating social enterprises (since 2016) 26,908 25,534 23,078 Cumulative number of Made for Good beneficiaries in m. (since 2016) 1.6 1.4 1.2 In the Community Community projects supported by corporate volunteers (in %) 33 37 36 1 Cumulative number of beneficiaries of community projects in m. (since 2015, incl. How We Live ) 5.4 4.9 4.2 4 Plus You - Volunteering and Giving Employees participating in the bank's volunteer programs 18,707 15,487 12,885 in % of total staff 22 18 17 Hours invested by corporate volunteers 187,232 133,535 157,863 Total employee donations and matching by Deutsche Bank, in € m. 8.4 7.4 8.8 1 For 2022 only 2 Source: Global Impact Tracking 2022 (68 % of total investments) 3 Representative global B2B survey in 14 countries; top-2-values on 5-point scale 4 2020 data excl. Postbank brand 122
Deutsche Bank Employees and corporate social responsibility Non-Financial Report 2022 Corporate social responsibility Alfred Herrhausen Gesellschaft GRI 203-1 The Alfred Herrhausen Gesellschaft (*), a Berlin-based nongovernmental organization (NGO) supported by Deutsche Bank, is committed to democracy, freedom and progress. In a world marked by disruption, the Alfred Herrhausen Gesellschaft thinks change and helps to shape it responsibly. In 2022, the Alfred Herrhausen Gesellschaft continued its dialog-oriented work and extended it with digital and hybrid discussion formats. Topics included the war in Ukraine and its impact, future scenarios for a digital Europe, and focuses on strengthening the democratic society. Asset Management GRI 203-1 Through its CSR engagement, Asset Management is committed to tackling climate change and addressing social inequalities. In 2022, DWS continued its partnership with the marine conversation organization Healthy Seas and made another donation. The organization tackles the ghost fishing phenomenon responsible for the needless death of marine animals. First focused on Europe where it is head-quartered, Healthy Seas is now able to broaden its scope and expand its salvage missions to Asia Pacific and the USA thanks to DWS’ support. To embrace a holistic approach, DWS employees in EMEA and the USA were given the opportunity to act as ambassadors for the organization to help them spread the word and raise more awareness about the negative impact on lost or abandoned fishing nets. As a further contribution to ocean conservation, since 2021 DWS has been supporting a multi-year World Wild Fund for Nature project along the Mesoamerican Reef near Belize. The goal of this initiative is to restore and protect the coral reef and mangroves ecosystems so that they continue to provide sustainable livelihoods for local coastal communities. During this time, important project milestones have been achieved including the development of a “Belize Mangrove Alliance” network and the creation of five coral gardens. Furthermore, staff from the authorities and local NGOs were trained to monitor the development and health of the corals. Employee volunteering participation rates increased from 9% in 2021 to 25% in 2022 partly because of the easing of COVID- 19 restrictions. Volunteering ranged from activities to protect and preserve the environment to providing support for social institutions. In terms of Ukraine aid, DWS also made two separate donations of € 250,000 and € 70,000 to provide both humanitarian aid and psychological support to the people of Ukraine. In addition, the bank also made donations to flood affected areas of Pakistan and those affected by the hunger crisis in the Horn of Africa. 123
Deutsche Bank Employees and corporate social responsibility Non-Financial Report 2022 Art, culture and sports Art, culture and sports – Longstanding partnerships with inspiring talents – 20 years of empowering talents: celebrating the anniversary of Berliner Philharmoniker’s educational program GRI 3-3, 203-1 Deutsche Bank’s commitment to art, culture and sports is an investment in the future of society. This commitment encompasses support for promising projects and talented individuals as well as efforts to broaden accessibility. Deutsche Bank’s Art & Culture policy defines the selection and approval process for art and culture projects group-wide. The purpose of the global art program is to make art accessible. For more than 40 years, Deutsche Bank has enabled its employees, clients, and the general public to experience contemporary art by showing works from the collection at more than 600 Deutsche Bank offices and branches, the PalaisPopulaire (which is explained below), and exhibitions worldwide and by conducting educational programs. LuYang was the first Chinese artist awarded “Artist of the Year”. Deutsche Bank also partners with museums, art fairs, and other institutions to reward and encourage emerging artists. Similarly, Deutsche Bank has been the Global Lead Partner of Frieze Art Fair for 19 years. In 2022 it took place in Seoul for the first time. The Frieze x Deutsche Bank Emerging Curators Fellowship continued in 2022. It supports the professional development of emerging Black and People of Color curators in Britain with funding a curator at the V&A East. Similarly, the Deutsche Bank Frieze Los Angeles Film Award, which supports aspiring filmmakers was conferred for the third time in 2022. PalaisPopulaire in Berlin is Deutsche Bank’s innovative, interdisciplinary forum for art and culture. It hosts exhibitions in partnership with institutions around the world and displays artworks from the Deutsche Bank Collection. PalaisPopulaire also hosts concerts, lectures, readings, and other cultural events, bringing together the public, clients, and employees to celebrate culture. Its broad range of educational programs for children and adults and special barrier-free offerings for blind, deaf, and visually and hearing-impaired visitors ensures that no one is left out. The digital platform #PalaisPopulaireForYou can reach an even wider audience and reflects the bank’s commitment to accessibility. Support for culture is an essential aspect of Deutsche Bank’s commitment to society. A highlight of this is the bank’s more th anniversary than 30-year partnership with the Berliner Philharmoniker. The orchestra’s education program celebrated its 20 in 2022, during which time it has introduced more than 200,000 people of all ages to classical music. To mark this anniversary, the bank handed over a mobile stage to the Berliner Philharmoniker that the orchestra can use to visit people interested in music where they are. Deutsche Bank also supports aspiring musicians through partnerships with the Junge Deutsche Philharmonie (which trains music students for careers as orchestral players) and the Schloss Belvedere Music Academy (a high school for musically gifted young people). Another partnership links the bank with the English Theatre Frankfurt, the largest English-language stage on the European continent. To commemorate the Holocaust, Deutsche Bank took part in the “Show Light/Licht zeigen” initiative on January 27, 2022, thus setting an example against antisemitism and racism. The action was organized by the friends of Yad Vashem, whom Deutsche Bank supports as well. Sport brings together people from diverse backgrounds, fosters fairness, mutual respect, and inspires athletes towards great achievements. Deutsche Bank has therefore supported competitive sports for decades. One example is the more than 20- year sponsorship of the German Sports Aid Foundation. A cornerstone of the partnership is the “Deutsche Bank Sports Scholarship”, which has been given since 2012 and is supporting up to 300 student athletes enabling them to combine competitive sports with a professional career. Thereby athletes can concentrate on the essentials and achieve their respective goals. In addition, Deutsche Bank annually awards the “Sports Scholarship Holder of the Year” for particularly outstanding achievements in sports and studies. For winners, Deutsche Bank doubles the current sports scholarship for one and a half years. The four other finalists receive additional funding of 50% of the current scholarship for the same period. Moreover, Eintracht Frankfurt’s home ground and the surrounding area was renamed “Deutsche Bank Park” in mid-2020. The spirit of the bank’s partnership with the club goes far beyond football. In fact, it is a collaboration focused on shaping the stadium for the future; it is about working together to modernize Deutsche Bank Park and its surroundings, to accelerate digitalization and drive branding initiatives. One example of the bank’s partnership with Eintracht Frankfurt is the joint initiative of a fitness trail, with exercise equipment placed at different spots within the Deutsche Bank grounds. The stadium has also played host to “Block im Park”, a conference on blockchain. 124
Appendix 126 Reports of the independent auditor 131 ESG-related goals 132 GRI Content Index and UN Global Compact 148 Sustainability Accounting Standards Board (SASB) Index 151 Recommendations of the Task Force on Climate-related Financial Disclosures (TCFD) 153 Principles for Responsible Banking 172 Imprint/Publications
Deutsche Bank Appendix Non-Financial Report 2022 Reports of the independent auditor Reports of the independent auditor The assurance engagement performed by Ernst & Young (EY) relates exclusively to the German version of the “Non-Financial Statement 2022” of Deutsche Bank Aktiengesellschaft, Frankfurt am Main. The following text is a translation of the original German independent assurance report. Independent auditor’s report on a limited assurance engagement To Deutsche Bank Aktiengesellschaft, Frankfurt am Main We have performed a limited assurance engagement on the non-financial statement of Deutsche Bank Aktiengesellschaft, Frankfurt am Main (thereinafter referred to as the “Company”), included in the non-financial report, which is combined with the non-financial statement of the Group and whose disclosures are marked by a line in the margin in the non-financial reporting and which additionally comprises the chapters “Operating and financial review – Deutsche Bank Group” in the combined management report of the Company incorporated by reference and the note “Country-by-Country” reporting in the notes to the consolidated financial statements for fiscal year 2022 for the period from 1 January 2022 to 31 December 2022 incorporated by reference (hereinafter referred to as the “non-financial statement”). Our engagement did not include any disclosures for prior years and any references to further information outside of the non- financial statement. Responsibilities of the executive directors The executive directors of the Company are responsible for the preparation of the non-financial statement in accordance with Section 340a (1a) in conjunction with Section 289c to 289e HGB and Section 340i (5) HGB in conjunction with Section 315c HGB [“Handelsgesetzbuch”: German Commercial Code] and Article 8 of Regulation (EU) 2020/852 of the European Parliament and of the Council of 18 June 2020 on the establishment of a framework to facilitate sustainable investment and amending Regulation (EU) 2019/2088 (thereinafter the “EU Taxonomy Regulation”) and the Delegated Acts adopted thereunder as well as in accordance with their own interpretation of the wording and terms contained in the EU Taxonomy Regulation and the Delegated Acts adopted thereunder as set out in section “Sustainable Finance” of the non-financial statement. These responsibilities of the Company’s executive directors include the selection and application of appropriate non-financial reporting methods and making assumptions and estimates about individual non-financial disclosures of the Group that are reasonable in the circumstances. Furthermore, the executive directors are responsible for such internal control as the executive directors consider necessary to enable the preparation of a non-financial statement that is free from material misstatement, whether due to fraud (manipulation of the non-financial statement) or error. The EU Taxonomy Regulation and the Delegated Acts adopted thereunder contain wording and terms that are still subject to considerable interpretation uncertainties and for which clarifications have not yet been published in every case. Therefore, the executive directors have disclosed their interpretation of the EU Taxonomy Regulation and the Delegated Acts adopted thereunder in section “Sustainable Finance” of the non-financial statement. They are responsible for the defensibility of this interpretation. Due to the immanent risk that undefined legal terms may be interpreted differently, the legal conformity of the interpretation is subject to uncertainties. Independence and quality assurance of the auditor’s firm We have complied with the German professional requirements as well as other professional conduct requirements. Our audit firm applies the national legal requirements and professional pronouncements, in particular the BS WP/vBP (“Berufssatzung für Wirtschaftsprüfer/vereidigte Buchprüfer”: Professional Charter for German Public Accountants/German Sworn Auditors) in the exercise of their profession and the IDW Standard on Quality Management in the Audit Firm (IDW QS 1) and accordingly maintains a comprehensive quality management system that includes documented policies and procedures with regard to compliance with professional ethical requirements, professional standards as well as relevant statutory and other legal requirements.. Responsibilities of the auditor Our responsibility is to express a conclusion with limited assurance on the non-financial statement based on our assurance engagement. 126
Deutsche Bank Appendix Non-Financial Report 2022 Reports of the independent auditor We conducted our assurance engagement in accordance with International Standard on Assurance Engagements (ISAE) 3000 (Revised): “Assurance Engagements other than Audits or Reviews of Historical Financial Information” issued by the IAASB. This standard requires that we plan and perform the assurance engagement to obtain limited assurance about whether any matters have come to our attention that cause us to believe that the Company’s non-financial statement is not prepared, in all material respects, in accordance with Section 340a (1a) in conjunction with Sections 289c to 289e HGB and Section 340i (5) HGB in conjunction with Section 315c HGB and Article 8 EU Taxonomy Regulation and the Delegated Acts adopted thereunder as well as the interpretation by the executive directors disclosed in section “Sustainable Finance” of the non- financial statement. Not subject to our assurance engagement are other references to disclosures made outside the non- financial statement, prior-year disclosures as well as the external sources of documentation or expert opinions mentioned in the non-financial statement. In a limited assurance engagement, the procedures performed are less extensive than in a reasonable assurance engagement, and accordingly, a substantially lower level of assurance is obtained. The selection of the assurance procedures is subject to the professional judgment of the auditor. In the course of our assurance engagement we have, among other things, performed the following assurance procedures and other activities: – Gain an understanding of the structure of the Group’s sustainability organization and how to stakeholder engagement, – Inquiries of the executive directors and relevant employees involved in the preparation of the non-financial statement about the preparation process, about the internal control system related to this process, and about disclosures in the non-financial statement, – Inquiries of the employees regarding the selection of topics for the non-financial statement, the risk assessment and the policies of the Company and the Group for the topics identified as material, – Inquiries of employees responsible for data capture and consolidation about the data capture and compilation methods as well as internal controls to the extent relevant for the assurance of the disclosures in the non-financial statement, – Identification of likely risks of material misstatement in the non-financial statement, – Inspection of the relevant documentation of the systems and processes for collecting, aggregating and validating the data from the relevant functions in the reporting period, – Analytical procedures on selected disclosures in the non-financial statement at the level of the Company and the Group, – Evaluation of the process to identify the economic activities taxonomy-eligible as well as the corresponding disclosures in the non-financial statement, and – Evaluation of the presentation of the non-financial statement. In determining the disclosures in accordance with Article 8 EU Taxonomy Regulation, the executive directors are required to interpret undefined legal terms. Due to the immanent risk that undefined legal terms may be interpreted differently, the legal conformity of their interpretation and, accordingly, our assurance engagement thereon are subject to uncertainties. Assurance conclusion Based on the assurance procedures performed and the evidence obtained, nothing has come to our attention that causes us to believe that the non-financial statement of the Company for the period from 1 January 2022 to 31 December 2022 is not prepared, in all material respects, in accordance with Section 340a (1a) in conjunction with Sections 289c to 289e HGB and Section 340i (5) HGB in conjunction with Section 315c HGB and Article 8 of EU Taxonomy Regulation and the Delegated Acts adopted thereunder as well as the interpretation by the executive directors as disclosed in section “Sustainable Finance”. We do not express an assurance conclusion on the other references to disclosures made outside the non-financial statement, prior-year disclosures or the external sources of documentation or expert opinions mentioned in the non-financial. Restriction of use We draw attention to the fact that the assurance engagement was conducted for the Company’s purposes and that the report is intended solely to inform the Company about the results of the assurance engagement. As a result, it may not be suitable for another purpose than the aforementioned. Accordingly, the report is not intended to be used by third parties for making (financial) decisions based on it. Our responsibility is to the Company alone. We do not accept any responsibility to third parties. Our assurance conclusion is not modified in this respect. 127
Deutsche Bank Appendix Non-Financial Report 2022 Reports of the independent auditor General Engagement Terms and Liability The “General Engagement Terms for Wirtschaftsprüfer and Wirtschaftsprüfungsgesellschaften [German Public Auditors and Public Audit Firms]” dated 1 January 2017 are applicable to this engagement and also govern our relations with third parties in the context of this engagement (www.de.ey.com/general-engagement-terms). In addition, please refer to the liability provisions contained therein no. 9 and to the exclusion of liability towards third parties. We accept no responsibility, liability or other obligations towards third parties unless we have concluded a written agreement to the contrary with the respective third party or liability cannot effectively be precluded. We make express reference to the fact that we will not update the assurance report to reflect events or circumstances arising after it was issued, unless required to do so by law. It is the sole responsibility of anyone taking note of the summarized result of our work contained in this report to decide whether and in what way this information is useful or suitable for their purposes and to supplement, verify or update it by means of their own review procedures. Eschborn/Frankfurt am Main, March 13, 2023 Ernst & Young GmbH Wirtschaftsprüfungsgesellschaft Holger Lösken Yvonne Meyer Wirtschaftsprüfer Wirtschaftsprüferin (German Public Auditor) (German Public Auditor) 128
Deutsche Bank Appendix Non-Financial Report 2022 Reports of the independent auditor The assurance engagement performed by Ernst & Young (EY) relates exclusively to the German version of the sustainability report of the fiscal year 2022 of Deutsche Bank Aktiengesellschaft, Frankfurt am Main. The following text is a translation of the original German independent auditor’s report. Independent auditor’s report on a limited assurance engagement To Deutsche Bank Aktiengesellschaft, Frankfurt am Main We have performed a limited assurance engagement on the sustainability report of Deutsche Bank Aktiengesellschaft, Frankfurt am Main (thereinafter referred to as the “Company”), which additionally comprises the chapters “Operating and financial review – Deutsche Bank Group” in the combined management report of the Company incorporated by reference and the note “Country-by-Country Reporting” in the notes to the consolidated financial statements of the Company for fiscal year 2022 for the reporting period from 1 January 2022 to 31 December 2022 incorporated by reference (thereinafter referred to as the “sustainability report”). Our engagement did not include any disclosures for prior years and any references to further information outside of the sustainability report. Responsibilities of the executive directors The executive directors of the Company are responsible for the preparation of the sustainability report in accordance with the “GRI Sustainability Reporting Standards” (hereafter “GRI Standards”). These responsibilities of the Company’s executive directors include the selection and application of appropriate methods to prepare the sustainability report and making assumptions and estimates about individual disclosures of the Group that are reasonable in the circumstances. Furthermore, the executive directors are responsible for such internal control as the executive directors consider necessary to enable the preparation of a sustainability report that is free from material misstatement, whether due to fraud (manipulation of the sustainability report) or error. Independence and quality assurance of the auditor’s firm We have complied with the German professional requirements on independence as well as other professional conduct requirements. Our audit firm applies the national legal requirements and professional pronouncements, in particular the BS WP/vBP (“Berufssatzung für Wirtschaftsprüfer/vereidigte Buchprüfer”: Professional Charter for German Public Accountants/German Sworn Auditors) and the IDW Standard on Quality Management in the Audit Firm (IDW QS 1) and accordingly maintains a comprehensive quality management system that includes documented policies and procedures with regard to compliance with professional ethical requirements, professional standards as well as relevant statutory and other legal requirements. Responsibilities of the auditor Our responsibility is to express a conclusion with limited assurance on the sustainability report based on our assurance engagement. We conducted our assurance engagement in accordance with International Standard on Assurance Engagements (ISAE) 3000 (Revised): “Assurance Engagements other than Audits or Reviews of Historical Financial Information“ issued by the IAASB. This standard requires that we plan and perform the assurance engagement to obtain limited assurance about whether the sustainability report of the Company has been prepared, in all material respects, in accordance with the GRI Standards. Not subject to our assurance engagement are other references to disclosures made outside the sustainability report, prior- year disclosures as well as the external sources of documentation or expert opinions mentioned in the sustainability report. In a limited assurance engagement, the scope procedures performed are less extensive than in a reasonable assurance engagement, and accordingly, a substantially lower level of assurance is obtained. The selection of the assurance procedures is subject to the professional judgment of the auditor. In the course of our assurance engagement we have, among other things, performed the following assurance procedures and other activities: – Gain an understanding of the structure of the Group’s sustainability organization and how to stakeholder engagement, 129
Deutsche Bank Appendix Non-Financial Report 2022 Reports of the independent auditor – Inquiries of the executive directors and relevant employees involved in the preparation of the non-financial report about the preparation process, about the internal control system related to this process, and about disclosures in the non-financial report, – Inquiries of the employees regarding the selection of topics for the sustainability report, the risk assessment and the policies of the Company and the Group for the topics identified as material, – Inquiries of employees responsible for data capture and consolidation about the data capture and compilation methods as well as internal controls to the extent relevant for the assurance of the disclosures in the sustainability report, – Identification of likely risks of material misstatement in the sustainability report, – Inspection of the relevant documentation of the systems and processes for collecting, aggregating and validating the data from the relevant functions in the reporting period, – Analytical procedures on selected disclosures in the sustainability report at the level of the Company and the Group and – Evaluation of the presentation of the sustainability report. Assurance conclusion Based on the assurance procedures performed and the evidence obtained, nothing has come to our attention that causes us to believe that the sustainability report of the Company for the period from 1 January 2022 to 31 December 2022 is not prepared, in all material respects, in accordance with the GRI Standards. We do not express an assurance conclusion on the other references to disclosures made outside the sustainability report and prior year-disclosures. Restriction of use We draw attention to the fact that the assurance engagement was conducted for the Company’s purposes and that the report is intended solely to inform the Company about the result of the assurance engagement. As a result, it may not be suitable for another purpose than the aforementioned. Accordingly, the report is not intended to be used by third parties for making (financial) decisions based on it. Our responsibility is to the Company alone. We do not accept any responsibility to third parties. Our assurance conclusion is not modified in this respect. General Engagement Terms and Liability The “General Engagement Terms for Wirtschaftsprüfer and Wirtschaftsprüfungsgesellschaften [German Public Auditors and Public Audit Firms]” dated 1 January 2017 are applicable to this engagement and also govern our relations with third parties in the context of this engagement (www.de.ey.com/general-engagement-terms). In addition, please refer to the liability provisions contained therein no. 9 and to the exclusion of liability towards third parties. We accept no responsibility, liability or other obligations towards third parties unless we have concluded a written agreement to the contrary with the respective third party or liability cannot effectively be precluded. We make express reference to the fact that we will not update the report to reflect events or circumstances arising after it was issued, unless required to do so by law. It is the sole responsibility of anyone taking note of the summarized result of our work contained in this report to decide whether and in what way this information is useful or suitable for their purposes and to supplement, verify or update it by means of their own review procedures. Eschborn/Frankfurt am Main, March 13, 2023 Ernst & Young GmbH Wirtschaftsprüfungsgesellschaft Holger Lösken Yvonne Meyer Wirtschaftsprüfer Wirtschaftsprüferin (German Public Auditor) (German Public Auditor) 130
Deutsche Bank Appendix Non-Financial Report 2022 ESG-related goals ESG-related goals Deutsche Bank is committed to setting goals for managing ESG topics and monitoring progress toward them. The following table summarizes the bank’s progress toward its ESG-related goals. Chapter Aspects Goal Target Date Progress 2022 Sustainable finance Financing € 200+ bn 2022 Exceeding the € 200 billion target in sustainable financing and (accelerated from and investments between 2020 and year end 2022 with a investments 2025) cumulative total of € 215 billion. Environmental and Fossil fuels Review portfolio in oil, gas, and 2022 Completed for oil and gas globally and coal power in social due diligence coal power sector Europe and the US in 2021. Preparation for the portfolio review of coal clients in the Asia-Pacific region started in 2022. Exit financing and capital market 2025 Exposure to thermal coal mining declined to € 231 mn at transactions in thermal coal year end 2022. mining in scope of the coal policy Climate risk Reporting Broaden on disclosure following Ongoing Added to the climate risk chapter of the Non-Financial TCFD recommendations Report: - a "climate risks and opportunities section" with a description of the risks idenified by the organization; - a section on the materiality assessment of climate and environmental risk drivers - a section on decarbonization targets Portfolio Disclose carbon intensity and 2022 Complete in 2021, and included as a recurring item in the alignment financed emissions of lending climate risk chapter of the 2022 Non-Financial Report portfolios Disclose targets and pathways for 2023 Deutsche Bank announced in October 2022 net zero the alignment of Deutsche Bank's aligned decarbonization (2030 and 2050) targets for four portfolios to the objectives of the priority carbon intensive sectors: Oil and Gas (upstream), Paris Agreement and Net Zero Power Generation, Automotive (light duty vehicles) and commitments Steel. Pathways to achieve these targets are disclosed in the Climate Risk chapter of this report, together with year end alignment / deviation of the relevant portfolios. Employment and Gender 20 % female Management Board June 2022 20.0 % employability diversity members 30 % women at first management 2025 17.1 % level below the Management Board 30 % women at second 2025 29.6 % management level below the Management Board 35 % female Managing Directors, 2025 30.7 % Directors, Vice Presidents In-house ecology Energy Compensate for emissions of own Ongoing Maintained consumption operations (Scope 1 and 2) and and business travel efficiency 85 % renewable electricity 2022 95.7 % 20 % reduction of total energy 2025 28 % consumption compared to 2019 Corporate Social CSR Annual corporate volunteering Ongoing 22 % Responsibility programs rate at around 20% Annual giving totals in matching Ongoing € 8.4 million and payroll giving programs at around € 10 million Born to be youth engagement 2025 5.7 million program: Support 7 million young people (since 2014) In the community: Reach 6 million 2025 5.4 million people (since 2015) Made for Good enterprise 2025 26,908 enterprises program: Support 45,000 enterprises (since 2016) 131
Deutsche Bank Appendix Non-Financial Report 2022 GRI Content Index and UN Global Compact GRI Content Index and UN Global Compact GRI 1 Foundation in 2021 Deutsche Bank’s Non-Financial Report provides a comprehensive disclosure of the material topics for its non-financial performance. Information on financial data are available in Deutsche Bank’s Annual Report 2022. Disclosures included in the report were selected based on a materiality analysis conducted in 2022. In order to give a better overview for the Non-Financial Report 2022, Deutsche Bank has reported in accordance with the GRI standards for the period January 1, 2022, to December 31, 2022, including the specific Sector Disclosures for the financial service sector. Information can either be found in the Non-Financial Report, via links to other Reports (e.g., Annual Report [AR] or Human Capital Report [HCR], or directly in this table. The information outside the Non-Financial Report, for instance information in the 2022 Human Capital Report, is not part of the external limited assurance. Furthermore, the Non-Financial Report also serves as the bank’s Communication on Progress for the UN Global Compact (UNGC), references are made in the index as well. By participating in the UNGC, the bank is committed to preserving internationally recognized human rights, creating socially acceptable working conditions, protecting the environment, and fighting corruption. SDG and GRI Standards and Disclosures Non-Financial Report and/or Link to Source Remarks/Omissions UNGC Reference GRI 2: General Disclosures 2021 The organization and its reporting practices 2-1 Organizational details AR – Consolidated Financial Statements – Deutsche Bank Aktiengesellschaft, Additional Notes – Note 43 “Country by country Frankfurt/Main, Germany reporting" About Deutsche Bank 2-2 Entities included in the organization’s AR – Consolidated Financial Statements – sustainability reporting Additional Notes – Note 37 “Information on Subsidiaries” AR – Consolidated Financial Statements – Additional Notes – Note 38 “Structured Entities” AR – Consolidated Financial Statements – Additional Notes – Note 44 “Shareholdings” – Subsidiaries AR – Consolidated Financial Statements – Additional Notes – Note 44 “Shareholdings” – Consolidated Structured Entities 2-3 Reporting period, frequency and contact point About this report Publication date: March 17, 2023 Imprint/Publications 2-4 Restatements of information In-house ecology – Targets and measures – Offsetting residual CO emissions 2 In-house ecology – Key topics 2022 – Energy and renewable electricity In-house ecology – Greenhouse gas emissions 2-5 External assurance Reports of the independent auditor The information contained in this report is subject to additional external assurance. Information presented in the PRB Index as well as the additional Human Capital Report are not part of the external assurance. Activities and workers 2-6 Activities, value chain and other business AR – Deutsche Bank Group – Strategy relationships AR – Combined Management Report – Operating and Financial Review – Deutsche Bank Group AR – Consolidated Financial Statements – Notes to the consolidated financial statements – Note 3 “Acquisitions and dispositions” AR – Consolidated Financial Statements – Additional Notes – Note 43 “Country by country reporting” Human rights – Key topics in 2022 – Supply chain Employment and employability - Workforce management - Workforce development 2-7 Employees AR – Combined Management Report – Information incomplete/unavailable. The SDG 8 Employees break-down by gender and by region for UNGC 6 part-time employees and non-guaranteed 132
Deutsche Bank Appendix Non-Financial Report 2022 GRI Content Index and UN Global Compact SDG and GRI Standards and Disclosures Non-Financial Report and/or Link to Source Remarks/Omissions UNGC Reference Employment and employability – Workforce hours employees (employees who are management – Workforce development employed by DB without a guarantee of a minimum or fixed number of working hours) are not reported. 2-8 Workers who are not employees AR – Combined Management Report – Information incomplete/unavailable. The SDG 8 Employees total number of workers who are not UNGC 6 Employment and employability – Workforce employees and whose work is controlled management – Workforce development by Deutsche Bank (e.g., contract workers) are not reported. Governance 2-9 Governance structure and composition AR – Deutsche Bank Group – Management https://investor- SDG 5 Board relations.db.com/corporate- AR – Deutsche Bank Group – Report of the governance/organizational- Supervisory Board structure/committees-of-the-supervisory- AR – Deutsche Bank Group – Supervisory board?language_id=1 Board AR – Combined Management Report – Corporate Governance Statement AR – Corporate Governance Statement – Management Board and Supervisory Board Sustainability strategy and Implementation – Sustainability governance Sustainable finance – Governance Sustainable finance – Asset Management – Overview Climate risk – Climate risk in Asset Management – Governance Environmental and social due diligence - Governance Corporate governance Culture, integrity, and conduct – Culture, integrity, and conduct program – Purpose and governance Anti-financial crime – Governance 2-10 Nominating and selecting the highest AR – Deutsche Bank Group – Report of the SDG 5 governance body Supervisory Board AR – Combined Management Report – Corporate Governance Statement AR – Corporate Governance Statement – Management Board and Supervisory Board – Supervisory Board Corporate governance 2-11 Chair of the highest governance body AR – Deutsche Bank Group – Report of the Supervisory Board AR – Deutsche Bank Group –Supervisory Board AR – Combined Management Report – Corporate Governance Statement AR – Corporate Governance Statement – Management Board and Supervisory Board – Supervisory Board Corporate governance 2-12 Role of highest governance body in overseeing AR – Deutsche Bank Group – Report of the https://investor- impact management Supervisory Board relations.db.com/corporate- Materiality assessment governance/organizational- Sustainability strategy and implementation – structure/committees-of-the-supervisory- Sustainability governance board?language_id=1 Sustainable finance – Training and awareness Environmental and social due diligence – Each business division and infrastructure Governance function hold responsibility to inform their Human rights – Governance senior management about the results of a Corporate governance stakeholder dialog though Deutsche Stakeholder engagement and thought Bank’s established governance structures, leadership if such information is applicable. Culture, integrity, and conduct – Culture, integrity, and conduct program – Purpose and governance Public policy and regulation – Employee - stakeholder interaction Anti-financial crime – Vision and mission Anti-financial crime – Governance Information security – Security strategy, framework and governance Employment and employability – Governance 133
Deutsche Bank Appendix Non-Financial Report 2022 GRI Content Index and UN Global Compact SDG and GRI Standards and Disclosures Non-Financial Report and/or Link to Source Remarks/Omissions UNGC Reference 2-13 Delegation of responsibility for managing Sustainability strategy and implementation – impacts Sustainability governance Climate risk – Governance Climate risk – Climate risk in Asset Management – Governance Climate risk – Climate risk in Asset Management – Risk management strategy and processes Environmental and social due diligence – Governance Human rights – Governance In-house ecology - Governance Corporate governance Culture, integrity, and conduct – Culture, integrity, and conduct program – Purpose and governance Public policy and regulation – Governance Anti-financial crime – Governance Data protection – Governance Digitization and innovation – Governance Information security – Security strategy, framework, and governance Employment and employability – Governance 2-14 Role of the highest governance body in AR – Deutsche Bank Group – Report of the The ESG Metrics & Disclosures Steering sustainability reporting Supervisory Board – Annual Financial Group has reviewed the content of the Statements, Consolidated Financial report. In the CFO Sign-off meeting Statements, and the combined separate Non- chaired by the CFO the content of the Financial Report and Compensation Report report was pre-approved. The final responsibility for authorizing the report for publication lies with the Management Board. The Supervisory Board reviews the content of the Non-Financial Report. 2-15 Conflicts of interest AR – Deutsche Bank Group – Report of the Information incomplete/unavailable. Supervisory Board – Conflicts of interest and Whether conflicts of interest are disclosed their handling to stakeholders, including cross-board AR – Combined Management Report – memberships and cross-shareholding with Corporate Governance Statement suppliers and other stakeholders are not AR – Corporate Governance Statement – reported. Management Board and Supervisory Board – Supervisory Board AR – Consolidated Financial Statements – Additional Notes – Note 36 “Related party transactions” Product responsibility – Conflicts of interest 2-16 Communication of critical concerns Human rights – Governance Information incomplete/unavailable. Culture, integrity and conduct The total number and nature of critical concerns communicated to the highest governance body in 2022 is not reported. 2-17 Collective knowledge of the highest governance AR – Deutsche Bank Group – Report of the body Supervisory Board – Training and further education measures AR – Combined Management Report – Corporate Governance Statement AR – Corporate Governance Statement – Management Board and Supervisory Board – Supervisory Board Sustainability strategy and implementation – Sustainability governance Corporate governance 2-18 Evaluation of the performance of the highest AR – Deutsche Bank Group – Report of the governance body Supervisory Board AR – Combined Management Report – Corporate Governance Statement AR – Corporate Governance Statement – Management Board and Supervisory Board – Supervisory Board Corporate governance Employment and employability – Workforce management – Recruiting and talent development – Employee feedback culture 2-19 Remuneration policies AR – Compensation report Corporate governance 134
Deutsche Bank Appendix Non-Financial Report 2022 GRI Content Index and UN Global Compact SDG and GRI Standards and Disclosures Non-Financial Report and/or Link to Source Remarks/Omissions UNGC Reference 2-20 Process to determine remuneration AR – Compensation report https://hauptversammlung.db.com/files/do Corporate governance cuments/2022/AGM_2022_Voting_results. pdf 2-21 Annual total compensation ratio AR – Compensation report Not reported in detail due to confidentiality restraints. Strategy, policies and practices 2-22 Statement on sustainable development strategy AR – Deutsche Bank Group – Letter from the Chief Executive Officer 2-23 Policy commitments AR – Combined Management Report – Risk https://investor- UNGC 10 Report relations.db.com/files/documents/docume Sustainable finance – Governance nts/code_of_business_conduct_and_ethic Sustainable finance – Private Bank – s_for_deutsche_bank_group.pdf?languag International Private Bank – Overview e_id=1&kid=code-of-conduct.redirect- Sustainable finance – Asset Management – en.shortcut Overview Climate risk – Climate risk in Asset Management – DWS approach to Net Zero Environmental and social due diligence – Governance Environmental and social due diligence – Environmental and social policy framework Environmental and social due diligence – Equator principles Human rights Human rights – Key topics in 2022 – Clients Culture, integrity, and conduct Culture, integrity, and conduct – Culture, integrity, and conduct program – Purpose and governance Public policy and regulation – Employee- stakeholder interaction Public policy - Group policy does not permit donations to political parties Anti-financial crime – Vision and mission Anti-financial crime – Risk exposure and controls Data protection – Governance Product responsibility Product responsibility – Product design and advisory principles Product responsibility – Selling practices and marketing Client satisfaction Digitization and innovation – Governance Information security – Security strategy, framework, and governance Information security – Security measures – Fostering a security culture Employment and employability – Governance Employment and employability – Workforce management – Recruiting and talent development – Employee feedback culture Corporate social responsibility - Governance 2-24 Embedding policy commitments Sustainable finance – Governance The information on these disclosures can Sustainable finance – Training and awareness be found in multiple chapters throughout Environmental and social due diligence – the report. Governance Environmental and social due diligence – Environmental and social policy framework Environmental and social due diligence – Environmental and social policy framework - Training and awareness Environmental and social due diligence – Equator principles Human rights Human rights – Key topics in 2022 – Clients Culture, integrity, and conduct – Culture, integrity, and conduct program – Purpose and governance Anti-financial crime – Vision and mission Anti-financial crime – Governance Anti-financial crime – Risk exposure and controls 135
Deutsche Bank Appendix Non-Financial Report 2022 GRI Content Index and UN Global Compact SDG and GRI Standards and Disclosures Non-Financial Report and/or Link to Source Remarks/Omissions UNGC Reference Anti-financial crime – Targets and measures Data protection – Governance Data protection – Training and awareness Client satisfaction Digitization and innovation – Governance Information security – Security strategy, framework, and governance Employment and employability – Governance 2-25 Processes to remediate negative impacts Climate risk – Governance Information unavailable/incomplete. The Environmental and social due diligence – information on these disclosures can be Governance found in multiple chapters throughout the Environmental and social due diligence – report, but not all grievance mechanisms Environmental and social policy framework and methods to track their effectiveness Environmental and social due diligence – are reported. Equator principles Human rights Human rights – Governance Human rights – Key topics in 2022 – Clients Human rights – Key topics in 2022 – Supply chain In-house ecology – Key topics in 2022 – Energy efficiency and conservation In-house ecology – Key topics in 2022 – Energy and renewable electricity In-house ecology – Key topics in 2022 – Paper consumption, waste and water Anti-financial crime – Risk exposure and controls Data protection – Governance Product responsibility Product responsibility – Selling practices and marketing Client satisfaction – Complaint management Digitization and innovation – Governance Information security – Security strategy, framework and governance Employment and employability Employment and employability – Governance Employment and employability - Workforce management - Workforce develoment Employment and employability – Workforce management – Recruiting and talent development Employment and employability - Workforce management - Future of Work Employment and employability – Diversity, equality, and inclusion Employment and employability – Diversity, equality, and inclusion – Gender diversity Employment and employability - Diversity, equality and inclusion - An inclusive work environment 2-26 Mechanisms for seeking advice and raising Human rights – Governance The information on these disclosures can UNGC 10 concerns Culture, integrity, and conduct be found in multiple chapters throughout Culture, integrity, and conduct – Culture, the report. integrity, and conduct program – Key topics and initiatives in 2022 Anti-financial crime – Risk exposure and controls Anti-financial crime –Targets and measures Client satisfaction – Complaint management Governance 2-27 Compliance with laws and regulations AR – Consolidated Financial Statements – Not reported in detail due to confidentiality Notes to the consolidated balance sheet – Note restraints. If any significant incidents of 27 “Provisions” non-compliance occurred, these would be Environmental and social due diligence – reported in Note 27 “Provisions” of the Environmental and social policy framework Annual Report along with associated fines and monetary sanctions 2-28 Membership associations Stakeholder engagement and thought https://www.db.com/files/documents/csr/su leadership – Memberships and commitments stainability/Selected-Memberships.pdf Public policy and regulation – Memberships in trade associations Digitization and innovation 136
Deutsche Bank Appendix Non-Financial Report 2022 GRI Content Index and UN Global Compact SDG and GRI Standards and Disclosures Non-Financial Report and/or Link to Source Remarks/Omissions UNGC Reference Stakeholder engagement 2-29 Approach to stakeholder engagement Sustainable finance – Training and awareness Information incomplete/unavailable. Human rights Deutsche Bank does not explicitly report Human rights – Key topics in 2022 – Clients on the identification of stakeholders. Stakeholder Engagement and thought However, as a listed company, bank and leadership financial services provider, its business Client satisfaction model is particularly geared towards Client satisfaction – Complaint management clients, shareholders, employees, Employment and employability – Workforce regulators, and civil society. management – Recruiting and talent development – Employee feedback culture 2-30 Collective bargaining agreements AR – Combined Management Report – Information incomplete/unavailable. The SDG 8 Employees percentage of total employees covered by UNGC 3 Employment and employability – Workforce collective bargaining agreements is not management – Workforce development reported; Deutsche Bank works with works councils that represent employees’ interests in negotiations with Deutsche Bank as employer, but details remain confidential. Material topics 3-1 Process to determine material topics Materiality assessment The boundary internal and external (client, Materiality assessment - Material non-financial shareholders, society) applies for: Anti- topics 2022 Financial Crime, Culture, integrity, and conduct, Climate risk, Digitization and innovation, ES due diligence, Information security, In-house ecology, Public policy and regulation, Sustainable finance, and Tax. The boundary internal and external (client, society) applies for: Data protection, Product responsibility, Corporate social responsibility. The boundary internal applies for: Employment and employability. The boundary external (client, society) applies for: Human rights. 3-2 List of material topics Materiality assessment - Material non-financial topics 2022 SDG and GRI Standards and Disclosures Non-Financial Report and/or Link to Source Remarks/Omissions UNGC Reference Topic specific standard disclosures GRI 200 Economy GRI 201: Economic performance 2021 3-3 Management of material topics Materiality assessment SDG 8 Sustainable finance – Governance Sustainable finance – Training and awareness Climate risk – Governance Climate risk – Risk management strategy – Climate risks and opportunities Climate risk – Risk management framework Climate Risk - Risk management framework - Engagement in climate-related initiatives Climate risk – Climate risk in Asset Management Climate risk – Climate risk in Asset Management - Governance Climate risk – Climate risk in Asset Management – Risk management strategy and processes Climate risk - Climate Risk in Asset Management - DWS approach to Net Zero Environmental and social due diligence Environmental and social due diligence – Governance Environmental and social due diligence – Environmental and social policy framework Environmental and social due diligence – Environmental and social policy framework – Commitments, targets, and measures 137
Deutsche Bank Appendix Non-Financial Report 2022 GRI Content Index and UN Global Compact SDG and GRI Standards and Disclosures Non-Financial Report and/or Link to Source Remarks/Omissions UNGC Reference Environmental and social due diligence - Environmental and social policy framework - Training and awareness Environmental and social due diligence - Equator Principles Human rights Human rights – Governance Human rights – Key topics in 2022 – Clients Human Rights - Key topics in 2022 - Supply chain Human Rights - Key topics in 2022 – Employees Culture, Integrity and Conduct Culture, Integrity and Conduct - Culture, Integrity and Conduct program - Purpose and governance 201-1 Direct economic value generated and AR – Deutsche Bank – Financial summary SDG 5, 7, 8, 9 distributed AR – Consolidated Financial Statements 201-2 Financial implications and other risks and AR – Combined Management Report – Risks Information incomplete/unavailable. The SDG 13 opportunities due to climate change and opportunities costs of actions taken to manage climate UNGC 7 Sustainable finance risks are not reported. Sustainable finance Sustainable finance – Corporate Bank – sections focus only on opportunities due Overview to climate change. Sustainable finance – Investment Bank – Fixed Income and Currencies – Overview Sustainable finance – Investment Bank – Origination and advisory – Overview Sustainable Finance – Private Bank – Private Bank Germany – Overview Sustainable finance – Private Bank – International Private Bank – Overview Sustainable finance – Asset Management – Overview Sustainable finance – Asset Management – Liquid Assets Climate risk – Risk Management framework Climate risk – Climate risk in Asset Management – Risk management strategy and processes In-house ecology – Targets and measures – Offsetting residual CO emissions 2 201-3 Defined benefit plan obligations and other AR – Consolidated Financial Statements – retirement plans Additional Notes – Note 33 ”Employee benefits” AR – Combined Management Report – Employees – Post-Employment Benefit Plans AR – Compensation Report 3-3 Management pf material topics Materiality assessment SDG 8 Corporate social responsibility Corporate social responsibility – Governance Art, culture and sports 203-1 Infrastructure investments and services Corporate social responsibility supported Corporate social responsibility – Key topics and impact in 2022 Corporate social responsibility – Alfred Herrhausen Gesellschaft Corporate social responsibility – Asset Management Art, culture and sports SDG and GRI Standards and Disclosures Non-Financial Report and/or Link to Source Remarks/Omissions UNGC Reference GRI 205: Anti-corruption 2016 3-3 Management of material topics Materiality assessment SDG 16 Anti-financial crime – Vision and mission Anti-financial crime – Governance Anti-financial crime – Key topics 2022 Anti-financial crime – Risk exposure and controls Anti-financial crime - Targets and measures 205-1 Operations assessed for risks related to Anti-financial crime – Risk exposure and Information incomplete/unavailable. UNGC 10 corruption controls Due to confidentiality reasons the number and percentage of operations assessed are not disclosed. Deutsche Bank only 138
Deutsche Bank Appendix Non-Financial Report 2022 GRI Content Index and UN Global Compact SDG and GRI Standards and Disclosures Non-Financial Report and/or Link to Source Remarks/Omissions UNGC Reference reports with regards to business areas that are assessed for corruption risks. 205-2 Communication and training about anti- Anti-financial crime – Risk exposure and Information incomplete/unavailable. corruption policies and procedures controls Deutsche Bank tracks the combined Anti-financial crime – Targets and measures number and percentage of in scope employees trained on anti-fraud, bribery and corruption instead of anti-corruption specific figures. Deutsche Bank does not report the number of governance body members that took anti-corruption training separately. Deutsche Bank does not report the total number and percentage of business partners that Deutsche Bank’s anti-corruption policies and procedures have been communicated to. 205-3 Confirmed incidents of corruption and actions Anti-financial crime – Risk exposure and Information incomplete/unavailable. taken controls Due to confidentiality reasons the number and nature of incidents of corruption are not disclosed. Significant and confirmed incidents are reported in the AR Note 27 “Provisions“. GRI 206: Anti-competitive Behavior 2016 206-1 Legal actions for anti-competitive AR – Consolidated Financial Statements – Information incomplete/unavailable. behavior, anti-trust, and monopoly practices Notes to the consolidated balance sheet – Number of legal actions pending or 27 “Provisions” completed is not reported because this is not how the topic is managed. SDG and GRI Standards and Disclosures Non-Financial Report and/or Link to Source Remarks/Omissions UNGC Reference GRI 207: Tax 2019 3-3 Management of material topics Materiality assessment http://www.db.com/ir/en/tax-strategy.htm Tax Tax – Governance Tax – Preventing infringements 207-1 Approach to tax Tax http://www.db.com/ir/en/tax-strategy.htm 207-2 Tax governance, control and risk management Tax – Governance All tax related disclosures to which Tax – Preventing infringements reference is made are subject to external audit and are covered by the unqualified audit opinion of EY for the AR 2022. 207-3 Stakeholder engagement and management of Tax http://www.db.com/ir/en/tax-strategy.htm concerns related to tax All tax related disclosures to which reference is made are subject to external audit and are covered by the unqualified audit opinion of EY for the AR 2022. 207-4 Country-by-country reporting AR – Consolidated Financial Statements – Additional Notes – 43 “Country by Country reporting” Tax SDG and GRI Standards and Disclosures Non-Financial Report and/or Link to Source Remarks/Omissions UNGC Reference GRI 300 Environment GRI 301: Materials 2016 3-3 Management of material topics Materiality assessment SDG 8, 12 In-house ecology In-house ecology – Governance In-house ecology – Targets and measures 301-1 Materials used by weight or volume In-house ecology – Greenhouse gas emissions Information incomplete/unavailable. SDG 8, 12 – Paper consumption, waste and water Reported data is not distinguished UNGC 7, 8 between non-renewable and renewable materials. Total weight or volume of materials that are used to produce and package the organization’s primary products and services during the reporting period are not relevant. 301-2 Recycled input materials used In-house ecology – Greenhouse gas emissions SDG 8, 12 – Paper consumption, waste and water UNGC 8 301-3 Reclaimed products and their packaging Not applicable. It is not considered materials material for Deutsche Bank. GRI 302: Energy 2016 3-3 Management of material topics Materiality assessment SDG 7, 8, 12 139
Deutsche Bank Appendix Non-Financial Report 2022 GRI Content Index and UN Global Compact SDG and GRI Standards and Disclosures Non-Financial Report and/or Link to Source Remarks/Omissions UNGC Reference In-house ecology In-house ecology – Governance In-house ecology – Key topics in 2022 – Energy efficiency and conservation In-house ecology – Greenhouse gas emissions – Paper consumption, waste and water 302-1 Energy consumption within the organization In-house ecology – Key topics in 2022 – Energy Deutsche Bank reports total energy SDG 7, 8, 12, 13 and renewable electricity consumption (in GJ and GWh) and UNGC 7, 8 electricity from renewables. Total energy from non-renewable sources = total energy minus renewable electricity. 302-3 Energy intensity In-house ecology – Key topics in 2022 – Energy SDG 7, 8, 12, 13 and renewable electricity UNGC 8 302-4 Reduction of energy consumption In-house ecology - Key topics 2022 - Energy SDG 7, 8, 12, 13 efficiency and conservation UNGC 8, 9 In-house ecology – Key topics in 2022 – Energy and renewable electricity GRI 303: Water and Effluents 2018 3-3 Management of material topics Materiality assessment SDG 8, 12 In-house ecology – Governance In-house ecology – Greenhouse gas emissions – Paper consumption, waste and water 303-1 Interaction with water as a shared resource In-house ecology – Greenhouse gas emissions Not applicable. Disclosure on water – Paper consumption, waste, and water withdrawal and water discharge is not considered material as none of Deutsche Bank’s sites are significant consumers or dischargers of water. 303-2 Management of water discharge-related Not applicable. It is not considered impacts material as none of Deutsche Bank’s sites are significant consumers of water. 303-3 Water withdrawal by source In-house ecology – Greenhouse gas emissions Not applicable. It is not considered SDG 6, 12 – Paper consumption, waste, and water material as none of Deutsche Bank’s sites UNGC 7,8 are significant consumers in any catchment area under water stress. 303-4 Water discharge Not applicable. It is not considered material as none of Deutsche Bank’s sites are significant dischargers of water. 303-5 Water consumption In-house ecology – Greenhouse gas emissions Not applicable. It is not considered SDG 6, 12 – Paper consumption, waste, and water material as none of Deutsche Bank’s sites UNGC 7,8 are significant consumers in any catchment area under water stress. GRI 305: Emissions 2016 3-3 Management of material topics Materiality assessment Information unavailable/incomplete. The SDG 8, 12 Climate risk – Climate risk in Asset actual and potential, negative and positive Management – DWS approach to Net Zero impacts that Deutsche Bank has on the In-house ecology environment and society will be thoroughly In-house ecology – Governance analyzed and further integrated in In-house ecology – Targets and measures management processes in the coming In-house ecology – Targets and measures – years. Offsetting residual CO emissions 2 305-1 Direct (Scope 1) GHG emissions Climate risk - Climate Risk in Asset Information unavailable/incomplete. SDG 3, 12, 13, 14 Management - DWS approach to Net Zero Deutsche Bank does not have biogenic UNGC 7,8 In-house ecology - targets and measures - CO emissions and therefore does not 2 Offsetting residual CO emissions report on them. 2 In-house ecology – Greenhouse gas emissions 305-2 Energy indirect (Scope 2) GHG emissions Climate risk - Climate Risk in Asset SDG 3, 12, 13, 14, Management - DWS approach to Net Zero 15 In-house ecology – Targets and measures – UNGC 7,8 Offsetting residual CO emissions 2 In-house ecology – Greenhouse gas emissions 305-3 Other indirect (Scope 3) GHG emissions In-house ecology – Targets and measures – Information unavailable/incomplete. SDG 3, 12, 13, 14, Offsetting residual CO emissions Deutsche Bank does not have biogenic 15 2 In-house ecology – Greenhouse gas emissions CO2 emissions and therefore does not UNGC 7,8 report on them. 305-4 GHG emissions intensity Climate risk - Climate Risk in Asset SDG 13, 14, 15 Management - DWS approach to Net Zero UNGC 8 In-house ecology – Targets and measures – Offsetting residual CO emissions 2 305-5 Reduction of GHG emissions In-house ecology – Targets and measures – SDG 13, 14, 15 Offsetting residual CO emissions UNGC 8,9 2 In-house ecology – Greenhouse gas emissions 140
Deutsche Bank Appendix Non-Financial Report 2022 GRI Content Index and UN Global Compact SDG and GRI Standards and Disclosures Non-Financial Report and/or Link to Source Remarks/Omissions UNGC Reference GRI 306: Waste 2020 3-3 Management of material topics Materiality assessment SDG 8, 12 In-house ecology In-house ecology – Governance In-house ecology – Greenhouse gas emissions – Paper consumption, waste and water 306-1 Waste generation and significant waste-related In-house ecology – Greenhouse gas emissions Information unavailable/incomplete. impacts – Paper consumption, waste and water Deutsche Bank does not report on the processes used to determine whether its waste contractor manages the waste in line with contractual or legislative obligations. 306-2 Management of significant waste-related In-house ecology – Greenhouse gas emissions Information unavailable/incomplete. SDG 3, 6, 12 impacts – Paper consumption, waste and water Deutsche Bank does not report on its UNGC 8 waste management along the value chain or on its processes used to collect and monitor waste-related data. 306-3 Waste generated In-house ecology – Greenhouse gas emissions – Paper consumption, waste and water 306-4 Waste diverted from disposal In-house ecology – Greenhouse gas emissions – Paper consumption, waste and water 306-5 Waste directed to disposal In-house ecology – Greenhouse gas emissions – Paper consumption, waste and water SDG and GRI Standards and Disclosures Non-Financial Report and/or Link to Source Remarks/Omissions UNGC Reference GRI 400 Social GRI 401: Employment 2016 3-3 Management of material topics Materiality assessment SDG 5, 8 Sustainable finance – Training and awareness Human rights – Key topics in 2022 - Employees Employment and employability Employment and employability – Governance Employment and employability – Workforce management – Workforce development Employment and employability – Workforce management – Recruiting and talent development Employment and employability – Workforce management – Future of work Employment and employability – Diversity, Equality and Inclusion Employment and employability – Diversity, Equality and Inclusion – Gender diversity Employment and employability – Diversity, Equality and Inclusion – An inclusive work environment 401-1 New employee hires and employee turnover AR – Combined Management Report – SDG 8 Employees UNGC 6 Employment and employability – Workforce management – Workforce development Employment and employability – Workforce management – Recruiting and talent development 401-2 Benefits provided to full-time employees that Employment and employability - Workforce Information unavailable/incomplete. SDG 8 are not provided to temporary or part-time management - Workforce development The bank’s inclusive culture and work employees Employment and employability – Workforce environment encompasses full-time management – Recruiting and talent employees as well as part -time or development temporary employees. In line with Employment and employability – Workforce legislation in the European Union management – Future of work (including UK) Deutsche Bank provides Employment and employability – Diversity, benefits that are available to full-time Equality and Inclusion employees also to part-time employees. Temporary employees may also be eligible depending on the nature of the benefit. Outside of the European Union the number of part-time employees and temporary employees is not material. Benefits provided to employees depend on country, region, and jurisdiction. Therefore, not all benefits are available to each employee. 141
Deutsche Bank Appendix Non-Financial Report 2022 GRI Content Index and UN Global Compact SDG and GRI Standards and Disclosures Non-Financial Report and/or Link to Source Remarks/Omissions UNGC Reference 401-3 Parental leave HCR – Hybrid working and beyond Information unavailable/incomplete. Deutsche Bank does not report the total number of employees who were entitled to or who took parental leave. Due to confidentiality restraints, Deutsche Bank does not disclose the total number of employees who returned to work after parental leave ended that were still employed 12 months after their return to work or return to work and retention rates of employees that took parental leave. The Human Capital Report discloses the number of employees that returned to work in the reporting period after parental leave ended, by gender. GRI 403: Occupational health and safety 2018 3-3 Management of material topics Materiality assessment SDG 3, 8 Employment and employability – Workforce management – Future of work 403-1 Occupational health and safety management Employment and employability – Workforce https://www.db.com/who-we-are/our- system management – Future of work culture/hr-report/ensuring-our-employees- wellbeing/index?language_id=1 403-5 Training on occupational health and safety Employment and employability – Workforce management – Future of work 403-6 Promotion of worker health Employment and employability – Workforce https://www.db.com/who-we-are/our- SDG 3, 8 management – Future of work culture/hr-report/ensuring-our-employees- wellbeing/index?language_id=1 403-10 Work-related ill health Information unavailable/incomplete. Due to data protection and confidentiality details on reasons for illness are not available. GRI 404: Training and education 2016 3-3 Management of material topics Materiality assessment SDG 4, 5, 8 Sustainable finance – Training and awareness Environmental and social due diligence – Environmental and social policy framework – Training and awareness Environmental and social due diligence – Equator principles Anti-financial crime – Risk exposure and controls Data protection – Training and awareness Digitization and innovation – Governance Digitization and innovation – Training and awareness Information security – Security measures – Fostering a security culture Employment and employability Employment and employability – Governance Employment and employability – Workforce management – Recruiting and talent development Employment and employability – Workforce management – Future of work 404-1 Average hours of training per year per HCR – Our Learning Culture Information unavailable/incomplete. SDG 4, 5, 8 employee Deutsche Bank does not report average hours of training in 2022 per employee, and do not distinguish based on gender or employee category. Deutsche Bank’s learning environment is accessible to all staff regardless of gender, age, etc. Training hours are not managed to steer learning. The Human Capital Report discloses both training expenses (in EUR million) and training attendance. 404-2 Programs for upgrading employee skills and Sustainable finance – Training and awareness Information incomplete. Deutsche Bank SDG 5, 8 transition assistance programs Sustainable finance – Investment Bank – does not report on transition assistance Origination and advisory – Overview programs provided to facilitate continued Sustainable finance – Private Bank – employability and the management of International Private Bank – Overview career endings resulting from retirement or Climate risk – Governance termination of employment. 142
Deutsche Bank Appendix Non-Financial Report 2022 GRI Content Index and UN Global Compact SDG and GRI Standards and Disclosures Non-Financial Report and/or Link to Source Remarks/Omissions UNGC Reference Environmental and social due diligence – Environmental and social policy framework – Training and awareness Environmental and social due diligence – Equator principles Human rights – Key topics in 2022 – Clients Culture, integrity, and conduct – Culture, integrity, and conduct program – Key topics and initiatives in 2022 Anti-financial crime – Targets and measures Data protection – Training and awareness Product responsibility Client satisfaction – Complaint management Digitalization and innovation – Training and awareness Information security – Security measures – Fostering a security culture Employment and employability – Workforce management – Workforce development Employment and employability – Workforce management – Recruiting and talent development Employment and employability – Workforce management – Future of work 404-3 Percentage of employees receiving regular AR – Compensation Report – Compensation of Information unavailable/incomplete. performance and career development reviews the employees (unaudited) – Group Deutsche Bank discloses its performance compensation framework management processes within the Annual AR – Compensation Report – Compensation of Report. However, the percentages of the employees (unaudited) – Determination of employees receiving performance and performance-based variable compensation development reviews are not reported. GRI 405: Diversity and equal opportunity 2016 3-3 Management of material topics Materiality assessment Information unavailable/incomplete. SDG 5, 8, 10 Employment and employability – Diversity, Deutsche Bank do not report percentage equality and inclusion – Gender diversity of individuals within the organization’s Employment and employability – Diversity, governance bodies in each of the Equality and Inclusion – An inclusive work following diversity categories: Age group: environment under 30 years old, 30-50 years old, over 50 years old. Deutsche Bank discloses the age of the organization’s highest governance bodies. 405-1 Diversity of governance bodies and employees AR – Deutsche Bank Group – Management SDG 5, 8, 10 Board UNGC 6 AR – Deutsche Bank Group – Supervisory Board AR – Combined Management Report – Corporate Governance Statement AR – Corporate Governance Statement - Management Board and Supervisory Board Corporate governance Employment and employability – Diversity, Equality and Inclusion – Gender diversity Employment and employability – Diversity, Equality and Inclusion – An inclusive work environment 405-2 Ratio of basic salary and Information unavailable/incomplete. remuneration of women to men Partially reported for the UK. For EU, Deutsche Bank will follow the EU Pay Transparency Directive which comes into force from 2024. 143
Deutsche Bank Appendix Non-Financial Report 2022 GRI Content Index and UN Global Compact SDG and GRI Standards and Disclosures Non-Financial Report and/or Link to Source Remarks/Omissions UNGC Reference GRI 406: Non-discrimination 2016 3-3 Management of material topics Materiality assessment SDG 8 Employment and employability – Diversity, Equality and Inclusion – An inclusive work environment 406-1 Incidents of discrimination and corrective HCR – Rewarding performance Information unavailable/incomplete. SDG 8 actions taken Employment and employability – Diversity, Deutsche Bank does not report details on UNGC 6 Equality and Inclusion – An inclusive work corrective actions taken. Information on environment complaints and disciplinary cases can be found in the Human Capital Report. SDG and GRI Standards and Disclosures Non-Financial Report and/or Link to Source Remarks/Omissions UNGC Reference GRI 413 Local Communities 3-3 Management of material topics Materiality assessment The boundary external (client, society) SDG 8, 16 Corporate social responsibility - Governance applies for: Human rights. 413-1 Operations with local community engagement, Corporate social responsibility Information unavailable/incomplete. UNGC 1 impact assessments and development Corporate social responsibility – Key topics and Deutsche Bank does not report the programs impact in 2022 percentage of operations with implemented local community engagement, impact assessments, and/or development programs. Deutsche Bank reports only on community engagement efforts through its local development programs. SDG and GRI Standards and Disclosures Non-Financial Report and/or Link to Source Remarks/Omissions UNGC Reference GRI 415: Public Policy 2016 3-3 Management of material topics Materiality assessment Public policy and regulation Public policy and regulation – Governance 415-1 Political contributions Public policy and regulation – Financial transparency Public policy and regulation – Memberships in trade associations SDG and GRI Standards and Disclosures Non-Financial Report and/or Link to Source Remarks/Omissions UNGC Reference GRI 417: Marketing and labeling 2016 3-3 Management of material topics Materiality assessment Information unavailable/incomplete. Product responsibility Deutsche Bank does not describe how Product responsibility – Product design and engagement with stakeholders has advisory principles informed the actions taken, and how it Product responsibility – Selling practices and has informed whether its actions have marketing been effective. 417-1 Requirements for product and service Sustainable finance – Private Bank – Not applicable. Deutsche Bank follows information and labeling International Private Bank – Overview product and advisory principles in Product responsibility – Selling practices and designing and selling products, but marketing Deutsche Bank does not report the percentage of significant product or service categories covered by and assessed for compliance. The sourcing of product components and their disposal are not applicable to its business. 417-2 Incidents of non-compliance concerning product AR – Consolidated Financial Statements – Not reported in detail due to confidentiality and service Notes to the consolidated balance sheet – 27 restraints. If any significant incidents of information and labeling “Provisions” non-compliance occurred, these would be reported in Note 27 “Provisions” of the Annual Report. 417-3 Incidents of non-compliance concerning AR – Consolidated Financial Statements – Not reported in detail due to confidentiality marketing communications Notes to the consolidated balance sheet – 27 restraints. If any significant incidents of “Provisions” non-compliance occurred, these would be reported in Note 27 “Provisions” of the Annual Report. 144
Deutsche Bank Appendix Non-Financial Report 2022 GRI Content Index and UN Global Compact SDG and GRI Standards and Disclosures Non-Financial Report and/or Link to Source Remarks/Omissions UNGC Reference GRI 418: Customer privacy 2016 3-3 Management of material topics Materiality assessment Information unavailable/incomplete. SDG 8 Data protection There have been new technologies and Data protection – Governance initiatives undertaken across Deutsche Data protection – Training and awareness Bank’s various product houses towards Information security digital transformation, however, risk and Information security – Security strategy, privacy of data linked to innovations are framework and governance not been reported. Information security – Security measures – Layered security controls Information security – Security measures – Third-party security risk management 418-1 Substantiated complaints concerning breaches Data Protection – No personal data breaches of Information unavailable/incomplete. of customer privacy and losses of customer material impact to individuals observed In 2022, Deutsche Bank again did not data observe any personal data breaches of material impact to individuals. Although complaints on data protection aspects are covered in Deutsche Bank’s regular complaint management procedures, they are not filtered specifically. Absolute data regarding complaints is not reported. SDG and GRI Standards and Disclosures Non-Financial Report and/or Link to Source Remarks/Omissions UNGC Reference Financial Services Standard Disclosures Product portfolio FS1 Policies with specific environmental and social Sustainability strategy – Sustainability https://www.db.com/files/documents/db- SDG 10 components applied to business lines governance – Sustainability principles and es-policy-framework-english.pdf policies Sustainable finance – Governance Climate risk – Governance Climate risk – Risk management framework Environmental and social due diligence – Environmental and social policy framework Environmental and social due diligence – Equator principles Human rights – Key topics in 2022 – Clients Public policy and regulation – Employee- Stakeholder interaction Public policy and regulation – Group policy does not permit donations to political parties Anti-financial crime – Risk exposure and controls Product responsibility – Product suitability and appropriateness Employment and employability – Governance Corporate social responsibility – Governance FS3 Processes for monitoring clients’ Sustainable finance – Governance SD1G 10 implementation of and compliance with Sustainable finance – Corporate bank – environmental and social requirements included Overview in agreements or transactions Sustainable finance – Asset Management – Liquid assets Climate risk – Risk management framework Climate risk – Climate risk in Asset Management – Risk management strategy and processes Environmental and social due diligence – Environmental and social policy framework Environmental and social due diligence – Environmental and social policy framework – Commitments, targets, and measures Environmental and social due diligence – Environmental and social policy framework – Transactional reviews Environmental and social due diligence – Equator principles Human rights Human rights – Key topics in 2022 – Clients Stakeholder engagement and thought leadership Public policy and regulation - Governance Anti-financial crime – Risk exposure and controls Tax – Preventing infringements 145
Deutsche Bank Appendix Non-Financial Report 2022 GRI Content Index and UN Global Compact SDG and GRI Standards and Disclosures Non-Financial Report and/or Link to Source Remarks/Omissions UNGC Reference FS4 Process(es) for improving staff competency to Sustainable finance – Investment bank – implement the environmental and social policies Origination and advisory – Overview and procedures as applied to business lines Sustainable finance – Private Bank – Private Bank Germany – Overview Sustainable finance – Private Bank – International Private Bank – Overview Climate risk – Governance Environmental and social due diligence – Environmental and social policy framework – Training and awareness Environmental and social due diligence – Equator principles Human rights – Key topics in 2022 – Clients Human rights – Key topics in 2022 – Employees Anti-financial crime – Targets and measures Data protection – Training and awareness Product responsibility Information security – Security measures – Fostering a security culture FS5 Interactions with clients/investees/business Climate risk – Risk management strategy – partners regarding environmental and social Climate risks and opportunities risks and opportunities Climate risk – Risk management framework – Engagement in climate-related initiatives Climate risk – Climate risk in Asset Management Climate risk – Climate risk in Asset Management – DWS approach to Net Zero Human rights – Key topics in 2022 – Clients FS8 Monetary value of products and services Sustainable finance – Disclosures in Information unavailable/incomplete. designed to deliver a specific environmental accordance with Article 8 of the Taxonomy Deutsche Bank has reported the benefit for each business line broken down by Regulation cumulative volume of sustainable purpose. Sustainable finance – Progress toward target financing and investing per business. The Sustainable finance – Corporate Bank – volumes are split into four categories – Progress toward target environmental, social, environmental and Sustainable finance – Investment Bank – Fixed social, and sustainability-linked. Income and Currencies – Overview A disclosure on the associated monetary Sustainable finance – Investment Bank – Fixed value of every product and service Income and Currencies – Progress toward designed to deliver a specific target environmental benefit broken down by Sustainable finance – Investment Bank – business line does not yet exist. The Origination and advisory – Overview possibilities to expand the tracking Sustainable finance – Investment Bank – methodology are being investigated and a Origination and advisory – Progress toward first impact assessment pilot has been target started. Sustainable finance – Private Bank – Private Bank Germany – Progress toward target Sustainable finance – Private Bank – International Private Bank – Overview Sustainable finance – Private Bank – International Private Bank – Progress toward target Active ownership FS11 Percentage of assets subject to positive and Sustainable finance – Asset Management – Information unavailable/incomplete. Partly SDG 10 negative environmental or social screening. Overview reported. Deutsche Bank does not report Sustainable finance - Asset Management - percentages of assets subject to f positive Liquid assets and negative screening if these screenings are required by law. FS12 Voting polic(ies) applied to environmental or Sustainable finance – Asset Management – Information unavailable/incomplete. social issues for shares over which the Overview Deutsche Bank does not report the reporting organization holds the right to vote percentage or number of shares for which shares or advises on voting it applied voting policies to environmental or social issues. SDG and GRI Standards and Disclosures Non-Financial Report and/or Link to Source Remarks/Omissions UNGC Reference Society disclosures Local communities FS14 Initiatives to improve access to financial Sustainable finance – Corporate Bank – Information unavailable/incomplete. SDG 8, 10 services for disadvantaged people Overview Deutsche Bank does not indicate the Sustainable finance – Investment Bank – Fixed availability of documents that address the Income and Currencies – Overview degree to which Deutsche Bank has Sustainable finance – Private Bank – Private adapted facilities and methods of 146
Deutsche Bank Appendix Non-Financial Report 2022 GRI Content Index and UN Global Compact SDG and GRI Standards and Disclosures Non-Financial Report and/or Link to Source Remarks/Omissions UNGC Reference Bank Germany – Overview providing standard service offerings to Sustainable finance – Private Bank – support disadvantaged people. International Private Bank – Overview Sustainable finance – Asset Management – Illiquid Assets Digitization and innovation - Training and awareness Digitization and innovation – Other developments in 2022 FS16 Initiatives to enhance financial literacy by type Corporate social responsibility – Key topics and SDG 4 of beneficiary. impact in 2022 147
Deutsche Bank Appendix Non-Financial Report 2022 Sustainability Accounting Standards Board (SASB) Index Sustainability Accounting Standards Board (SASB) Index The Non-Financial Report 2022 continues to review and expand on reporting metrics of the Sustainability Accounting Standards Board (SASB) Standards, thus acknowledging their growing importance among investors and businesses. Deutsche Bank continuously strive to improve its disclosure of quantitative metrics and will continue to evaluate potential metrics included in these standards that are not disclosed yet. The bank’s disclosures are based on the Sustainable Industry Classification System (SICS) industries within the Financials sector that are most closely aligned with the four business divisions: Asset Management and Custody Activities (AC), Commercial Bank (CB), Consumer Finance (CF) and Investment Banking and Brokerage (IB). All reported data is as of and for the year ended December 31, 2022, unless otherwise stated. SASB Standard and Disclosure Non-Financial Report and/or Link to Source Remarks/Omissions Customer Privacy FN-CF-220a.1 Number of account holders whose information is Data protection – Governance There is no regulatory requirement to report this used for secondary purposes. metric. However, Deutsche Bank only processes personal data for secondary purposes if there is a valid legal justification for this, e.g., if a client has given his consent. The purposes for processing client personal data are detailed in the respective privacy notices. FN-CF-220a.2 Total amount of monetary losses as a result of AR – Consolidated Financial Statements – Notes legal proceedings associated with customer to the consolidated balance sheet – 27 privacy. “Provisions” Data Security FN-CB-230a.1 (1) Number of data breaches, (2) percentage Data protection – No personal data breaches of Quantitative numbers not reported. FN-CF-230a.1 involving personally identifiable information (PII), material impact to individuals observed (3) number of account holders affected. Information security – Security measures – Layered security controls FN-CB-230a.2 Description of approach to identifying and AR – Combined Management Report – Risks and FN-CF-230a.3 addressing data security risk. Opportunities – Risks – Risk management policies, procedures and methods as well as operational risks AR – Combined Management Report – Risks and Opportunities – Risks –Technology, Data and Innovation Data protection – Governance Information security – Security measures FN-CF-230a.2 Card-related fraud losses from (1) card-not- AR – Combined Management Report – Risk present fraud and (2) card-present and other Report – Risk and capital performance – fraud. Operational risk exposure SASB Standard and Disclosure Non-Financial Report and/or Link to Source Remarks/Omissions Access and Affordability Financial Inclusion and Capacity Building FN-CB-240a.1 1) Number and (2) amount of loans outstanding Sustainable finance – Corporate Bank Deutsche Bank discloses information on small and qualified programs designed to promote small Sustainable finance – Private Bank – Private Bank medium sized businesses and community business and community development. Germany development but does not disclose the number Sustainable finance – Private Bank – International and total amount of loans. Private Bank FN-CB-240a.4 Number of participants in financial literacy Corporate social responsibility initiatives for unbanked, underbanked or Corporate social responsibility – Key topics and underserved customers. impact in 2022 SASB Standard and Disclosure Non-Financial Report and/or Link to Source Remarks/Omissions Selling Practices and Product Labelling Transparent Information and Fair Advice for Customers FN-AC-270a.2 Total amount of monetary losses as a result of AR – Consolidated Financial Statements – Notes legal proceedings associated with marketing and to the consolidated balance sheet – 27 communication of financial product-related “Provisions” information to new and returning customers. FN-AC-270a.3 Description of approach to informing customers Product responsibility about products and services. Product responsibility – Product suitability and appropriateness Product responsibility – Selling practices and marketing Selling Practices FN-CF-270a.4 (1) Number of complaints filed with the Consumer Client satisfaction – Complaint management Information on client complaints is disclosed, but Financial Protection Bureau (CFPB), (2) complaints filed with the CFPB are not displayed percentage with monetary or non-monetary relief, due to confidentiality constraints. (3) percentage disputed by consumer, (4) percentage that resulted in investigation by the CFPB. 148
Deutsche Bank Appendix Non-Financial Report 2022 Sustainability Accounting Standards Board (SASB) Index SASB Standard and Disclosure Non-Financial Report and/or Link to Source Remarks/Omissions FN-CF-270a.5 Total amount of monetary losses as a result of AR – Consolidated Financial Statements – Notes legal proceedings associated with selling and to the consolidated balance sheet – 27 servicing of products. “Provisions” FN-MF-270a.3 Total amount of monetary losses as a result of AR – Consolidated Financial Statements – Notes legal proceedings associated with to the consolidated balance sheet – 27 communications to customers or remuneration of “Provisions” loan originators. FN-MF-270b.2 Total amount of monetary losses as a result of AR – Consolidated Financial Statements – Notes legal proceedings associated with discriminatory to the consolidated balance sheet – 27 mortgage lending. “Provisions” SASB Standard and Disclosure Non-Financial Report and/or Link to Source Remarks/Omissions Employee Engagement, Diversity and Inclusion Employee Diversity and Inclusion FN-AC-330a.1 Percentage of gender and racial/ethnic group AR – Deutsche Bank Group – Management Board FN-IB-330a.1 representation for (1) executive management, (2) AR – Deutsche Bank Group – Supervisory Board non-executive management, (3) professionals, Corporate governance and (4) all other employees Employment and employability – Diversity, Equity and Inclusion – Gender diversity Employment and employability – Diversity, Equity and Inclusion – An inclusive work environment SASB Standard and Disclosure Non-Financial Report and/or Link to Source Remarks/Omissions Product Design and Life Cycle Management Incorporation of Environmental, Social, and Governance Factors in Investment Management and Advisory FN-AC-410a.1 Amount of assets under management, by asset Sustainable finance – Asset Management class, that employ (1) integration of environmental, social, and governance (ESG) issues, (2) sustainability themed investing, and (3) screening. FN-AC-410a.2 Description of approach to incorporation of Sustainable finance – Asset Management environmental, social, and governance (ESG) factors in investment and/or wealth management processes and strategies. FN-AC-410a.3 Description of proxy voting and investee Sustainable finance – Asset Management engagement policies and procedures. Incorporation of Environmental, Social, and Governance Factors in Credit Analysis FN-CB-410a.1 Commercial and industrial credit exposure, by AR – Consolidated Financial Statements – Notes industry. to the consolidated balance sheet – 18 “Loans” Pillar 3 Report – General quantitative information on credit risk Sustainable finance – Corporate Bank FN-CB-410a.2 Description of approach to incorporation of Sustainable finance Sustainable Finance Framework: environmental, social and governance (ESG) Sustainable finance – Governance https://www.db.com/files/documents/csr/sustainabi factors in credit analysis. lity/2020july_deutsche-bank-sustainable-finance- framework.pdf?language_id=1&kid=cr--en--docs-- 2020july_db_sustainable_finance_framework_fina l_for_disclosure-pdf.redirect-en.shortcut Incorporation of Environmental, Social, and Governance Factors in Investment Banking and Brokerage Activities FN-IB-410a.1 Revenue from (1) underwriting, (2) advisory, and Sustainable finance – Corporate Bank (3) securitization transactions incorporating Sustainable finance – Investment Bank integration of environmental, social, and governance (ESG) factors, by industry. FN-IB-410a.2 (1) Number and (2) total value of investments and Sustainable finance – Corporate Bank Total investments of ESG loans and investments loans incorporating integration of environmental, Sustainable finance – Investment Bank are stated, but they are not disclosed by industry. social and governance (ESG) factors, by industry. FN-IB-410a.3 Description of approach to incorporation of Sustainable finance – Private Bank – International environmental, social, and governance (ESG) Private Bank factors in investment banking and brokerage Sustainable finance – Asset Management activities. SASB Standard and Disclosure Non-Financial Report and/or Link to Source Remarks/Omissions Business Ethics FN-AC-510a.1 Total amount of momentary losses as a result of AR – Consolidated Financial Statements – Notes FN-CB-510a.1 legal proceedings associated with fraud, insider to the consolidated balance sheet – 27 FN-IB-510a.1 trading, anti-trust, anti-competitive behavior, “Provisions” Anti-financial crime – Risk exposure and 149
Deutsche Bank Appendix Non-Financial Report 2022 Sustainability Accounting Standards Board (SASB) Index SASB Standard and Disclosure Non-Financial Report and/or Link to Source Remarks/Omissions market manipulation, malpractice, or other related controls – Anti-fraud, bribery and corruption financial industry laws or regulation. FN-AC-510a.2 Description of whistleblower policies and Culture, integrity, and conduct FN-CB-510a.2 procedures. Culture, integrity and conduct – Culture, Integrity FN-IB-510a.2 and Conduct program – Key topics and initiatives in 2022 FN-IB-510b.3 Total amount of monetary losses as a result of AR – Consolidated Financial Statements – Notes legal proceedings associated with professional to the consolidated balance sheet – 27 integrity, including duty of care. “Provisions” FN-IB-510b.4 Description of approach to ensuring professional Culture, integrity, and conduct integrity, including duty of care. Anti-financial crime – Risk exposure and controls – Anti-fraud, bribery and corruption FN-IB-550b .1 Percentage of total remuneration that is variable AR – Compensation report for Material Risk Takers. Corporate governance FN-IB-550b .2 Percentage of variable remuneration of Material AR – Compensation report Risk Takers to which malus or claw back provisions were applied. FN-IB-550b.3 Discussion of policies around supervision, control AR – Consolidated Financial Statements – Notes and validation of traders' pricing of Level 3 assets to the consolidated balance sheet – 13 “Financial and liabilities. Instruments Carried at Fair Value” SASB Standard and Disclosure Non-Financial Report and/or Link to Source Remarks/Omissions Systemic Risk Management FN-CB-550a.1 Global Systemically Important Bank (G-SIB) AR – Combined Management Report – Risk Media release: FSB reduces G-SIB capital buffer FN-IB-550a.1 score, by category. Report – Risk and capital performance – Capital, requirement for Deutsche Bank: Leverage Ratio, TLAC and MREL – Minimum https://www.db.com/news/detail/20191122-fsb- capital requirements and additional capital buffers reduces-g-sib-capital-buffer-requirement-for- deutsche-bank?language_id=1 FN-CB-550a.2 Description of approach to incorporation of results AR – Combined Management Report – Risk FN-IB-550a.2 of mandatory and voluntary stress tests into Report – Risk and capital framework – Risk and capital adequacy planning, long-term corporate Capital Plan – Internal capital adequacy strategy, and other business activities. assessment process AR – Combined Management Report – Risk Report – Risk and capital framework – Stress testing Climate risk – Risk management framework – Scenario analysis and stress testing SASB Standard and Disclosure Non-Financial Report and/or Link to Source Remarks/Omissions Activity Metrics Asset Management & Custody Activities FN-AC-000.A (1) Total registered and (2) total unregistered AR – Consolidated Financial Statements – Notes assets under management (AUM). to the consolidated financial statements – 4 “Business segments and related information – Segmental results of operations – Asset Management” Sustainable finance – Asset Management FN-AC-000.B Total assets under custody and supervision. AR – Consolidated Financial Statements – Notes to the consolidated financial statements – 4 “Business segments and related information – Segmental results of operations” SASB Standard and Disclosure Non-Financial Report and/or Link to Source Remarks/Omissions Activity Metrics Commercial Banks FN-CB-000.B (1) Number and (2) value of loans by segment: (a) AR – Consolidated Financial Statements – Notes personal, (b) to the consolidated financial statements – 4 small business, and (c) corporate. “Business segments and related information” SASB Standard and Disclosure Non-Financial Report and/or Link to Source Remarks/Omissions Activity Metrics Investment Banking & Brokerage FN-IB-000.A (1) Number and (2) value of (a) underwriting, AR – Consolidated Financial Statements – Notes Disclosed data shows underwriting and advisory (b) advisory, and (c) securitization to the consolidated income statement – 6 breakdown by business division. transactions. “Commissions and fee income” 150
Deutsche Bank Appendix Non-Financial Report 2022 Recommendations of the Task Force on Climate-related Financial Disclosures (TCFD) Recommendations of the Task Force on Climate-related Financial Disclosures (TCFD) In the following table Deutsche Bank shows the chapters and sub-chapters of the Non-Financial Report, the Annual Report (AR), or the SEC Form 20-F (20-F) in which the disclosures recommended by the Task Force on Climate-related Financial Disclosures (TCFD) can be found, thus acknowledging their growing importance among investors and businesses. Deutsche Bank continuously strives to improve their disclosures. Topic Recommended disclosures Non-Financial Report and/or Link to Source Governance Describe the board’s oversight of climate-related risks and opportunities. AR – Deutsche Bank Group – Report of the Supervisory Board AR – Combined Management Report – Risk Report – Risk Disclose the organization’s and capital framework – Risk governance governance around climate-related AR – Combined Management Report – Corporate Governance risks and opportunities. Statement AR – Corporate Governance Statement Sustainability strategy and implementation – Sustainability governance Describe management’s role in assessing and managing climate-related AR – Combined Management Report – Risk Report – Risk risks and opportunities. and capital framework – Risk governance AR – Combined Management Report – Corporate Governance Statement AR – Compensation Report – Compensation of the Management Board – Management board compensation 2022 – Outlook for fiscal year 2023 – Objective structure and targets 2023 AR – Corporate Governance Statement Climate risk – Governance Climate Risk – Climate risk in Asset Management – Governance In-house ecology – Governance Strategy Describe the climate-related risks and opportunities the organization has AR – Combined Management Report – Risks and identified over the short, medium, and long term. Opportunities – Risks - Regulatory supervisory reforms, Disclose the actual and potential assessments and proceedings impacts of climate-related risks and AR – Combined Management Report – Risks and opportunities on the organization’s Opportunities – Risks – Environmental, social and governance businesses, strategy, and financial risk planning where such information is AR – Combined Management Report – Risks and material. Opportunities – Opportunities – Strategy 20-F – Item 3: Key information – Risk Factors - Risks Relating to Deutsche Banks’s Business and Strategy 20-F – Item 3: Key information – Risk Factors - Risks Relating to Environmental, Social and Governance (ESG)-Related Changes 20-F – Item 4: Information on the Company – The Competitive Environment – Climate change, environmental and social issues Climate risk – Risk management strategy – Climate risks and opportunities Climate risk – Climate risk in Asset Management – Risk management strategy and processes Describe the impact of climate-related risks and opportunities on the AR – Combined Management Report – Risks and organization’s businesses, strategy, and financial planning. Opportunities – Risks - Regulatory supervisory reforms, assessments and proceedings AR – Combined Management Report – Risks and Opportunities – Risks – Environmental, social and governance risk AR – Combined Management Report – Risks and Opportunities – Opportunities – Strategy AR – Combined Management Report – Sustainability 20-F – Item 3: Key information – Risk Factors - Risks Relating to Deutsche Bank’s Business and Strategy 20-F – Item 3: Key information – Risk Factors - Risks Relating to Environmental, Social and Governance (ESG)-Related Changes 20-F – Item 4: Information on the Company – The Competitive Environment – Climate change, environmental and social issues Climate risk – Risk management strategy Climate Risk – Climate risk in Asset Management – Risk management strategy and processes Describe the resilience of the organization’s strategy, taking into Climate risk – Risk management framework - Scenario consideration different climate-related scenarios, including a 2°C or analysis and stress testing lower scenario. 151
Deutsche Bank Appendix Non-Financial Report 2022 Recommendations of the Task Force on Climate-related Financial Disclosures (TCFD) Climate risk – Risk management framework – Risk metrics and targets Climate Risk – Climate risk in Asset Management – Risk management strategy and processes Risk management Describe the organization’s processes for identifying and assessing Climate risk – Risk management framework - Risk climate-related risks. identification and materiality assessment Disclose how the organization Climate risk – Risk management framework - Integration into identifies, assesses, and manages risk type frameworks and processes climate-related risks. Climate risk – Risk management framework - Scenario analysis and stress testing Climate risk – Risk management framework – Risk metrics and targets Climate Risk – Climate risk in Asset Management – Risk management strategy and process Describe the organization’s processes for managing climate-related Climate risk – Risk management framework – Risk risks. identification and materiality assessment Climate risk – Risk management framework - Integration into risk type frameworks and processes Climate risk – Risk management framework - Scenario analysis and stress testing Climate risk – Risk management framework – Risk metrics and targets Climate Risk – Climate risk in Asset Management – Risk management strategy and process Describe how processes for identifying, assessing, and managing AR – Combined Management Report – Risk Report – Risk climate-related risks are integrated into the organization’s overall risk and capital framework management. AR – Combined Management Report – Risk Report – Risk and Capital Management – Credit Risk Management and Asset Quality – IFRS 9 Impairment – IFRS 9 Model results AR – Combined Management Report – Risk Report – Risk and capital management – Enterprise risk management – Environmental, social and governance risk Climate risk – Risk management framework - Risk identification and materiality assessment Climate risk – Risk management framework - Integration into risk type frameworks and processes Climate risk – Risk management framework - Scenario analysis and stress testing Climate risk – Risk management framework – Risk metrics and targets Climate risk – Climate risk in Asset Management – Risk management strategy and process Metrics and targets Disclose the metrics used by the organization to assess climate-related Climate risk – Risk management framework – Risk metrics risks and opportunities in line with its strategy and risk management and targets Disclose the metrics and targets process. Climate risk – Climate risk in Asset Management – DWS used to assess and manage relevant approach to net zero climate-related risks and Disclose Scope 1, Scope 2, and, if appropriate, Scope 3 greenhouse Climate risk – Risk management framework – Risk metrics opportunities where such information gas (GHG) emissions, and the related risks. and targets is material. In-house ecology – Greenhouse gas emissions Describe the targets used by the organization to manage climate-related Climate risk – Risk management framework – Risk metrics risks and opportunities and performance against targets. and targets Climate Risk – Risk management framework – Engagement in climate-related initiatives Climate risk – Climate Risk in Asset Management – DWS approach to Net Zero In-house ecology – Targets and measures In-house ecology – Key topics in 2022 – Energy efficiency and conservation In-house ecology – Key topics in 2022 – Energy and renewable electricity In-house ecology – Greenhouse gas emissions – Business travel In-house ecology – Greenhouse gas emissions – Paper consumption, waste, and water 152
Deutsche Bank Appendix Non-Financial Report 2022 Principles for Responsible Banking Principles for Responsible Banking The following table sets out the reporting and self-assessment requirements for Signatories of the Principles for Responsible Banking. Principle 1: Alignment We will align our business strategy to be consistent with and contribute to individuals’ needs and society’s goals, as expressed in the Sustainable Development Goals, the Paris Climate Agreement and relevant national and regional frameworks. Business model Describe (high-level) your bank’s business model, including the main customer segments served, types of products and services provided, the main sectors and types of activities across the main geographies in which your bank operates or provides products and services. Please also quantify the information by disclosing e.g., the distribution of your bank’s portfolio (%) in terms of geographies, segments (i.e., by balance sheet and/or off-balance sheet) or by disclosing the number of customers and clients served. Response Links and references As the leading bank in Germany with strong European roots and a global network with a Annual Report 2022: comprehensive product suite, Deutsche Bank aims to become the first point of contact in all Deutsche Bank Group/ financial matters aspiring to help clients navigate through geopolitical and macroeconomic Strategy; Combined shifts and accelerate their transition to a more sustainable and digitized economy. Management Report/Operating and financial The bank focuses on four client-centric businesses: Corporate Bank, Investment Bank, review Private Bank and Asset Management providing corporate and transaction banking, lending, focused investment banking, retail and private banking as well as asset and wealth Non-Financial Report 2022: management products and services to companies, governments, institutional investors, About Deutsche Bank small and medium-sized businesses and private individuals. In 2022, the Deutsche Bank employed 84,930 employees (full time employees) from 157 nationalities and operated in 58 countries. The bank generated 39% of its revenues in Germany, 31% in the EMEA region, 18% in the Americas and 12% in the Asia-Pacific region. 153
Deutsche Bank Appendix Non-Financial Report 2022 Principles for Responsible Banking Strategy alignment Does your corporate strategy identify and reflect sustainability as strategic priority/ies for your bank? ☒ Yes ☐ No Please describe how your bank has aligned and/or is planning to align its strategy to be consistent with the Sustainable Development Goals (SDGs), the Paris Climate Agreement, and relevant national and regional frameworks. Does your bank also reference any of the following frameworks or sustainability regulatory reporting requirements in its strategic priorities or policies to implement these? ☒ UN Guiding Principles on Business and Human Rights ☒ International Labour Organization fundamental conventions ☒ UN Global Compact ☐ UN Declaration on the Rights of Indigenous Peoples ☒ Any applicable regulatory reporting requirements on environmental risk assessments, e.g., on climate risk - please specify which ones: Compliance with the provisions of the 1) the Taxonomy regulation, and 2) the EBA Pillar 3 reporting requirements on ESG risks ☒ Any applicable regulatory reporting requirements on social risk assessments, e.g., on modern slavery - please specify which ones: UK Modern Slavery Act 2015 and section 14 of the Australian Commonwealth Modern Slavery Act 2018, ☐ None of the above 154
Deutsche Bank Appendix Non-Financial Report 2022 Principles for Responsible Banking Response Links and references As a global financial institution Deutsche Bank believes it is part of its responsibility to Non-Financial Report: support and where possible, accelerate the transformation towards a sustainable society 2022/Sustainability strategy and economy. This transformation affects the bank’s relationship with its stakeholders. and implementation Clients need advice, products, and services to make progress in their transformation journeys. Investors increasingly want to entrust their capital to companies with a credible Code of Conduct: sustainability strategy. Following clear guidance for sustainability is one cornerstone of Sustainability and human attracting people who expect their employer to act decisively and to be purpose driven. rights Finally, society values businesses that act as responsible corporate citizens. Deutsche Bank’s sustainability principles are anchored in the bank’s Code of Conduct, which it expects all employees to adhere to. The principles express the bank’s ambition to consider the long-term effects of its activities and to generate sustainable value for its clients, employees, investors, and society at large. Sustainability, which encompasses environmental, social, and governance (ESG) aspects, is a central component of Deutsche Bank’s “Global Hausbank” strategy. In 2022, the bank continued to embed sustainability into its products, policies, and processes, focusing on the four pillars: Sustainable Finance, Policies and Commitments, People and Own Operations as well as Thought Leadership and Stakeholder Engagement. Making progress along these pillars will enable the bank to maximize its contribution to the achievement of the Paris Climate Agreement’s targets and the United Nations (UN) Sustainable Development Goals (SDGs). Although the bank contributes indirectly to all 17 SDGs, as part of its sustainability strategy the focus is on SDG 4, 5, 7, 8, 9, 11, 13, and 17 which are particularly close to its business activity. To underpin its long-standing commitment to sustainability, Deutsche Bank formally endorsed universal sustainability frameworks and initiatives as well as international standards and principles, including – Ten principles of the UN Global Compact – Principles for Responsible Investment (through DWS) – Principles for Responsible Banking – Net-Zero Banking Alliance – International Labor Organization (ILO) Declaration on Fundamental Principles and Rights at Work including the ILO Core Labor Standards – UN Guiding Principles on Business and Human Rights – Universal Declaration of Human Rights Principle 2: Impact and Target Setting We will continuously increase our positive impacts while reducing the negative impacts on, and managing the risks to, people and environment resulting from our activities, products and services. To this end, we will set and publish targets where we can have the most significant impacts. 155
Deutsche Bank Appendix Non-Financial Report 2022 Principles for Responsible Banking 2.1 Impact Analysis (Key Step 1) Show that your bank has performed an impact analysis of its portfolio/s to identify its most significant impact areas and 1 determine priority areas for target-setting. The impact analysis shall be updated regularly and fulfil the following 2 requirements/elements (a-d) : a) Scope: What is the scope of your bank’s impact analysis? Please describe which parts of the bank’s core business areas, products/services across the main geographies that the bank operates in (as described under 1.1) have been considered in the impact analysis. Please also describe which areas have not yet been included, and why. Response Links and references – Deutsche Bank’s management of climate risks is part of its broader sustainability Non-Financial Report 2022: strategy and supports the commitment to align the bank’s portfolio with net zero by Climate risk/Risk identification 2050. In 2022, Deutsche Bank continued to embed climate risks into its risk and materiality assessment management frameworks, processes and appetite – Deutsche Bank has conducted a comprehensive materiality assessment of climate and other environmental risks to identify key impacts across potentially affected risk types. The drivers considered in the analysis were climate transition risks arising from policy, technology and behavioral changes, acute and chronic physical risks and other environmental risks. The impact assessment uses a combination of stress test results, other scenario and sensitivity analysis and qualitative expert judgement. The risk drivers covered in the materiality assessment are used to integrate climate risk considerations into the risk identification process which functions as a basis for the group risk inventory. For details, please see the “Climate risk” chapter. b) Portfolio composition: Has your bank considered the composition of its portfolio (in %) in the analysis? Please provide proportional composition of your portfolio globally and per geographical scope i) by sectors & industries3 for business, corporate and investment banking portfolios (i.e., sector exposure or industry breakdown in %), and/or ii) by products & services and by types of customers for consumer and retail banking portfolios. If your bank has taken another approach to determine the bank’s scale of exposure, please elaborate, to show how you have considered where the bank’s core business/major activities lie in terms of industries or sectors. Response Links and references Deutsche Bank considered the composition of its global corporate lending portfolio in Non-Financial Report 2022: determining the sectors in scope of its initial decarbonization targets (Oil & Gas, Power Climate risk/Risk management Generation, Automotive and Steel). The breakdown of the global portfolio is reported in framework; Risk metrics and the “Climate risk” chapter of this report. targets; table “Loan exposure and financed emissions of the As a founding member of the Net-Zero Banking Alliance, Deutsche Bank aims at corporate lending book” publishing targets for additional highly carbon intensive sectors in the course of 2023. c) Portfolio composition: What are the main challenges and priorities related to sustainable development in the main 4 countries/regions in which your bank and/or your clients operate? Please describe how these have been considered, including what stakeholders you have engaged to help inform this element of the impact analysis. This step aims to put your bank’s portfolio impacts into the context of society’s needs. 1 That means that where the initial impact analysis has been carried out in a previous period, the information should be updated accordingly, the scope expanded as well as the quality of the impact analysis improved over time. 2 Further guidance can be found in the Interactive Guidance on impact analysis and target setting. 3 ‘Key sectors’ relative to different impact areas, i.e. those sectors whose positive and negative impacts are particularly strong, are particularly relevant here. 4 Global priorities might alternatively be considered for banks with highly diversified and international portfolios. 156
Deutsche Bank Appendix Non-Financial Report 2022 Principles for Responsible Banking Response Links and references In analyzing the impact of its portfolio Deutsche Bank has not yet considered the main challenges and priorities related to sustainable development on a country/regional level Based on these first 3 elements of an impact analysis, what positive and negative impact areas has your bank identified? 5 Which (at least two) significant impact areas did you prioritize to pursue your target setting strategy (see 2.2) ? Please disclose. Response Links and references Deutsche Bank considers climate change (mitigation and adaption) as a significant impact area. d) For these (min. two prioritized impact areas): Performance measurement: Has your bank identified which sectors & industries as well as types of customers financed or invested in are causing the strongest actual positive or negative impacts? Please describe how you assessed the performance of these, using appropriate indicators related to significant impact areas that apply to your bank’s context. In determining priority areas for target-setting among its areas of most significant impact, you should consider the bank’s current performance levels, i.e., qualitative and/or quantitative indicators and/or proxies of the social, economic and environmental impacts resulting from the bank’s activities and provision of products and services. If you have identified climate and/or financial health & inclusion as your most significant impact areas, please also refer to the applicable indicators in the Annex. If your bank has taken another approach to assess the intensity of impact resulting from the bank’s activities and provision of products and services, please describe this. The outcome of this step will then also provide the baseline (incl. indicators) you can use for setting targets in two areas of most significant impact. Response Links and references The key metrics used to assess transition risk in the bank’s portfolios are carbon intensity Non-Financial Report 2022: and financed emissions. The bank estimates and monitors these metrics using the Climate risk/Risk metrics and standard from the Partnership for Carbon Accounting Financials (PCAF) and in line with targets the recommendations of the Task Force on Climate-related Financial Disclosures (see TCFD Proposed Guidance on Climate-related Metrics, Targets, and Transition Plans). The analysis is based on disclosed Scope 1 and 2 emissions of Deutsche Bank’s clients, for which the bank often relies on third-party providers, and on sectoral average emission factors where client data are not available. This emissions data was mapped to the bank’s loan exposure and clients’ enterprise values to estimate financed emissions and carbon intensity at client and portfolio level. For selected mortgage and commercial real estate portfolios, emissions are estimated using proxies based on Energy Performance Certificate ratings and internal methodologies. In 2022, the bank disclosed the overall corporate industry loan exposure, as well as loan exposure and financed emissions for the four key carbon intensive sectors Oil and gas, Utilities, Steel, Metals and Mining, and Automotive. Three of the sectors (Oil & Gas, Power Generation and Steel) chosen for the bank’s initial decarbonization targets account for a significant proportion of the bank’s financed emissions, estimated based on the approach described above. Automotive was included, as it was identified as a key source of global Scope 3 emissions in the bank’s portfolio and its relevance in the bank’s portfolio as well as the significance of the sector’s overall Scope 3 emissions. 5To prioritize the areas of most significant impact, a qualitative overlay to the quantitative analysis as described in a), b) and c) will be important, e.g. through stakeholder engagement and further geographic contextualisation. 157
Deutsche Bank Appendix Non-Financial Report 2022 Principles for Responsible Banking Self-assessment summary: Which of the following components of impact analysis has your bank completed, in order to identify the areas in which your bank has its most significant (potential) positive and negative impacts?6 Scope: ☒ Yes ☐ In progress ☐ No Portfolio composition: ☒ Yes ☐ In progress ☐ No Context: ☐ Yes ☐ In progress ☒ No Performance measurement: ☒ Yes ☐ In progress ☐ No Which most significant impact areas have you identified for your bank, as a result of the impact analysis? Climate change mitigation, climate change adaptation How recent is the data used for and disclosed in the impact analysis? ☒ Up to 6 months prior to publication ☐ Up to 12 months prior to publication ☐ Up to 18 months prior to publication ☐ Longer than 18 months prior to publication Open text field to describe potential challenges, aspects not covered by the above etc.: (optional) 6 You can respond “Yes” to a question if you have completed one of the described steps, e.g. the initial impact analysis has been carried out, a pilot has been conducted. 158
Deutsche Bank Appendix Non-Financial Report 2022 Principles for Responsible Banking 2.2 Target Setting (Key Step 2) Show that your bank has set and published a minimum of two targets which address at least two different areas of most significant impact that you identified in your impact analysis. The targets7 have to be Specific, Measurable (qualitative or quantitative), Achievable, Relevant and Time-bound (SMART). Please disclose the following elements of target setting (a-d), for each target separately: a) Alignment: which international, regional or national policy frameworks to align your bank’s portfolio with8 have you identified as relevant? Show that the selected indicators and targets are linked to and drive alignment with and greater contribution to appropriate Sustainable Development Goals, the goals of the Paris Agreement, and other relevant international, national or regional frameworks. You can build upon the context items under 2.1. Response Links and references Deutsche Bank supports the European Commission’s Action Plan on sustainable finance Non-Financial Report 2022: as a crucial contribution toward the European Union’s achievement of its Paris Agreement Sustainable finance climate targets and its wider sustainability agenda. This is in line with the bank signing the Paris Pledge for Action in 2015. The bank also supports the European Union pledge to Non-Financial Report 2022: become climate-neutral by 2050, e. g. transition to an economy with net-zero greenhouse Climate risk gas emissions. Deutsche Bank is a founding signatory to the Net-Zero Banking Alliance, committing to align the operational and attributable emissions from its portfolios with pathways to net- zero by 2050 or sooner. b) Baseline: Have you determined a baseline for selected indicators and assessed the current level of alignment? Please disclose the indicators used as well as the year of the baseline. You can build upon the performance measurement undertaken in 2.1 to determine the baseline for your target. A package of indicators has been developed for climate change mitigation and financial health & inclusion to guide and support banks in their target setting and implementation journey. The overview of indicators can be found in the Annex of this template. If your bank has prioritized climate mitigation and/or financial health & inclusion as (one of) your most significant impact areas, it is strongly recommended to report on the indicators in the Annex, using an overview table like below including the impact area, all relevant indicators and the corresponding indicator codes: Impact area Indicator code Response Climate change A 1.1. Yes mitigation A 1.2 Yes; Achieve net-zero carbon emissions by 2050 at the latest; emission baseline 2021 A 1.3. In progress A 1.4. Deutsche Bank’s net zero targets cover sectors accounting for a significant proportion of financed emissions of corporate loan book as well as key sources of global Scope 3 emissions of clients. A 1.5. Yes; Deutsche Bank offers a comprehensive suite of sustainable finance products and services which includes all types of lending across Strategic Corporate Lending, Lending, Structured and Export Finance, Natural Resource Finance and Trade Finance Flow including Supply Chain Finance programs, green and sustainable bonds, ESG-linked loans, ESG-linked derivates, long-term financing to microenterprises and SMEs, sustainability package containing financing solutions and 7 Operational targets (relating to for example water consumption in office buildings, gender equality on the bank’s management board or business-trip related greenhouse gas emissions) are not in scope of the PRB. 159
Deutsche Bank Appendix Non-Financial Report 2022 Principles for Responsible Banking supporting services for energy-efficient refurbishment. For details please see the “Sustainable finance” chapter). A 2.1. Setting it up A 2.2. Absolute financed emissions/Total GHG emissions or CO2e A 2.3. Sector-specific emission intensity A 2.4. Proportion of financed emissions covered by a decarbonization target A 3.1. In 2022, Deutsche Bank achieved a cumulative sustainable financing and investments volume of € 215 billion (excluding DWS), thus outperforming its target of at least € 200 billion by year end 2022. The volume includes financing, bond issuance and sustainable assets under management in the Private Bank facilitated since January 1, 2020. The ESG assets managed by the AM division, which operates under the brand DWS, are not included in this figure as DWS operates as a separate legal entity that set its own sustainability strategy. For details, please see the “Sustainable finance” chapter). A 3.2. For details please see “Climate risk/Risk metrics and targets” chapter. A 4.1. For details please see “Climate risk/Risk metrics and targets” chapter A 4.2. % of portfolio aligned with Paris Climate Agreement Impact area Indicator code Response … Financial health & inclusion … … In case you have identified other and/or additional indicators as relevant to determine the baseline and assess the level of alignment towards impact driven targets, please disclose these. Response Links and references A baseline has been determined for all the bank’s initial decarbonization targets. The Non-Financial Report 2022: metrics used for the target: Climate risk/Risk management framework; Risk metrics and – Oil & Gas: absolute financed emission, MtCOe; baseline year 2021 targets; table “Alignment to net- – Power Generation: emission intensity, kgCO2e/MWh zero targets” – Automotive: emission intensity, gCO2/vehicle km – Steel: emission intensity, kgCO2e/t steel The baseline year for all decarbonization targets is 2021. Baseline values of the metrics and % reduction of each target is reported in the Climate risk chapter of this report. c) SMART targets (incl. key performance indicators (KPIs)9): Please disclose the targets for your first and your second area of most significant impact, if already in place (as well as further impact areas, if in place). Which KPIs are you using to monitor progress towards reaching the target? Please disclose. 8 Your bank should consider the main challenges and priorities in terms of sustainable development in your main country/ies of operation for the purpose of setting targets. These can be found in National Development Plans and strategies, international goals such as the SDGs or the Paris Climate Agreement, and regional frameworks. Aligning means there should be a clear link between the bank’s targets and these frameworks and priorities, therefore showing how the target supports and drives contributions to the national and global goals. 9 Key Performance Indicators are chosen indicators by the bank for the purpose of monitoring progress towards targets. 160
Deutsche Bank Appendix Non-Financial Report 2022 Principles for Responsible Banking Response Links and references Align the operational and attributable emissions from its portfolios with pathways to net- Non-Financial Report 2022: zero by 2050 or sooner: Climate risk/Risk metrics and targets”; table “Alignment to net- Deutsche Bank’s targets cover sectors accounting for a significant proportion of financed zero targets” emissions of its corporate loan book as well as key sources of global Scope 3 emissions of clients. Targets for each sector are as follows: – Oil & Gas (Upstream): 23% reduction in Scope 3 upstream financed emissions by 2030, and 90% reduction by 2050, in millions tones of CO 2 – Power generation: 69% reduction in Scope 1 physical emission intensity by 2030 and 100% reduction by 2050, in kilograms of CO2 equivalent per megawatt hour – Automotive (light duty vehicles): 59% reduction in tailpipe emission intensity by 2030 and 100% reduction by 2050, in grammes of CO per vehicle kilometer 2 – Steel: 33% reduction in Scope 1 and 2 physical emission intensity by 2030 and 90% reduction by 2050, in kilograms of CO equivalent per tone 2 Throughout 2023, the bank aims to further expand net zero target-setting to other carbon- intensive sectors. d) Action plan: which actions including milestones have you defined to meet the set targets? Please describe. Please also show that your bank has analyzed and acknowledged significant (potential) indirect impacts of the set targets within the impact area or on other impact areas and that it has set out relevant actions to avoid, mitigate, or compensate potential negative impacts. Response Links and references In line with its Net-Zero Banking Alliance commitment, Deutsche Bank set up interim Non-Financial Report 2022: targets for 2030 and targets for 2050, which will enable the bank and its stakeholders to Climate risk/Risk metrics and meaningfully monitor progress from the early years of implementation. targets”; table “Alignment to net- Targets and metrics are fully integrated into the Group-wide risk management framework zero targets” and appetite, through which Deutsche Bank will monitor and steer its in-scope portfolios towards alignment. Furthermore, Deutsche Bank’s Environmental and Social Policy Non-Financial Report 2022: Framework, including outlines specific restrictions and escalation requirements for sectors Environmental and social due with an inherent elevated potential for environmental and social impacts. Moreover, the diligence/Environmental and bank established a Net Zero Forum, responsible for the oversight and assessment of new Social Policy Framework transactions with a significant impact on the bank’s financed emissions and / or net zero targets. Members of the forum are senior representatives from business divisions, Risk Non-Financial Report 2022: and the Chief Sustainability Office. The Net Zero Forum will also enable the organization Climate risk/Governance to monitor and oversee potential indirect impacts of the set targets. Furthermore, in line with the Bank’s Net-Zero Banking Alliance commitments, Deutsche Bank will publish a comprehensive transition plan by October 2023. Self-assessment summary Which of the following components of target setting in line with the PRB requirements has your bank completed or is currently in a process of assessing for your… … first area of most … second area of most (If you are setting targets in significant impact: … (please significant impact: … (please more impact areas) …your name it) name it) third (and subsequent) area(s) of impact: … (please name it) 161
Deutsche Bank Appendix Non-Financial Report 2022 Principles for Responsible Banking Alignment x Yes ☐ Yes ☐ Yes ☐ In progress ☐ In progress ☐ In progress ☐ No ☐ No ☐ No Baseline x Yes ☐ Yes ☐ Yes ☐ In progress ☐ In progress ☐ In progress ☐ No ☐ No ☐ No SMART targets x Yes ☐ Yes ☐ Yes ☐ In progress ☐ In progress ☐ In progress ☐ No ☐ No ☐ No Action plan ☐ Yes ☐ Yes ☐ Yes x In progress ☐ In progress ☐ In progress ☐ No ☐ No ☐ No 2.4 Target implementation and monitoring (Key Step 2) For each target separately: Show that your bank has implemented the actions it had previously defined to meet the set target. Report on your bank’s progress since the last report towards achieving each of the set targets and the impact your progress resulted in, using the indicators and KPIs to monitor progress you have defined under 2.2. nd Or, in case of changes to implementation plans (relevant for 2 and subsequent reports only): describe the potential changes (changes to priority impact areas, changes to indicators, acceleration/review of targets, introduction of new milestones or revisions of action plans) and explain why those changes have become necessary. Response Links and references In 2022, Deutsche Bank further enhanced its sustainability governance. This helps to Non-Financial Report 2022: manage, measure, and control sustainability activities across divisions, and regions and Sustainability strategy and allows for compliance with relevant environmental and social regulations. Deutsche Bank implementation/Sustainability appointed a Chief Sustainability Officer and broadened its sustainability governance by governance establishing a Sustainability Strategy Steering Committee responsible for sustainability transformation management and oversight. Non-Financial Report 2022: Climate risk/Governance The bank continued to embed climate risks into its business-as-usual risk management frameworks, processes and appetite, prioritizing areas with the highest potential impact Non-Financial Report 2022: based on comprehensive materiality assessment and integration into the risk identification Corporate Governance process. Non-financial criteria form part of our top-level executives’ compensation. The variable compensation components are linked to several ESG targets, including the volumes of sustainable financing and investments, reducing the power consumption in our own buildings, and a ESG rating index. 162
Deutsche Bank Appendix Non-Financial Report 2022 Principles for Responsible Banking Principle 3: Clients and Customers We will work responsibly with our clients and our customers to encourage sustainable practices and enable economic activities that create shared prosperity for current and future generations. 3.1 Client engagement Does your bank have a policy or engagement process with clients and customers10 in place to encourage sustainable practices? ☒ Yes ☐ In progress ☐ No Does your bank have a policy for sectors in which you have identified the highest (potential) negative impacts? ☒ Yes ☐ In progress ☐ No Describe how your bank has worked with and/or is planning to work with its clients and customers to encourage sustainable practices and enable sustainable economic activities11). It should include information on relevant policies, actions planned/implemented to support clients’ transition, selected indicators on client engagement and, where possible, the impacts achieved. This should be based on and in line with the impact analysis, target-setting and action plans put in place by the bank (see P2). Response Links and references “Client centricity” and “Sustainable performance” are core values articulated in Deutsche Code of Conduct – Our values Bank’s Code of Conduct (the Code). The Code enjoins all the bank’s business divisions— and beliefs Corporate Bank, Investment Bank, Private Bank, and Asset Management—to treat clients responsibly and with integrity at all times. In addition, laws and regulations like the MiFID II Non-Financial Report 2022: require the bank to put various processes and control mechanisms in place. These help Culture, integrity and conduct identify issues related to product design and advisory principles early and define action areas. Non-Financial Report 2022: Product responsibility/ The bank’s product line’s minimum standards oblige it to offer transparent products and Product suitability and services based on processes and principles designed to comply with legal and regulatory appropriateness requirements. For example, the bank’s product governance policies require it to monitor whether products have only been sold to the appropriate client group. In addition, Deutsche Non-Financial Report 2022: Bank strives to offer clients prudent and foresightful advice that meets their needs and Sustainable finance/Private makes them aware of potential opportunities and risks. The bank assesses a variety of Bank Germany parameters, including a product’s complexity as well as each client’s product knowledge, experience, regulatory classification and investment objectives. Furthermore, the Private Bank Germany introduced an ESG advisory concept in all 400 Deutsche Bank branches and seven regional advisory centers. The ESG advisory concept comprises a broad qualification program for employees and aims at increasing clients’ sustainability awareness through visible design elements. 3.2 Business opportunities Describe what strategic business opportunities in relation to the increase of positive and the reduction of negative impacts your bank has identified and/or how you have worked on these in the reporting period. Provide information on existing products and services , information on sustainable products developed in terms of value (USD or local currency) and/or as a % of your portfolio, and which SDGs or impact areas you are striving to make a positive impact on (e.g. green mortgages – climate, social bonds – financial inclusion, etc.). Response Links and references Deutsche Bank acknowledges the role it plays in facilitating the transition toward sustainable growth and a low-carbon economy. The bank aspires to support its clients in their 163
Deutsche Bank Appendix Non-Financial Report 2022 Principles for Responsible Banking transformation with its financial expertise and product offerings on their path to a more Non-Financial Report 2022/ sustainable and climate-neutral way of doing business. Developing its business towards Sustainable Finance/ sustainable finance as well as setting guidelines for doing its business responsibly are Sustainability targets central pillars of the bank’s sustainability strategy. Deutsche Bank has set the target of achieving a cumulative sustainable financing and investment volume since January 2020 of Non-Financial Report 2022: at least € 200 billion by end of 2022 and € 500 billion by the end of 2025 (excluding DWS). Environmental and social due By end of 2022, the bank achieved a cumulative sustainable financing and investments diligence/Environmental and volume of € 215 billion, thus outperforming its 2022 target. The bank describes in detail the Social Policy Framework progress the bank made in 2022 in implementing its sustainable finance target, including information on its sustainable products and services, portfolio splits, contribution to the SDGs and examples of the bank’s partnerships with clients to support them in their transition in the “Sustainable Finance” chapter of this report. The bank also scrutinizes its business activities for potential negative impacts and understand the environmental and social risks associated with a transaction or a client. Robust frameworks and systematic risk evaluation are integral to the bank’s risks management processes. The bank’s environmental and social due diligence provisions are an integral part of the bank’s Reputational Risk Framework. The provisions consist of cross- sectoral and sector-specific requirements outlined in respective guidelines and they jointly form the Deutsche Bank Environmental and Social Policy Framework. A summary of the Framework is publicly available von the bank’s website. For example, in 2022, the bank continued to conduct transactional and client reviews pursuant to the bank’s Environmental and Social Policy Framework as well as its Sustainable Finance standards. The bank’s environmental and social due diligence provisions and respective processes are described in detail in the “Environmental and Social Due Diligence” chapter of this report. Principle 4: Stakeholders We will proactively and responsibly consult, engage and partner with relevant stakeholders to achieve society’s goals. 10 A client engagement process is a process of supporting clients towards transitioning their business models in line with sustainability goals by strategically accompanying them through a variety of customer relationship channels. 11 Sustainable economic activities promote the transition to a low-carbon, more resource-efficient and sustainable economy. 164
Deutsche Bank Appendix Non-Financial Report 2022 Principles for Responsible Banking 4.1 Stakeholder identification and consultation Does your bank have a process to identify and regularly consult, engage, collaborate and partner with stakeholders (or stakeholder groups12) you have identified as relevant in relation to the impact analysis and target setting process? ☐ Yes ☒ In progress ☐ No Please describe which stakeholders (or groups/types of stakeholders) you have identified, consulted, engaged, collaborated or partnered with for the purpose of implementing the Principles and improving your bank’s impacts. This should include a high-level overview of how your bank has identified relevant stakeholders, what issues were addressed/results achieved and how they fed into the action planning process. 12 Such as regulators, investors, governments, suppliers, customers and clients, academia, civil society institutions, communities, representatives of indigenous population and non-profit organizations 165
Deutsche Bank Appendix Non-Financial Report 2022 Principles for Responsible Banking Response Links and references Deutsche Bank attaches importance to a fair and open exchange with all its stakeholder Non-Financial Report 2022: groups. The bank wants to understand their expectations and concerns regarding our Stakeholder engagement and business activities and social responsibility to maximize its positive and minimize potential thought leadership negative impacts. Deutsche Bank’s core stakeholders belong to the following groups: clients, employees, investors, regulators, and society at large, including e. g. media and non-governmental organizations. The bank has clearly defined responsibilities toward each stakeholder group. Mandates for interaction are delegated to the respective business division or infrastructure function. They use a variety of formats to engage with stakeholders. In addition, a materiality assessment helps identify its stakeholders’ sentiment on the topics they regard as most relevant to the bank. – Deutsche Bank engages with its clients in many ways, including for example, personal or virtual meetings, calls, regular surveys, and the analysis of feedback it receives e. g. via its branches or hotlines. Deutsche Bank representatives are involved in discussions at various conferences and events. The bank also communicates via digital communication channels and publishes papers on sustainability topics. Climate change and the transition of the global economy towards sustainability remained an important topic for clients in the Corporate Bank and Investment Bank as well as investors, keeping the interest in sustainable finance products and services at a high level. Private clients requested best-in-class transparency and ESG advisory and shifted their behavior strongly towards digital channels. – The bank's annual employee survey, exit- and pulse-surveys, and ongoing dialogue with employees help to understand employee motivation and their perceived productivity. Various communication channels such as team meetings, staff networks, e-mails, newsletters, townhall events and the opportunity to comment on intranet sites encourage the Bank's employees to express their opinions and provide feedback. – Deutsche Bank discusses sustainability-related risks and opportunities with its private and institutional investors in one-on-one meetings and calls. The bank hosts investor and sustainability deep dives and invites shareholders to its annual general meeting. Furthermore, the bank uses digital communication channels and publishes quarterly and annual reports on the bank’s financial and non-financial performance. In 2022, the following topics were relevant for investors: progress in the implementation of the bank's sustainability strategy, in particular the management of climate risks, the bank's environmental policies and reporting; sustainable finance, decarbonization pathways and the promotion of gender diversity, equality and participation. – Deutsche Bank engages with regulators and governments via in-person and virtual meetings, participation in government-led forums, or responding to consultations through ndividually. The bank convened and participated in seminars and trade associations or i public panels, held conversations with policymakers on each of the issues mentioned above. Key regulatory issues in 2022 included the digitization of banking and society and the European Commission’s Sustainable Finance Agenda. – Deutsche Bank wants to maintain constructive relationships with journalists and media representatives worldwide. Timely, effective, and open communication with the media is essential for reputation and Deutsche Bank’s brand. Dialogue with media representatives focuses on key issues driven by business, investors, regulators and society in general. One important topic is sustainability. – Deutsche Bank engages with stakeholders from broader society to understand their views on global environmental and social trends and challenges. For example, the bank continually engages with non-governmental organizations and participates in numerous sustainability-related initiatives. In 2022, Deutsche Bank responded to written requests, surveys, or questionnaires, and met non-governmental organizations in person to discuss the themes of their engagement. 166
Deutsche Bank Appendix Non-Financial Report 2022 Principles for Responsible Banking Principle 5: Governance & Culture We will implement our commitment to these Principles through effective governance and a culture of responsible banking 5.1 Governance Structure for Implementation of the Principles Does your bank have a governance system in place that incorporates the PRB? ☒ Yes ☐ In progress ☐ No Please describe the relevant governance structures, policies and procedures your bank has in place/is planning to put in place to manage significant positive and negative (potential) impacts and support the effective implementation of the Principles. This includes information about – which committee has responsibility over the sustainability strategy as well as targets approval and monitoring (including information about the highest level of governance the PRB is subjected to), – details about the chair of the committee and the process and frequency for the board having oversight of PRB implementation (including remedial action in the event of targets or milestones not being achieved or unexpected negative impacts being detected), as well as – remuneration practices linked to sustainability targets. 167
Deutsche Bank Appendix Non-Financial Report 2022 Principles for Responsible Banking Response Links and references Deutsche Bank established a comprehensive sustainability governance to manage, Non-Financial Report 2022: measure and control sustainability activities across the bank. The most senior forum and Sustainability strategy and main governance body is the Group Sustainability Committee, which was created in 2020 implementation/ Sustainability and is chaired by the bank’s Chief Executive Officer. It consists of Management Board governance members, and the heads of the bank’s business divisions (GMC members) as well as infrastructure functions. The committee acts as senior decision-making body for Non-Financial Report 2022: sustainability-related matters on group level. Its “run the bank”-mandate has oversight of Climate Risk/Governance sustainability strategy implementation across divisions and also ensures alignment of the sustainability strategy with the client centric pillar of the bank’s corporate strategy. Non-Financial Report 2022: Environmental and social due The Group Risk Committee (GRC), chaired by the Chief Risk Officer, is established by the diligence/Environmental and Management Board to serve as the central forum for review and decision making on matters Social Policy Framework related to risk, capital, and liquidity. This includes the responsibility for developing the bank’s committees of the GRC are Climate Risk Framework. A number of delegated sub- responsible for the development and management of specific elements of climate risk: The Enterprise Risk Committee (ERC), which is composed of senior risk experts from various risk disciplines, focuses on enterprise-wide risk trends, events, and cross-risk portfolios. The ERC oversees the development of the bank’s holistic climate risk management framework. The Non-Financial Risk Committee (NFRC) which oversees, governs and coordinates the management of non-financial risks group-wide and establishes a cross-risk and holistic perspective of the bank’s key non-financial risks, including risks to own infrastructure, employees, and key processes including those arising from climate risks The Group Reputational Risk Committee (GRRC), which is responsible for the oversight, governance, and coordination of reputational risk management, including potential reputational risks arising from transactions linked to climate (and broader environmental and social) issues. Robust frameworks and systematic risk evaluation are integral to the bank’s risks management processes. Regarding environmental and social risks, the bank’s management process is summarized in the Environmental and Social Policy Framework. The Framework in turn is an integral part of the bank’s Reputational Risk Framework. The degree to which ESG targets are met is among the assessment criteria used to calculate the bank’s top executives’ performance-based compensation 5.2 Promoting a culture of responsible banking: Describe the initiatives and measures of your bank to foster a culture of responsible banking among its employees (e.g., capacity building, e-learning, sustainability trainings for client-facing roles, inclusion in remuneration structures and performance management and leadership communication, amongst others). Response Links and references Deutsche Bank expects its employees to conduct themselves ethically at all times, to adhere Non-Financial Report 2022: to company policies and procedures, and to comply with all applicable laws and regulations. Culture, integrity, and conduct The bank’s core values—integrity, sustainable performance, client centricity, innovation, Non-Financial Report 2022: discipline, and partnership—are articulated in the bank’s Code of Conduct. Its purpose is to Sustainable finance/Training guide employees’ interactions with each other as well as the bank’s dealings with its clients, and awareness competitors, shareholders, business partners, government and regulatory authorities, and society at large. The Code is also designed to foster an open, diverse, and inclusive environment in which the bank’s employees understand what the bank expects of them. It also serves as the foundation for company policies, provides guidance on legal and regulatory compliance, and helps the bank achieve its corporate purpose. Deutsche Bank actively encourages employees to report, without fear of retaliation, any potential 168
Deutsche Bank Appendix Non-Financial Report 2022 Principles for Responsible Banking misconduct, inappropriate behavior, serious conduct risk, and related concerns or suspicions. The bank believes it is vital that everyone understands the financial implications of ESG issues and is aware of the steps governments and regulators are taking to address these problems and how they will impact business and clients. Training is essential to raise the bank’s employees’ awareness and enable them to better identify environmental and social risks and opportunities and consequently assess and refer transactions to Group Sustainability. In 2022, Deutsche Bank continued its related employee training program. In 2022 front-office staff continued to receive live video-training to enable them to understand the Sustainable Finance Framework and to identify opportunities for clients to transition to more sustainable and climate friendlier business models. Following the target to offer training on the bank’s taxonomy to 100% of the relevant front-office staff in the Investment Bank, Corporate Bank and Private Bank by the end of 2022, a Sustainable Finance training has been integrated into the bank’s internal training platform “Connect2Learn”. The sessions also address environmentally and socially related exclusions and expectations and specify the requirements for ES due diligence. Training on and implementation of the Equator Principles continued in 2022, the second year of the bank’s implementation. In 2022, the bank also continued to provide awareness sessions and training to control functions and business teams to reinforce their awareness of reputational risks such as defense and gaming. Non-financial criteria form part of our top-level executives’ compensation. The variable compensation components are linked to several ESG targets, including the volumes of sustainable financing and ESG investments, reducing the power consumption in our own buildings, and a ESG rating index. 5.3 Policies and due diligence processes Does your bank have policies in place that address environmental and social risks within your portfolio?13 Please describe. Please describe what due diligence processes your bank has installed to identify and manage environmental and social risks associated with your portfolio. This can include aspects such as identification of significant/salient risks, environmental and social risks mitigation and definition of action plans, monitoring and reporting on risks and any existing grievance mechanism, as well as the governance structures you have in place to oversee these risks. Response Links and references Deutsche Bank’s environmental and social due diligence provisions are an integral part of Non-Financial Report 2022: the bank’s Reputational Risk Framework. The environmental and social due diligence Environmental and social due provisions consist of cross-sectoral and sector-specific requirements outlined in respective diligence/Environmental and guidelines and they jointly form the Deutsche Bank Environmental and Social Policy Social Policy Framework Framework. A summary of this Framework is publicly available. It applies to lending and trade finance activities of Corporate Bank and lending and capital market activities of Non-Financial Report 2022: Investment Bank as well as to Private Bank’s commercial lending activities. It defines rules Human rights and responsibilities for risk identification, assessment, and decision-making, describes how y companies with a controversial to conduct deal independent risk screening and to identif ES profile, and specifies the requirements for ES due diligence. Deutsche Bank focusses its attention on sectors that it has defined as sensitive and familiarizes its employees with the criteria for the mandatory referral of risks to the bank’s Group Sustainability function. Employees have access to detailed sector-specific guidelines for all sectors requiring mandatory referral to Group Sustainability. ES issues deemed to pose at least a moderate reputational risk are subject to the reputational risk assessment process as well. In order to identify, prevent and mitigate adverse human rights impacts, the bank has integrated human rights considerations in its environmental and social due diligence process, e.g., land rights and cultural heritage, labor and child rights, health and safety of workers and communities, and the rights of indigenous people. 13 Applicable examples of types of policies are: exclusion policies for certain sectors/activities; zero-deforestation policies; zero-tolerance policies; gender-related policies; social due diligence policies; stakeholder engagement policies; whistle-blower policies etc., or any applicable national guidelines related to social risks. 169
Deutsche Bank Appendix Non-Financial Report 2022 Principles for Responsible Banking Self-assessment summary Does the CEO or other C-suite officers have regular oversight over the implementation of the Principles through the bank’s governance system? X Yes ☐ No Does the governance system entail structures to oversee PRB implementation (e.g. incl. impact analysis and target setting, actions to achieve these targets and processes of remedial action in the event targets/milestones are not achieved or unexpected neg. impacts are detected)? x Yes ☐ No Does your bank have measures in place to promote a culture of sustainability among employees (as described in 5.2)? x Yes ☐ In progress ☐ No Principle 6: Transparency & Accountability We will periodically review our individual and collective implementation of these Principles and be transparent about and accountable for our positive and negative impacts and our contribution to society’s goals. 6.1 Assurance Has this publicly disclosed information on your PRB commitments been assured by an independent assurer? ☐ Yes ☐ Partially ☒ No If applicable, please include the link or description of the assurance statement. Response Links and references 6.2 Reporting on other frameworks Does your bank disclose sustainability information in any of the listed below standards and frameworks? ☒ GRI ☒ SASB ☒ CDP ☐ IFRS Sustainability Disclosure Standards (to be published) ☒ TCFD ☐ Other: …. Response Links and references 6.3 Outlook 170
Deutsche Bank Appendix Non-Financial Report 2022 Principles for Responsible Banking What are the next steps your bank will undertake in next 12 month-reporting period (particularly on impact analysis14, target setting15 and governance structure for implementing the PRB)? Please describe briefly. Response Links and references Deutsche Bank will continue to work on implementing its sustainability strategy "From aspiration to impact" in order to increase its contribution to achieving the goals of the Paris Climate Agreement and the Sustainable Development Goals. In doing so, the bank will also gradually fulfill its voluntary commitment to the Principles for Responsible Banking. 6.4 Challenges Here is a short section to find out about challenges your bank is possibly facing regarding the implementation of the Principles for Responsible Banking. Your feedback will be helpful to contextualise the collective progress of PRB signatory banks. What challenges have you prioritized to address when implementing the Principles for Responsible Banking? Please choose what you consider the top three challenges your bank has prioritized to address in the last 12 months (optional question). If desired, you can elaborate on challenges and how you are tackling these: ☐ Embedding PRB oversight into governance ☐ Customer engagement ☐ Gaining or maintaining momentum in the bank ☐ Stakeholder engagement ☐ Getting started: where to start and what to focus on in the ☐ Data availability beginning ☐ Data quality ☒ Conducting an impact analysis ☐ Access to resources ☐ Assessing negative environmental and social impacts ☐ Reporting ☐ Choosing the right performance measurement methodology/ies ☐ Assurance ☐ Setting targets ☐ Prioritizing actions internally ☐ Other: … If desired, you can elaborate on challenges and how you are tackling these: 14 For example outlining plans for increasing the scope by including areas that have not yet been covered, or planned steps in terms of portfolio composition, context and performance measurement 15 For example outlining plans for baseline measurement, developing targets for (more) impact areas, setting interim targets, developing action plans etc. 171
Deutsche Bank Appendix Non-Financial Report 2022 Imprint/Publications Imprint/Publications Deutsche Bank Aktiengesellschaft Taunusanlage 12 60325 Frankfurt am Main (for letters and postcards: 60262) Germany Telephone: +49 69 910-00 deutsche.bank@db.com Contact For ESG related questions: mailbox.sustainability@db.com For other questions: db.ir@db.com Feedback from Deutsche Bank’s stakeholders improves further development of the non-financial reporting. The bank looks forward to new impetus and your opinion. Publications Publications relating to the financial statements Annual Report 2022 (German / English) Annual Financial Statements of Deutsche Bank AG 2022 (German / English) Non-Financial Report 2022 (German / English) Human Capital Report 2022 (English) SEC Form 20-F 2022 (English) Pillar 3 Report 2022 (German / English) Online For reasons of sustainability, all publications relating to Deutsche Bank’s annual financial and non-financial statements are published online only. They are available on the bank’s homepage. Photos Deutsche Bank AG © 2022 Deutsche Bank AG Reproduction in full or in part only with the publisher’s prior written approval; photos and copy to be credited to Deutsche Bank AG. 172
Deutsche Bank Appendix Non-Financial Report 2022 Imprint/Publications Editorial comment All the information in this report has been compiled in good faith and with the greatest care from various sources. To the best of the bank’s knowledge, the information and data contained in this report reflect the truth. Nevertheless, the bank cannot assume liability for the correctness or completeness of the information provided herein. The publisher has made an effort to clarify all reproduction rights. Kindly request any possible retroactive claims to . corporate.responsibility@db.com If only the masculine form has been chosen for certain terms referring to groups of persons, this is not meant in a gender- specific way but was done exclusively for reasons of better readability. Deutsche Bank would like to thank all colleagues and stakeholders outside the company who have contributed to the preparation of this report for their kind support. This report is also available in German. Cautionary note regarding forward-looking statements This report contains forward-looking statements. Forward-looking statements are statements that are not historical facts; they include statements about our beliefs and expectations and the assumptions underlying them. These statements are based on plans, estimates and projections as they are currently available to the management of Deutsche Bank. Forward-looking statements therefore speak only as of the date they are made, and we undertake no obligation to update publicly any of them in light of new information or future events. By their very nature, forward-looking statements involve risks and uncertainties. A number of important factors could therefore cause actual results to differ materially from those contained in any forward-looking statement. Such factors include the conditions in the financial markets in Germany, in Europe, in the United States and elsewhere from which we derive a substantial portion of our revenues and in which we hold a substantial portion of our assets, the development of asset prices and market volatility, potential defaults of borrowers or trading counterparties, the implementation of our strategic initiatives, the reliability of our risk management policies, procedures and methods, and other risks referenced in our filings with the U.S. Securities and Exchange Commission. Such factors are described in detail in our SEC Form 20-F of March 17, 2023 under . the heading “Risk Factors”. Copies of this document are readily available upon request or can be downloaded 173
Our Purpose This is why we‘ re here. This is what we do. We are here to enable economic growth and societal progress, by creating positive impact for our clients, our people, our investors and our communities. #PositiveImpact