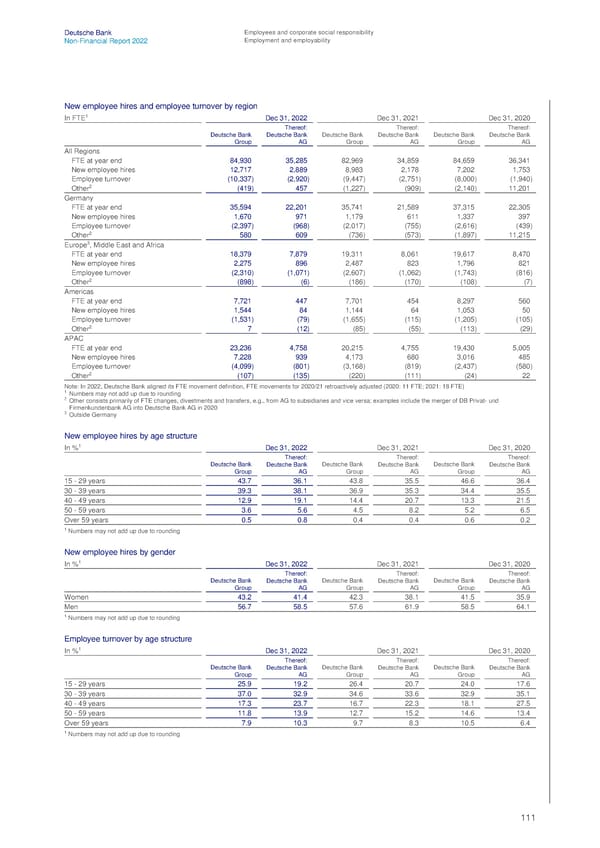
Deutsche Bank Employees and corporate social responsibility Non-Financial Report 2022 Employment and employability New employee hires and employee turnover by region In FTE1 Dec 31, 2022 Dec 31, 2021 Dec 31, 2020 Thereof: Thereof: Thereof: Deutsche Bank Deutsche Bank Deutsche Bank Deutsche Bank Deutsche Bank Deutsche Bank Group AG Group AG Group AG All Regions FTE at year end 84,930 35,285 82,969 34,859 84,659 36,341 New employee hires 12,717 2,889 8,983 2,178 7,202 1,753 Employee turnover (10,337) (2,920) (9,447) (2,751) (8,000) (1,940) 2 Other (419) 457 (1,227) (909) (2,140) 11,201 Germany FTE at year end 35,594 22,201 35,741 21,589 37,315 22,305 New employee hires 1,670 971 1,179 611 1,337 397 Employee turnover (2,397) (968) (2,017) (755) (2,616) (439) 2 Other 580 609 (736) (573) (1,897) 11,215 3 Europe , Middle East and Africa FTE at year end 18,379 7,879 19,311 8,061 19,617 8,470 New employee hires 2,275 896 2,487 823 1,796 821 Employee turnover (2,310) (1,071) (2,607) (1,062) (1,743) (816) 2 Other (898) (6) (186) (170) (108) (7) Americas FTE at year end 7,721 447 7,701 454 8,297 560 New employee hires 1,544 84 1,144 64 1,053 50 Employee turnover (1,531) (79) (1,655) (115) (1,205) (105) 2 Other 7 (12) (85) (55) (113) (29) APAC FTE at year end 23,236 4,758 20,215 4,755 19,430 5,005 New employee hires 7,228 939 4,173 680 3,016 485 Employee turnover (4,099) (801) (3,168) (819) (2,437) (580) 2 Other (107) (135) (220) (111) (24) 22 Note: In 2022, Deutsche Bank aligned its FTE movement definition, FTE movements for 2020/21 retroactively adjusted (2020: 11 FTE; 2021: 18 FTE) 1 Numbers may not add up due to rounding 2 Other consists primarily of FTE changes, divestments and transfers, e.g., from AG to subsidiaries and vice versa; examples include the merger of DB Privat- und Firmenkundenbank AG into Deutsche Bank AG in 2020 3 Outside Germany New employee hires by age structure In %1 Dec 31, 2022 Dec 31, 2021 Dec 31, 2020 Thereof: Thereof: Thereof: Deutsche Bank Deutsche Bank Deutsche Bank Deutsche Bank Deutsche Bank Deutsche Bank Group AG Group AG Group AG 15 - 29 years 43.7 36.1 43.8 35.5 46.6 36.4 30 - 39 years 39.3 38.1 36.9 35.3 34.4 35.5 40 - 49 years 12.9 19.1 14.4 20.7 13.3 21.5 50 - 59 years 3.6 5.6 4.5 8.2 5.2 6.5 Over 59 years 0.5 0.8 0.4 0.4 0.6 0.2 1 Numbers may not add up due to rounding New employee hires by gender In %1 Dec 31, 2022 Dec 31, 2021 Dec 31, 2020 Thereof: Thereof: Thereof: Deutsche Bank Deutsche Bank Deutsche Bank Deutsche Bank Deutsche Bank Deutsche Bank Group AG Group AG Group AG Women 43.2 41.4 42.3 38.1 41.5 35.9 Men 56.7 58.5 57.6 61.9 58.5 64.1 1 Numbers may not add up due to rounding Employee turnover by age structure In %1 Dec 31, 2022 Dec 31, 2021 Dec 31, 2020 Thereof: Thereof: Thereof: Deutsche Bank Deutsche Bank Deutsche Bank Deutsche Bank Deutsche Bank Deutsche Bank Group AG Group AG Group AG 15 - 29 years 25.9 19.2 26.4 20.7 24.0 17.6 30 - 39 years 37.0 32.9 34.6 33.6 32.9 35.1 40 - 49 years 17.3 23.7 16.7 22.3 18.1 27.5 50 - 59 years 11.8 13.9 12.7 15.2 14.6 13.4 Over 59 years 7.9 10.3 9.7 8.3 10.5 6.4 1 Numbers may not add up due to rounding 111
 Deutsche Bank Non Financial Report Page 111 Page 113