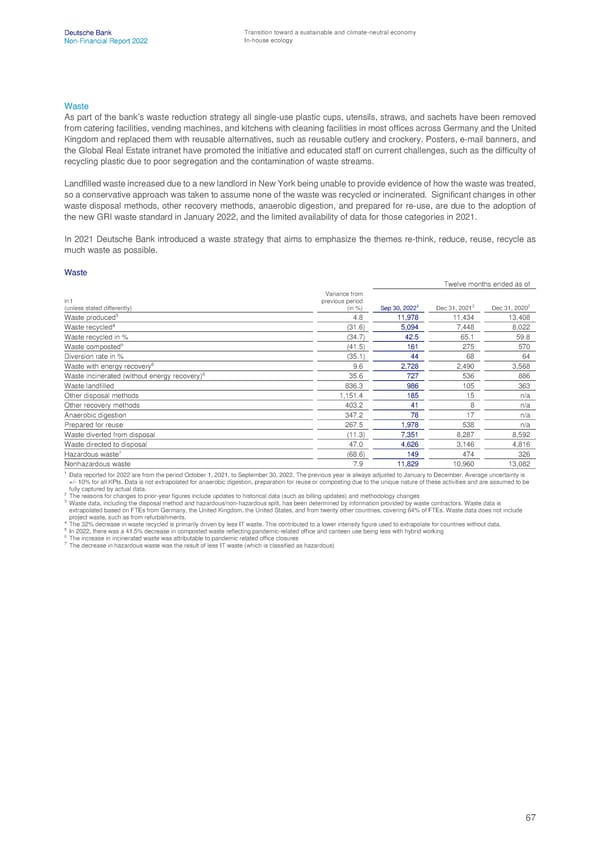
Deutsche Bank Transition toward a sustainable and climate-neutral economy Non-Financial Report 2022 In-house ecology Waste As part of the bank’s waste reduction strategy all single-use plastic cups, utensils, straws, and sachets have been removed from catering facilities, vending machines, and kitchens with cleaning facilities in most offices across Germany and the United Kingdom and replaced them with reusable alternatives, such as reusable cutlery and crockery. Posters, e-mail banners, and the Global Real Estate intranet have promoted the initiative and educated staff on current challenges, such as the difficulty of recycling plastic due to poor segregation and the contamination of waste streams. Landfilled waste increased due to a new landlord in New York being unable to provide evidence of how the waste was treated, so a conservative approach was taken to assume none of the waste was recycled or incinerated. Significant changes in other waste disposal methods, other recovery methods, anaerobic digestion, and prepared for re-use, are due to the adoption of the new GRI waste standard in January 2022, and the limited availability of data for those categories in 2021. In 2021 Deutsche Bank introduced a waste strategy that aims to emphasize the themes re-think, reduce, reuse, recycle as much waste as possible. Waste Twelve months ended as of Variance from in t previous period 1 2 2 (unless stated differently) (in %) Sep 30, 2022 Dec 31, 2021 Dec 31, 2020 3 Waste produced 4.8 11,978 11,434 13,408 4 Waste recycled (31.6) 5,094 7,448 8,022 Waste recycled in % (34.7) 42.5 65.1 59.8 5 Waste composted (41.5) 161 275 570 Diversion rate in % (35.1) 44 68 64 Waste with energy recovery6 9.6 2,728 2,490 3,568 6 Waste incinerated (without energy recovery) 35.6 727 536 886 Waste landfilled 836.3 986 105 363 Other disposal methods 1,151.4 185 15 n/a Other recovery methods 403.2 41 8 n/a Anaerobic digestion 347.2 78 17 n/a Prepared for reuse 267.5 1,978 538 n/a Waste diverted from disposal (11.3) 7,351 8,287 8,592 Waste directed to disposal 47.0 4,626 3,146 4,816 7 Hazardous waste (68.6) 149 474 326 Nonhazardous waste 7.9 11,829 10,960 13,082 1 Data reported for 2022 are from the period October 1, 2021, to September 30, 2022. The previous year is always adjusted to January to December. Average uncertainty is +/- 10% for all KPIs. Data is not extrapolated for anaerobic digestion, preparation for reuse or composting due to the unique nature of these activities and are assumed to be fully captured by actual data. 2 The reasons for changes to prior-year figures include updates to historical data (such as billing updates) and methodology changes 3 Waste data, including the disposal method and hazardous/non-hazardous split, has been determined by information provided by waste contractors. Waste data is extrapolated based on FTEs from Germany, the United Kingdom, the United States, and from twenty other countries, covering 64% of FTEs. Waste data does not include project waste, such as from refurbishments. 4 The 32% decrease in waste recycled is primarily driven by less IT waste. This contributed to a lower intensity figure used to extrapolate for countries without data. 5 In 2022, there was a 41.5% decrease in composted waste reflecting pandemic-related office and canteen use being less with hybrid working 6 The increase in incinerated waste was attributable to pandemic related office closures 7 The decrease in hazardous waste was the result of less IT waste (which is classified as hazardous) 67
 Deutsche Bank Non Financial Report Page 67 Page 69