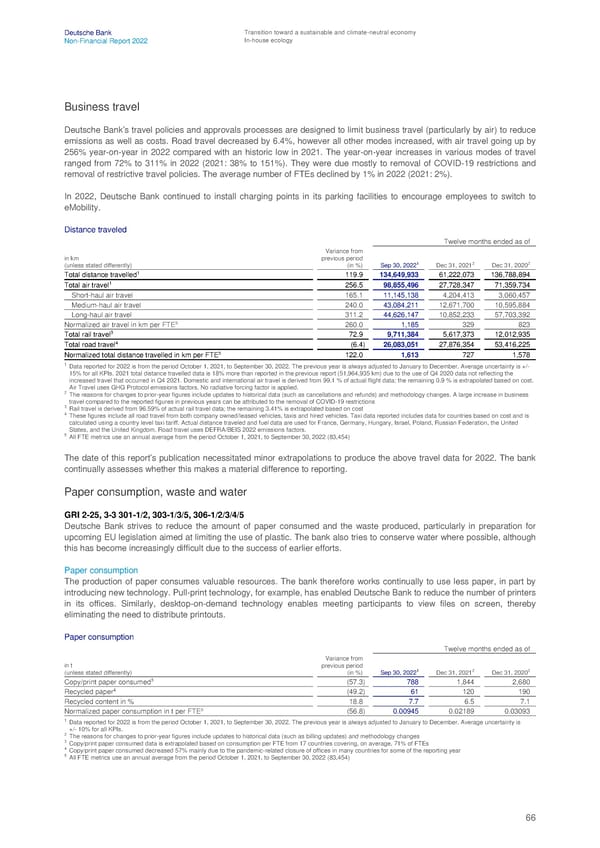
Deutsche Bank Transition toward a sustainable and climate-neutral economy Non-Financial Report 2022 In-house ecology Business travel Deutsche Bank’s travel policies and approvals processes are designed to limit business travel (particularly by air) to reduce emissions as well as costs. Road travel decreased by 6.4%, however all other modes increased, with air travel going up by 256% year-on-year in 2022 compared with an historic low in 2021. The year-on-year increases in various modes of travel ranged from 72% to 311% in 2022 (2021: 38% to 151%). They were due mostly to removal of COVID-19 restrictions and removal of restrictive travel policies. The average number of FTEs declined by 1% in 2022 (2021: 2%). In 2022, Deutsche Bank continued to install charging points in its parking facilities to encourage employees to switch to eMobility. Distance traveled Twelve months ended as of Variance from in km previous period 1 2 2 (unless stated differently) (in %) Sep 30, 2022 Dec 31, 2021 Dec 31, 2020 1 Total distance travelled 119.9 134,649,933 61,222,073 136,788,894 1 Total air travel 256.5 98,855,496 27,728,347 71,359,734 Short-haul air travel 165.1 11,145,138 4,204,413 3,060,457 Medium-haul air travel 240.0 43,084,211 12,671,700 10,595,884 Long-haul air travel 311.2 44,626,147 10,852,233 57,703,392 5 Normalized air travel in km per FTE 260.0 1,185 329 823 3 Total rail travel 72.9 9,711,384 5,617,373 12,012,935 4 Total road travel (6.4) 26,083,051 27,876,354 53,416,225 5 Normalized total distance travelled in km per FTE 122.0 1,613 727 1,578 1 Data reported for 2022 is from the period October 1, 2021, to September 30, 2022. The previous year is always adjusted to January to December. Average uncertainty is +/- 15% for all KPIs. 2021 total distance travelled data is 18% more than reported in the previous report (51,964,935 km) due to the use of Q4 2020 data not reflecting the increased travel that occurred in Q4 2021. Domestic and international air travel is derived from 99.1 % of actual flight data; the remaining 0.9 % is extrapolated based on cost. Air Travel uses GHG Protocol emissions factors. No radiative forcing factor is applied. 2 The reasons for changes to prior-year figures include updates to historical data (such as cancellations and refunds) and methodology changes. A large increase in business travel compared to the reported figures in previous years can be attributed to the removal of COVID-19 restrictions 3 Rail travel is derived from 96.59% of actual rail travel data; the remaining 3.41% is extrapolated based on cost 4 These figures include all road travel from both company owned/leased vehicles, taxis and hired vehicles. Taxi data reported includes data for countries based on cost and is calculated using a country level taxi tariff. Actual distance traveled and fuel data are used for France, Germany, Hungary, Israel, Poland, Russian Federation, the United States, and the United Kingdom. Road travel uses DEFRA/BEIS 2022 emissions factors. 5 All FTE metrics use an annual average from the period October 1, 2021, to September 30, 2022 (83,454) The date of this report’s publication necessitated minor extrapolations to produce the above travel data for 2022. The bank continually assesses whether this makes a material difference to reporting. Paper consumption, waste and water GRI 2-25, 3-3 301-1/2, 303-1/3/5, 306-1/2/3/4/5 Deutsche Bank strives to reduce the amount of paper consumed and the waste produced, particularly in preparation for upcoming EU legislation aimed at limiting the use of plastic. The bank also tries to conserve water where possible, although this has become increasingly difficult due to the success of earlier efforts. Paper consumption The production of paper consumes valuable resources. The bank therefore works continually to use less paper, in part by introducing new technology. Pull-print technology, for example, has enabled Deutsche Bank to reduce the number of printers in its offices. Similarly, desktop-on-demand technology enables meeting participants to view files on screen, thereby eliminating the need to distribute printouts. Paper consumption Twelve months ended as of Variance from in t previous period 1 2 2 (unless stated differently) (in %) Sep 30, 2022 Dec 31, 2021 Dec 31, 2020 3 Copy/print paper consumed (57.3) 788 1,844 2,680 4 Recycled paper (49.2) 61 120 190 Recycled content in % 18.8 7.7 6.5 7.1 5 Normalized paper consumption in t per FTE (56.8) 0.00945 0.02189 0.03093 1 Data reported for 2022 is from the period October 1, 2021, to September 30, 2022. The previous year is always adjusted to January to December. Average uncertainty is +/- 10% for all KPIs. 2 The reasons for changes to prior-year figures include updates to historical data (such as billing updates) and methodology changes 3 Copy/print paper consumed data is extrapolated based on consumption per FTE from 17 countries covering, on average, 71% of FTEs 4 Copy/print paper consumed decreased 57% mainly due to the pandemic-related closure of offices in many countries for some of the reporting year 5 All FTE metrics use an annual average from the period October 1, 2021, to September 30, 2022 (83,454) 66
 Deutsche Bank Non Financial Report Page 66 Page 68