Equinix Sustainability Report
Sustainability Report FY2021 Sustainability Report FY2021
CONTENTS A Message from our Executive Leadership . . . . . . . . . . 1 2021 Equinix Sustainability Report . . . . . . . . . . . . . . . . . . 2 Our Approach . . . . . . . . . . . . . . . . . . . . . . . . . . . . . . . . . . . . . 2 Awards and Recognition . . . . . . . . . . . . . . . . . . . . . . . . . . . 3 Environment . . . . . . . . . . . . . . . . . . . . . . . . . . . . . . . . . . . . . . 4 Environment Progress . . . . . . . . . . . . . . . . . . . . . . . . . . . . . 4 Environmental Data . . . . . . . . . . . . . . . . . . . . . . . . . . . . . . . . 5 Environmental Partnerships . . . . . . . . . . . . . . . . . . . . . . . . 5 Social . . . . . . . . . . . . . . . . . . . . . . . . . . . . . . . . . . . . . . . . . . . . 6 Social Progress . . . . . . . . . . . . . . . . . . . . . . . . . . . . . . . . . . . . 6 Social Data . . . . . . . . . . . . . . . . . . . . . . . . . . . . . . . . . . . . . . . 7 Social Impact and Diversity, Inclusion and Belonging (DIB) Partnerships . . . . . . . . . . . . . . . . . . . 7 Governance . . . . . . . . . . . . . . . . . . . . . . . . . . . . . . . . . . . . . . 8 Governance Progress . . . . . . . . . . . . . . . . . . . . . . . . . . . . . . 8 GRI Standards . . . . . . . . . . . . . . . . . . . . . . . . . . . . . . . . . . . 10 GRI Standards—Universal Standards . . . . . . . . . . . . . . . . 11 GRI Standards—Topic-specific Disclosures . . . . . . . . . . . 15

This is a modal window.
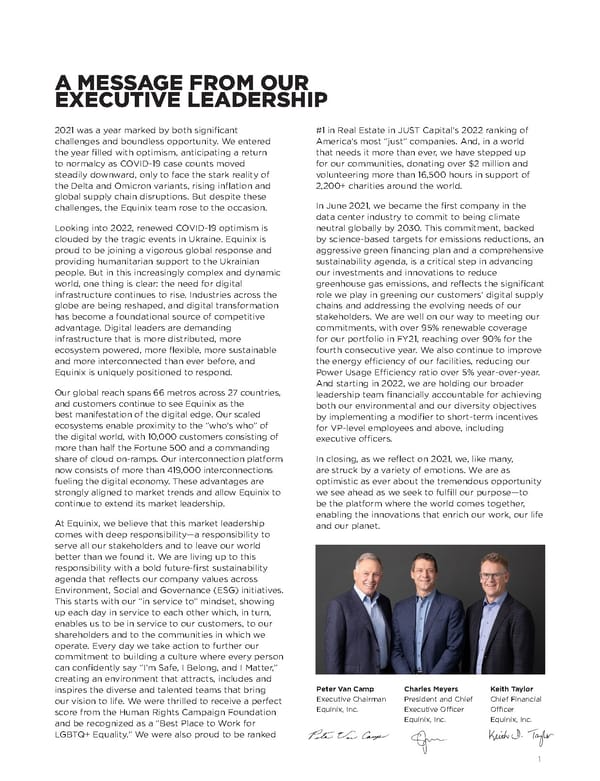
1 2021 was a year marked by both significant challenges and boundless opportunity . We entered the year filled with optimism, anticipating a return to normalcy as COVID-19 case counts moved steadily downward, only to face the stark reality of the Delta and Omicron variants, rising inflation and global supply chain disruptions . But despite these challenges, the Equinix team rose to the occasion . Looking into 2022, renewed COVID-19 optimism is clouded by the tragic events in Ukraine . Equinix is proud to be joining a vigorous global response and providing humanitarian support to the Ukrainian people . But in this increasingly complex and dynamic world, one thing is clear: the need for digital infrastructure continues to rise . Industries across the globe are being reshaped, and digital transformation has become a foundational source of competitive advantage . Digital leaders are demanding infrastructure that is more distributed, more ecosystem powered, more flexible, more sustainable and more interconnected than ever before, and Equinix is uniquely positioned to respond . Our global reach spans 66 metros across 27 countries, and customers continue to see Equinix as the best manifestation of the digital edge . Our scaled ecosystems enable proximity to the “who’s who” of the digital world, with 10,000 customers consisting of more than half the Fortune 500 and a commanding share of cloud on-ramps . Our interconnection platform now consists of more than 419,000 interconnections fueling the digital economy . These advantages are strongly aligned to market trends and allow Equinix to continue to extend its market leadership . At Equinix, we believe that this market leadership comes with deep responsibility—a responsibility to serve all our stakeholders and to leave our world better than we found it . We are living up to this responsibility with a bold future-first sustainability agenda that reflects our company values across Environment, Social and Governance (ESG) initiatives . This starts with our “in service to” mindset, showing up each day in service to each other which, in turn, enables us to be in service to our customers, to our shareholders and to the communities in which we operate . Every day we take action to further our commitment to building a culture where every person can confidently say “I’m Safe, I Belong, and I Matter,” creating an environment that attracts, includes and inspires the diverse and talented teams that bring our vision to life . We were thrilled to receive a perfect score from the Human Rights Campaign Foundation and be recognized as a “Best Place to Work for LGBTQ+ Equality .” We were also proud to be ranked A MESSAGE FROM OUR EXECUTIVE LEADERSHIP #1 in Real Estate in JUST Capital’s 2022 ranking of America’s most “just” companies . And, in a world that needs it more than ever, we have stepped up for our communities, donating over $2 million and volunteering more than 16,500 hours in support of 2,200+ charities around the world . In June 2021, we became the first company in the data center industry to commit to being climate neutral globally by 2030 . This commitment, backed by science-based targets for emissions reductions, an aggressive green financing plan and a comprehensive sustainability agenda, is a critical step in advancing our investments and innovations to reduce greenhouse gas emissions, and reflects the significant role we play in greening our customers’ digital supply chains and addressing the evolving needs of our stakeholders . We are well on our way to meeting our commitments, with over 95% renewable coverage for our portfolio in FY21, reaching over 90% for the fourth consecutive year . We also continue to improve the energy efficiency of our facilities, reducing our Power Usage Efficiency ratio over 5% year-over-year . And starting in 2022, we are holding our broader leadership team financially accountable for achieving both our environmental and our diversity objectives by implementing a modifier to short-term incentives for VP-level employees and above, including executive officers . In closing, as we reflect on 2021, we, like many, are struck by a variety of emotions . We are as optimistic as ever about the tremendous opportunity we see ahead as we seek to fulfill our purpose—to be the platform where the world comes together, enabling the innovations that enrich our work, our life and our planet . Charles Meyers President and Chief Executive Officer Equinix, Inc . Peter Van Camp Executive Chairman Equinix, Inc . Keith Taylor Chief Financial Officer Equinix, Inc .
1 . Our comprehensive interactive sustainability report, available at Sustainability .Equinix . com, has been prepared in accordance with the Global Reporting Initiative (GRI) Sustainability Reporting Standards . The reporting period is January 1, 2021, to December 31, 2021, unless otherwise noted with specific data . Design for the environment Invest in resource conservation strategies and data center of the future innovation Connect our communities Serve and connect our communities to opportunities of the digital world Social Integrate ESG Integrate sustainability into all aspects and levels of our business Our approach Our Future First strategy aligns our Environmental, Social and Governance (ESG) initiatives 1 to the material issues that impact our stakeholders, business and the world around us . Our ambitions align with the following six United Nations Sustainable Development Goals most important to our strategy . Environment Governance Achieve our climate targets Drive emissions reductions across our global operations and value chain Build a diverse & inclusive culture Be a place where every employee can say “I’m safe, I belong, and I matter” Drive global responsibility Promote global responsibility through unwavering values and ethical practices Reach 100% renewable energy Scale renewable energy purchasing globally to move from 95% to 100% Promote health & wellness Support the physical, mental and emotional wellbeing of all our employees Advocate for change Forge partnerships to advocate for innovation and action 2021 EQUINIX SUSTAINABILITY REPORT Future First Sustainability at Equinix Our commitment to sustainability is driven by our resolve to set ambitious targets, measure and report progress transparently, lead with ethics and integrity, and engage our numerous stakeholders to drive change . We believe in the future of possibility—a future where our planet is healthy, our global communities thrive and every business leads with purpose . This vision of tomorrow comes first in all we do . At Equinix we dream. Then we do. 2
Awards and recognition In 2021, we were recognized with the following awards for our sustainable operations and innovations and commitment to building an ethical, inclusive place to work: Learn more Learn more about our Future First strategy, commitments and strategic partnerships . Sustainability .Equinix . com “Equinix’s progress and commitment toward reaching its 100% renewable energy goal worldwide demonstrates to Oracle the importance of working with our strategic suppliers to help contribute to our own renewable energy strategy .” Jon Chorley, Chief Sustainability Officer, Oracle A- Driving accountability Equinix manages sustainability through a dedicated Sustainability Program Office (SPO) . The SPO leads in driving strategy across ESG and assembling and coordinating teams to implement and execute the initiatives, processes and policies that address our material impacts . The SPO is accountable to the CFO and ultimately to the Sustainability Executive Nominating and Governance Committee of Equinix’s Board of Directors . Reporting progress We document our ESG progress in our annual Sustainability Report and on our sustainability website . Our disclosures meet the reporting framework requirements of Accounting for Sustainability (A4S), CDP, EcoVadis, GRESB, GRI, S&P Global SAM, RE100, SASB, SBTi and TCFD . Strengthening partnerships This year we strengthened our partnerships by helping the Clean Energy Buyers Alliance (CEBA/ REBA) shape a viable renewable energy future; leading the European Union Data Centre Association (EUDCA) in outlining steps to achieve climate neutrality by 2030 across the European data center industry; and partnering with organizations such as FairyGodBoss, Athletes Career Transition and The Human Rights Campaign to find new ways for connecting underrepresented communities to meaningful opportunities in an inclusive environment at Equinix . We also announced our Clean Hydrogen Partnership, a consortium of seven companies, to explore an innovative integration of solid-oxide fuel cells . Increasing transparency Transparency is a hallmark of our strategy . We are in our customers’ supply chains . In addition to our sustainability reporting, we offer Equinix Green Power Reports (GPRs), whereby customers and partners in our data centers can claim renewable energy coverage and quantify their greenhouse gas emissions based on their footprint . GPRs are calculated based on the Greenhouse Gas (GHG) Protocol and empower customers to track progress against their own sustainability goals and reporting efforts . 3
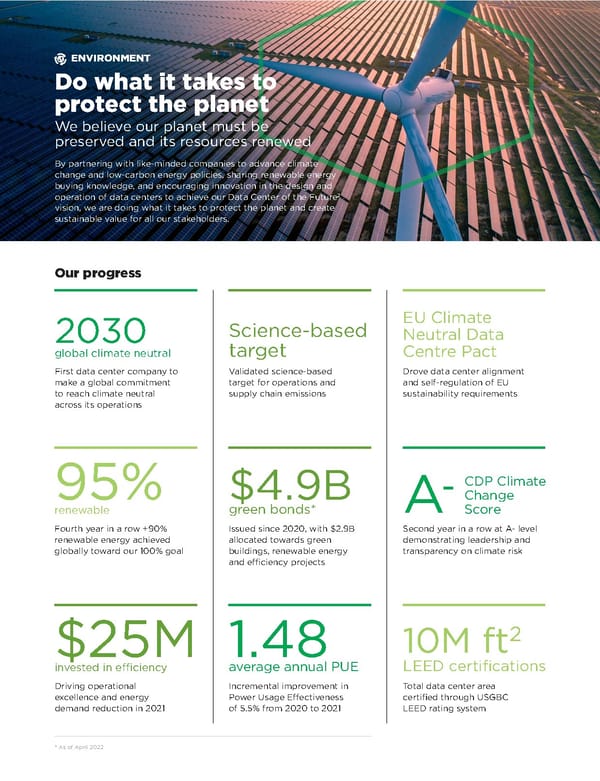
Our progress * As of April 2022 First data center company to make a global commitment to reach climate neutral across its operations Validated science-based target for operations and supply chain emissions Drove data center alignment and self-regulation of EU sustainability requirements 2030 global climate neutral Science-based target Fourth year in a row +90% renewable energy achieved globally toward our 100% goal Issued since 2020, with $2 .9B allocated towards green buildings, renewable energy and efficiency projects Second year in a row at A- level demonstrating leadership and transparency on climate risk 95% renewable $4 .9B green bonds* Driving operational excellence and energy demand reduction in 2021 Incremental improvement in Power Usage Effectiveness of 5 .5% from 2020 to 2021 $25M invested in efficiency 1 .48 average annual PUE EU Climate Neutral Data Centre Pact Total data center area certified through USGBC LEED rating system 10M ft 2 LEED certifications A CDP Climate Change Score - ENVIRONMENT Do what it takes to protect the planet We believe our planet must be preserved and its resources renewed By partnering with like-minded companies to advance climate change and low-carbon energy policies, sharing renewable energy buying knowledge, and encouraging innovation in the design and operation of data centers to achieve our Data Center of the Future 2 vision, we are doing what it takes to protect the planet and create sustainable value for all our stakeholders .
Environmental data: energy and emissions Metric Units 2019 2020 2021 Electricity Consumption GWh 5,700 6,430 7,140 Renewable Energy GWh 5,250 5,840 6,770 % Renewable Energy % 92% 91% 95% Energy Intensity GWh / million USD 1 . 028 1 . 077 1 . 084 GHG Emissions: Scope 1 mtCO2e 40,700 55,100 50,700 GHG Emissions: Scope 2 (location-based) mtCO2e 2,079,000 2,280,200 2,307,600 GHG Emissions: Scope 2 (market-based) mtCO2e 306,000 327,700 254,800 Carbon Intensity (location-based) mtCO2e / million USD 381 389 355 Carbon Intensity (market-based) mtCO2e / million USD 62 64 46 Energy and emissions are assured to ISO 14064-3:2019 standards for the quantification and reporting of greenhouse gas emissions . GHG = Greenhouse Gas Environmental partnerships Supplier Green Power, 37% RECs, 45% VPPAs, 13% Brown Power, 5% 2021 Electricity by type GWh 5,700 6,430 7,140 1.54 1.51 1.48 1.44 1.46 1.48 1.50 1.52 1.54 1.56 0 1,000 2,000 3,000 4,000 5,000 6,000 7,000 8,000 2019 2020 2021 GWh Power Usage Effectiveness Annual Average PUE Electricity Consumption ENERGY TRENDS Renewable energy by type Energy trends Looking forward Our Future First environmental strategy seeks to: Address the urgency of climate change Expand our decarbonization targets, aligned with science, for our operations and supply chain . Scale renewable energy purchasing Increase and improve the quality of our purchased renewable energy . Manage value chain emissions Expand attention to carbon embedded in our supply chain including building construction and infrastructure . Leverage technology and innovation Pilot and scale new data center technologies to contribute toward a zero-carbon energy grid and drive globally coordinated efforts on energy, water and waste reductions . 5
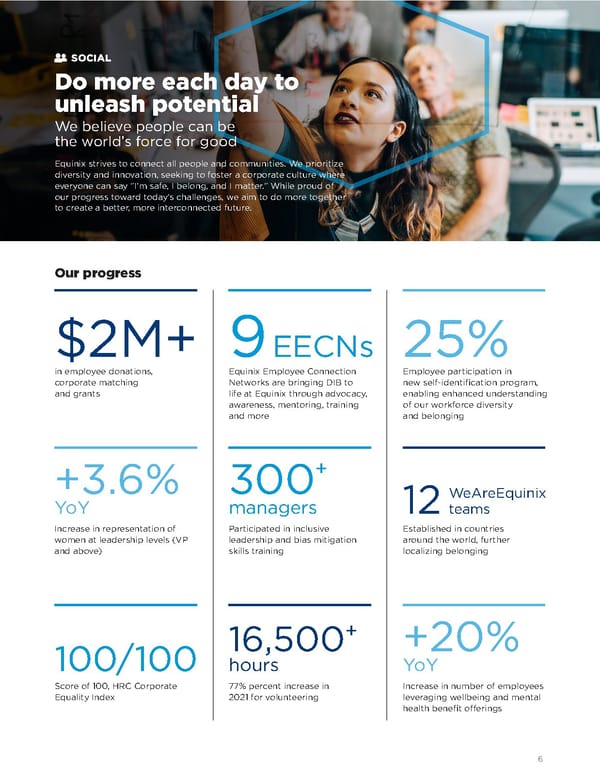
Our progress in employee donations, corporate matching and grants Equinix Employee Connection Networks are bringing DIB to life at Equinix through advocacy, awareness, mentoring, training and more Employee participation in new self-identification program, enabling enhanced understanding of our workforce diversity and belonging $2M+ 9 EECNs 25% Increase in representation of women at leadership levels (VP and above) Participated in inclusive leadership and bias mitigation skills training Established in countries around the world, further localizing belonging +3 .6% Yo Y 300 + managers 12 Score of 100, HRC Corporate Equality Index 77% percent increase in 2021 for volunteering 100/100 16,500 + hours Increase in number of employees leveraging wellbeing and mental health benefit offerings +20% Yo Y WeAreEquinix teams SOCIAL Do more each day to unleash potential We believe people can be the world’s force for goo d Equinix strives to connect all people and communities . We prioritize diversity and innovation, seeking to foster a corporate culture where everyone can say “I’m safe, I belong, and I matter .” While proud of our progress toward today’s challenges, we aim to do more together to create a better, more interconnected future . 6
Social data Social impact and DIB partnerships 7% 7% 7% 10% 8% 11% 0% 5% 10% 15% Global Women Men 2021 2020 EMPLOYEE TURNOVER 2021 U.S. employee race/ethnicity 47.1% 24.7% 6.3% 4.1% 13.2% 4.6% Hispanic/Latinx Black / African American Asian Declined to ID White Other 2021 Employees by gender Women Note: Includes fixed-term employees and employees from acquisitions Men Declined to ID 74.2% 25.3% 0.5% 500 1,500 2,500 3,500 4,500 5,500 Full-time Employees (FTEs) Americas Asia-Pacific EMEA 2021 2020 EMPLOYEES BY REGION 4,599 2,009 3,405 5,056 2,277 3,611 Looking forward Our Future First social strategy seeks to: Serve and connect people Leverage the intersection between talent attraction and development; diversity, inclusion and belonging; employee wellbeing and community impact to foster a culture where all employees thrive . Further connect our own expertise and assets Explore new ways of advancing digital inclusion in the world . Increase workforce diversity Continue to develop pathways and partnerships, creating opportunities for historically underrepresented groups inside and outside of Equinix . Provide global opportunities for optimum health and lifelong wellbeing Invest in strategies and programs that support the physical, mental and emotional wellbeing of our diverse organization . 7
Our progress 3 . https://investor .equinix . com/corporate-governance/public-policy-activities#:~:text=Equinix%E2%80%99s%20public%20policy%20function%20was%20 4 . https://investor .equinix . com/corporate-governance/committee-composition Employee completion of Ethics and Compliance trainings Achieved certification for data security policies and protocols CPA-Zicklin Index improvement for political transparency 8 years of 100 % ISO 27001 & ISO 27002 20% 3 Nominating and Governance Committee with formal oversight of ESG per its Charter Three most recent additions to Board have been women and/or racially diverse Procurement-led strategy focused on diversity and sustainability Board ESG oversight 4 Increased Board Diversity Supplier ESG program Select employees received targeted GDPR compliance training Equinix leaders serving as Board Members or Chairs for data center industry associations 30% 7+ Customer cyber audits conducted with zero high-risk findings 3,000 GOVERNANCE Do what’s right to lead the way We believe in leading with purpose and acting with integrity Strong corporate governance is not only a competitive advantage, but also a key driver of our culture—one that is built with customers, suppliers, partners and employees . We are proud to be responsible corporate citizens that deliver superior results with the highest standards of integrity, while still advocating for a sustainable future .
Governance and board structure At Equinix, our corporate governance practices 5 enhance our accountability and transparency and promote our ethical pursuit of our stakeholders’ best interests . 5 . http://invest . equinix . com/corporate-governance/highlights 6 . http://investor .equinix . com/phoenix .zhtml?c=122662&p=irol-govboard Governance partnerships and certifications Independent directors 7 Average board tenure in years 9 .27 Number of board meetings held in 2021 7 Female board members 3 Size of board at Equinix 6 9 Racially/ethnically diverse board 22% Looking forward We aim to build upon the progress made in 2021 through continued purposeful leadership and integrity . Enhance ethics and compliance engagement Develop new tools to further engage employees on ethics and compliance priorities throughout the year . Cultivate a culture of trust Strengthen our foundation of cyber security and data privacy to improve resilience and customer experience . Engage our suppliers on sustainability Engage our suppliers to set climate targets and make supplier diversity commitments . Further strengthen collaboration with peers and trade associations Continue to lead initiatives that move the data center industry towards a more sustainable future . Separate chair and CEO ESG oversight Proxy access Code of Business Conduct for directors and executive officers Lead independent director Independent chair 9
2021 GRI Standards 10
GRI Standards—Universal Standards GRI 102: ORGANIZATIONAL PROFILE Disclosure No. Disclosure Title 2021 Response 102-1 Name of the organization Equinix, Inc . (NASDAQ: EQIX) 102-2 Activities, brands, products, and services Equinix provides a variety of International Business Exchange ™ (IBX ® ) and xScale ™ colocation data centers, as well as interconnection solutions and managed IT infrastructure services . Additional details are available in our 2021 Form 10-K . 102-3 Location of headquarters One Lagoon Drive, Redwood City, California 94065, USA 102-4 Location of operations As of the end of 2021, Equinix operated 240 IBX and xScale data centers in 66 strategic markets in 27 countries across the Americas, Asia-Pacific, and Europe, the Middle East and Africa (“EMEA”) . As of December 2021, Equinix operated: § 27 metros in the Americas (USA, Canada, Colombia, Brazil and Mexico) § 27 metros across Europe, Middle East and Africa (EMEA) (Bulgaria, Finland, France, Germany, Ireland, Italy, Netherlands, Oman, Poland, Portugal, Spain, Sweden, Switzerland, Turkey, UK and UAE) and; § 13 metros in Asia-Pacific (Australia, China, Japan, Hong Kong, Singapore, South Korea and India) 102-5 Ownership and legal form Equinix is a Real Estate Investment Trust (“REIT”) and is publicly traded on the NASDAQ Stock Market . 102-6 Markets served In 2021, Equinix operated in 66 strategic markets across the Americas, Asia-Pacific and EMEA with more than 10,000 customers, including a diversified mix of cloud and IT service providers, content providers, enterprises, financial companies, and network and mobile service providers . 102-7 Scale of the organization 2021 Form 10-K , Item 1 102-8 Information on employees and other workers Total headcount: Equinix had 10,612 regular employees as of December 31, 2021 . This is a 12 .2% headcount growth since 2020 . Total number of employees/workers by type and by gender: § Regular employees: 7,870 Men employees; 2,685 Women employees; and 57 employees declined to ID § Fixed-term employees: 280 Men employees; 145 Women employees; and 3 employees declined to ID § Contingent workers: 137 Men workers; 46 Women workers; and 4,843 workers declined to ID (no data available) Total number of employees by employment by type and by region: § Americas: 5,011 regular employees and 95 fixed-term employees § Asia-Pacific: 2,154 regular employees and 149 fixed-term employees § EMEA: 3,447 regular employees and 184 fixed-term employees Total number of regular employees by employment type and by gender: § Full-time employees: 7,829 Men employees; 2,621 Women employees; and 57 employees declined to ID § Part-time employees: 41 Men employees and 64 Women employees Total number of regular employees by exempt and non-exempt status: § Exempt: 7,377 employees globally; 3,567 employees in AMER; 1,485 employees in APAC; 2,325 employees in EMEA § Non-Exempt: 3,235 employees globally; 1,444 employees in AMER; 669 employees in APAC; 1,122 employees in EMEA 102-9 Supply chain Equinix designs, builds and operates multi-tenant retail interconnection data centers globally . Our supply chain consists of the materials and utilities contracts needed to provide the space, power and cooling that we offer our customers . The space consists of the materials used to build our data centers and the contractors we hire during the construction phases . The power and cooling infrastructure consist of equipment inside the sites that bring power to our customers’ electronic equipment reliably (including backup generators and UPS units) and maintain the necessary temperatures, airflow and humidity needed to keep our customers’ equipment running effectively and reliably (HVAC equipment) . Our power supply chain is monitored and managed for both price and environmental concerns . We also use a variety of suppliers who help us maintain some aspects of data center operations and reliability, such as physical security measures and security personnel, janitors, waste management companies, etc . And we use a variety of consultants and suppliers to help us improve our business strategy and processes . We are committed to ensuring that our suppliers maintain high standards of ethics and environmental compliance . Our Business Partner Code of Conduct details our supplier ESG requirements . 11
GRI 102: ORGANIZATIONAL PROFILE, continued Disclosure No. Disclosure Title 2021 Response 102-10 Significant changes to the organization and its supply chain In 2021, we opened nine new IBX data centers, opened six new xScale data centers via our joint ventures, and entered three new markets resulting in an increase in our total number of data center facilities to 240, which includes the MU4 and GN1 data centers which opened in January 2022 . In September 2021, we announced that we extended Platform Equinix ® into the strategic Indian market, following the completion of the acquisition of the India operations of GPX Global Systems, Inc . In December 2021, we also announced our expansion into Africa through the planned acquisition of MainOne, a leading West African data center and connectivity solutions provider . GPX and MainOne are excluded from the reporting boundary unless noted otherwise . 102-11 Precautionary Principle or approach Equinix does not specifically apply the precautionary principle; however, Equinix complies with all applicable local, regional, federal, and international laws and regulations . We take steps to ensure that we can operate with the highest levels of integrity and reliability, and we aim to develop programs to meet or exceed industry best practices . Globally, we employ a risk-based approach to our policies and practices and seek to implement best practices around the world, including increased transparency around the impact of our operations and the policies we have in place . 102-12 External initiatives As of December 31, 2021, Equinix participated in the following initiatives, in no particular order: Accounting for Sustainability (A4S), CDP, CEO Action for Diversity & Inclusion, Clean Energy Buyers Association (CEBA), Climate Neutral Data Centre Pact, Digital Inclusion Benchmark, EcoVadis, EU Code of Conduct for Data Centres, the European Data Center Association (EUDCA), EU Data Center Operator, Global Real Estate Sustainability Benchmark (GRESB), Green Datacentre Research Programme, Information Technology Industry Council (and the former The Green Grid), ISO 14001 Environmental Management System, ISO 50001 Energy Management System, NAREIT Real Estate Sustainability Council (RESC) and ESG Forum, Paradigm for Parity, RE100, SASB, Singapore BCA-IMDA Green Mark, S&P Global Corporate Sustainability Assessment, TCFD, techUK, U .S . Environmental Protection Agency (EPA) Energy Star Data Center Rating program, U .S . EPA Green Power Partnership, U .S . Green Building Council (USGBC), VigeoEiris . Please note this list is not exhaustive . 102-13 Membership of associations Equinix’s membership in any trade association does not indicate our agreement with all views and positions taken by the association . As of December 31, 2021, we were active members of the following sample list organizations . Trade Organizations § Asia Cloud Computing Association § Data Center Coalition (DCC) § Dutch Data Centre Association § European Data Centre Association (EUDCA) § France Datacenter § German Datacenter Association § Host in Ireland § Information Technology Industry Council (ITI) § National Association of Real Estate Investment Trusts (Nareit) § Northern Virginia Technology Council (NVTC) § TechUK (United Kingdom) § US India Business Council § US Colombia Business Council GRI 102: STRATEGY Disclosure No. Disclosure Title 2021 Response 102-14 Statement from senior decision-maker CEO Letter 102-15 Key impacts, risks, and opportunities 2021 Form 10-K , Item 1A 12
GRI 102: ETHICS AND INTEGRITY Disclosure No. Disclosure Title 2021 Response 102-16 Values, principles, standards, and norms of behavior Equinix’s Code of Business Conduct details the company’s corporate values and ethics and compliance requirements for employees and all individuals acting on Equinix’s behalf . GRI 102: GOVERNANCE Disclosure No. Disclosure Title 2021 Response 102-17 Mechanisms for advice and concerns about ethics Equinix’s Code of Business Conduct details the company’s whistleblower protection practices . Equinix’s Whistleblower Policy protects corporate “whistleblowers,” ensuring that concerns around ethics and corruption are taken seriously and acted upon by the Company . 102-18 102-19 102-20 102-21 102-30 102-31 102-32 Governance structure Delegating authority Executive-level responsibility for economic, environmental, and social topics Consulting stakeholders on economic, environmental, and social topics Effectiveness of risk management processes Review of economic, environmental, and social topics Highest governance body’s role in sustainability reporting At Equinix, we are all working together to build an organization that is defined by its honesty, integrity and consistently ethical behavior . Our commitment to the highest standards of business and professional conduct differentiates our business as much as our technology . The sound corporate governance practices we have adopted enhance our accountability and transparency and promote our ethical pursuit of our shareholders’ best interests . In 2021, Equinix combined its Nominating Committee and its Governance Committee into a single Nominating and Governance Committee which is made up solely of independent directors . The Nominating and Governance Committee is responsible for ESG oversight at Equinix and regularly reviews strategies, policies, practices, performance and reporting related to corporate environment, social and governance matters . § Responsibilities of our Sustainability Executive Steering Committee and Sustainability Program Office (SPO) include: (i) setting corporate sustainability strategy and policy, (ii) monitoring and tracking Equinix’s progress, and (iii) transparently communicating our efforts externally to enhance our reputation and lead our industry . § The sustainability program contains three program tracks (or pillars) . In 2021, each pillar was led by at least one member of the executive team (these members comprise the Executive Steering Committee which includes our CEO, CFO, CHRO/CLO, and EVP, Global Operations) who are responsible for delegating ESG topics to other senior executives and employees . § Day-to-day the sustainability in 2021 was led by a global program director and executed by a Working Team that consists of ~30 global and regional leads . The Working Team meets periodically, the Steering Committee meets 2-4x annually, and the program director with support of the Working Team has access to the CEO and Board of Directors Nominating and Governance Committee quarterly as needed . § Consultation with stakeholders is led by the working team and Equinix’s materiality assessment (last updated in the fall of 2020) engaged a variety of stakeholders who provided their feedback on Equinix’s ESG programs and goals . Equinix’s Investor Relations (IR) team also met with numerous investors around the world by attending or hosting over 30 investor conferences, non-deal roadshows, and investor group events . Certain investors also requested engagement meetings to discuss topics related to our corporate governance model, ESG issues or our executive compensation program . Additionally, Equinix’s IR team proactively reached out for meetings with our 25 largest stockholders in the fall of 2021 to discuss these topics and solicit feedback . Equinix’s corporate governance structure can be found on Equinix’s Investor Relations website under Corporate Governance . Additional details are available in our 2022 Proxy Statement . 102-22 Composition of the highest governance body and its committees 2022 Proxy Statement 102-23 Chair of the highest governance body 2022 Proxy Statement 102-24 Nominating and selecting the highest governance body 2022 Proxy Statement 13
GRI 102: STAKEHOLDER ENGAGEMENT Disclosure No. Disclosure Title 2021 Response 102-40 List of stakeholder groups For more details, please refer to our Stakeholder Engagement Table . 102-41 Collective bargaining agreements In the Americas, both Brazil and Canada have collective bargaining . 100% of the workforce in Brazil is covered by collective bargaining with the union . In Canada, 4 .4% of the workforce is unionized . In Asia-Pacific, Equinix employees are not covered by collective bargaining or labor unions . However, in Japan, China and Korea, for any change in benefit or employment terms, Equinix will have to go through employee consultation process and get their consent . In EMEA, France, UK, Germany, Netherlands, Spain, Finland and Sweden have formal works councils or representative employee bodies . France has collective bargaining in place with the current scope applying to 65% of employees . 102-42 Identifying and selecting stakeholders Stakeholder engagement is critical to the success of our sustainability efforts . Equinix identifies its key stakeholders as those who may have the greatest impact or influence on Equinix’s business or those that Equinix most greatly affects . Equinix’s key stakeholders and the engagement methods and frequency of engagement are detailed in our Stakeholder Engagement section . 102-43 Approach to stakeholder engagement This process is described in more detail in the Stakeholder Engagement section . 102-44 Key topics and concerns raised This process is described in more detail in the Stakeholder Engagement and Materiality sections . GRI 102: REPORTING PRACTICE Disclosure No. Disclosure Title 2021 Response 102-45 Entities included in consolidated financial statements All entities listed in our 2021 Form 10-K 102-46 Defining report content and topic Boundaries For more details, please refer to our Report Profile discussion . 102-47 List of material topics For more details, please refer to our Materiality Assessment discussion . 102-48 Restatements of information None 102-49 Changes in reporting Changes in the operational boundary for sustainability report include: the inclusion of 2021 completed sites (BX1, DC21, FR8, LD11x, MC1, ML5, PA9x, SG5, SP5x, SV11, TY12x) . Equinix acquisitions of MainOne and GPX are excluded from the reporting boundary unless noted otherwise . In addition, data center expansions at existing sites are also included . For more details, please refer to our Materiality Assessment discussion . 102-50 Reporting period 2021 calendar year 102-51 Date of most recent report Released April 2022 covering 2021 data 102-52 Reporting cycle Annually 102-53 Contact point for questions regarding the report Jennifer Ruch Senior Director, Sustainability, Sustainability Program Office Sustainability@equinix . com 1 .800 .322 .9280 102-54 Claims of reporting in accordance with the GRI Standards This report has been prepared in accordance with the GRI Standards: Core option . 102-55 GRI content index Included in this section 102-56 External assurance This report does not have external assurance; however, Equinix’s 2015–2021 energy, renewable energy, and Scope 1, Scope 2 and Scope 3 emissions have been externally verified to Limited Assurance Standards ISO 14064-3 . 14
GRI Standards—Topic-specific Disclosures GRI 201: ECONOMIC PERFORMANCE Disclosure No. Disclosure Title 2021 Response 103-1 Explanation of the material topic and its Boundary Materiality Assessment 103-2 103-3 The management approach and its components Evaluation of the management approach 2021 Form 10-K 201-1 Direct economic value generated and distributed 2021 Form 10-K , Item 7 201-2 Financial implications and other risks and opportunities due to climate change Equinix 2021 CDP Climate Change Survey response GRI 203: INDIRECT ECONOMIC IMPACTS Disclosure No. Disclosure Title 2021 Response 103-1 Explanation of the material topic and its Boundary Materiality Assessment 103-2 103-3 The management approach and its components Evaluation of the management approach Equinix’s corporate philanthropy and citizenship efforts 203-1 Development and impact of infrastructure investments and services supported Infrastructure investments: 2021 Form 10-K , Note 17 in Notes to Consolidated Financial Statements . Our Community Impact program promotes connection and belonging, and enables employees to give back, with the support of Equinix, to the communities in which we work and live . In total, our Community Impact efforts in 2021 resulted in approximately $2 . 05 million in employee donations, corporate matching and grants, and more than 16,500 volunteer hours, to approximately 2,200 nonprofits worldwide . 203-2 Significant indirect economic impacts This metric helps determine how many job opportunities were created in 2021, both as a result of growth and from a need to replace leaving employees . A total of 1,751 employees were hired externally in 2021 against the 3,238 open positions, 731 positions were filled internally, and the remaining positions not hired for, carried forward to 2022 or cancelled . GRI 205: ANTI-CORRUPTION Disclosure No. Disclosure Title 2021 Response 103-1 Explanation of the material topic and its Boundary Materiality Assessment 103-2 103-3 The management approach and its components Evaluation of the management approach Equinix’s Governance & Ethics efforts 15
GRI 205: ANTI-CORRUPTION, continued Disclosure No. Disclosure Title 2021 Response 205-1 Operations assessed for risks related to corruption Every organization is judged by the actions of its people . When individuals consistently act with honesty and integrity, their company builds trust and a reputation for ethical behavior . At Equinix, we believe that acting ethically is not only the right thing to do, but it also makes good business sense . Equinix is committed to the highest standards of business and professional conduct . We designed our Code of Business Conduct to reflect and document our ethical values and standards including our stance on corruption . We assign mandatory trainings on the Code of Business Conduct and anti-bribery and corruption to ensure that all Equinix employees are provided guidance on applying our ethical standards in their day-to-day decision-making and actions on behalf of our company . We also periodically survey our employees and conduct risk assessments to assess the effectiveness of our programs . Equinix continually reviews its business operations and market environment to assess the various risks that have the potential to adversely affect our business . These risks, including those related to corruption, are reported annually in the risk factors section of our SEC reporting . Please refer to our 2021 Form 10-K . 205-2 Communication and training about anti-corruption policies and procedures All new hires at Equinix must complete both Code of Business Conduct and anti- bribery and corruption training courses within six months of being hired . After that, employees are expected to take online or in-person compliance training on an annual basis depending on the training schedule each year . Trainings are available in multiple languages through a software program that enables us to reach 100% of Equinix employees . New Board members receive training on anti-bribery and corruption (ABC) risk and Equinix’s ABC policy and training program as part of their onboarding orientation session . Equinix’s management team also participates in all employee mandatory trainings described above . Equinix’s Whistleblower Policy protects corporate “whistleblowers,” ensuring that concerns around ethics and corruption can be taken seriously and acted upon by the Company . 205-3 Confirmed incidents of corruption and actions taken Please review our SEC filings for reporting on Corruption, Ethics and Compliance issues . In 2021, Equinix had no verified violations of applicable anti-bribery and corruption laws . GRI 302: ENERGY Disclosure No. Disclosure Title 2021 Response 103-1 Explanation of the material topic and its Boundary Materiality Assessment 103-2 103-3 The management approach and its components Evaluation of the management approach Equinix’s Environment efforts 302-1 Energy consumption within the organization Energy Consumption: Total energy consumption in 2021 was 7,306 GWh across Scope 1 and 2 (up from 6,589 GWh in 2020 or 10%) . Scope 2 was 7,200 GWh (+11% YOY) . The regional breakdown for Scope 2 was: § Americas: 3,030 GWh (42%, +14% YOY) § Asia-Pacific: 1,490 GWh (21%, +8% YOY) § EMEA: 2,680 GWh (37%, +10% YOY) Note: Scope 2 includes consumption from electric power, fuel cells operated under power purchase agreements and chilled water . These values were assured to Limited Assurance ISO 14064-3 Requirements . Renewable Energy Consumption: Total renewable energy consumption in 2021 was 6,770 GWh (+16% YOY) § Americas: 2,980 GWh (+22% YOY) § Asia-Pacific: 1,120 GWh (+10% YOY) § EMEA: 2,670 GWh (+12% YOY) 16
GRI 302: ENERGY, continued Disclosure No. Disclosure Title 2021 Response 302-3 Energy intensity Energy intensity as measured by electricity consumption (GWh) per unit revenue (million USD) was: § 2021: 1 . 084 GWh electricity per million USD (change of +1% YOY § 2020: 1 . 077 GWh electricity per million USD (change of +5% YOY) § 2019: 1 . 028 GWh electricity per million USD (change of +1% YOY) Note: includes electric power and chilled water for all years . Equinix’s energy intensity is driven both by site efficiency as well as how we generate revenue around the world . Energy intensity as measured by electricity consumption (GWh) per data center floor area (gross sq . ft) was: § 2021: 263 GWh electricity per sq . ft § 2020: 258 GWh electricity per sq . ft § 2019: 243 GWh electricity per sq . ft Note: includes electric power and chilled water for all years . Equinix’s energy intensity is driven both by site efficiency as well as how we generate revenue around the world . 302-4 Reduction of energy consumption Demand reduction from energy efficiency investments since 2011 is roughly 47,500 kW annually including 15,500 kW from projects completed in 2021 . GRI 305: EMISSIONS Disclosure No. Disclosure Title 2021 Response 103-1 Explanation of the material topic and its Boundary Materiality Assessment 103-2 103-3 The management approach and its components Evaluation of the management approach Equinix’s Environment efforts 305-1 Direct (Scope 1) GHG emissions Scope 1 emissions from: on-site diesel consumption for backup generation, natural gas used for heating and fuel cells, and refrigerant losses (new since 2018) . § 2021: 50,700 mtCO2e § 2020: 55,100 mtCO2e § 2019: 40,700 mtCO2e The primary drivers for the decrease in Scope 1 emissions include the shutdown of the on-site natural gas-based cogeneration facility at MX1 and an overall reduction in refrigerant leakages due to focused efforts across our operations . 305-2 Energy indirect (Scope 2) GHG emissions Scope 2 Location-based GHG emissions (electricity + chilled water), with YOY trend: § 2021: 2,307,600 mtCO2e (+1%) § 2020: 2,280,200 mtCO2e (+10%) § 2019: 2,079,000 mtCO2e (+9%) The regional breakdown in 2021 was: 38% AMER (881,100 mtCO2e); 34% APAC (786,200 mtCO2e); 28% EMEA (640,300 mtCO2e) . Scope 2 Market-based GHG emissions (electricity + chilled water) including contribution of renewable energy purchasing, with YOY trend: § 2021: 254,800 mtCO2e (-22%) § 2020: 327,700 mtCO2e (+7%) § 2019: 306,000 mtCO2e (+36%) – driven by acquisitions The regional breakdown in 2021 was: 3% AMER (8,200 mtCO2e); 96% APAC (245,100 mtCO2e); 1% EMEA (1,500 mtCO2e) . Market-based methodologies take into account Equinix’s large renewable energy purchases, which allow us to use a 0 mtCO2e/MWh emissions factor (or net zero emissions from electricity) . 17
GRI 305: EMISSIONS, continued Disclosure No. Disclosure Title 2021 Response 305-3 Energy indirect (Scope 2) GHG emissions Scope 3 emissions come from: § Capital Goods § Purchased Goods & Services § FERA - Upstream Electricity (Market-Based)* § Business travel (Air, Hotel, Rail, Rental Car) § Employee commuting (Employee commuting to office, work from home associate with COVID-19 Pandemic) § Waste Scope 3 totals** were: § 2021 = 1,504,000 mtCO2e § 2020 = 1,318,000 mtCO2e § 2019 = 1,311,000 mtCO2e *For 2019 and 2020, Equinix has reported FERA Location-Based emissions but has elected to report FERA Market-Based emissions moving forward as it better reflects Equinix operations . ** The 2019 and 2020 Scope 3 totals have been adjusted to reflect FERA Market- Based emissions 305-4 GHG emissions intensity Carbon Intensity as measured by total emissions (Scope 1 + Scope 2 Market-based emissions) per unit revenue (million USD) was: 2021: 46 mtCO2e per million USD (change of -28% YOY) 2020: 64 mtCO2e per million USD (change of +2% YOY) 2019: 62 mtCO2e per million USD (change of +16% YOY) Carbon intensity is driven both by our supplier-based emissions factors and our purchases of low-carbon and renewable energy, as well as how we generate revenue around the world . The trend of intensity increasing in 2020 was driven by organic growth in regions without renewable energy (e .g . Australia) . 305-5 Reduction of GHG emissions Equinix sources clean and renewable energy around the world to make progress against our 100% renewable energy goal . Renewable energy coverage vs . our electricity usage in 2021 was: § Americas: 2,980 GWh out of 2,986 GWh (100%) § Asia-Pacific: 1,119 GWh out of 1,474 GWh (76%) § EMEA: 2,674 GWh out of 2,675 GWh (100%) § Global: 6,773 GWh out of 7,136 GWh (95%) Specifically, Renewable Energy purchases reduce Scope 2 GHG emissions (from location-based to market-based): § 2021: 2,052,800 mtCO2e reduction (2,307,600 reduced to 254,800 mtCO2e) § 2020: 1,952,500 mtCO2e reduction (2,280,200 reduced to 327,700 mtCO2e) § 2019: 1,773,000 mtCO2e reduction (2,079,000 reduced to 306,000 mtCO2e) (Note: Scope 2 includes electric power, fuel cells under power purchase agreement, and chilled water) GRI 401: EMPLOYMENT Disclosure No. Disclosure Title 2021 Response 103-1 Explanation of the material topic and its Boundary Materiality Assessment 103-2 103-3 The management approach and its components Evaluation of the management approach Equinix’s Social efforts 18
GRI 401: EMPLOYMENT, continued Disclosure No. Disclosure Title 2021 Response 401-1 New employee hires and employee turnover New employees hired and (hire rate): § 2021: 1,751 (17%) § 2020: 1,803 (20%) § 2019: 1,666 (20%) § 2018: 1,243 (17%) Note: numbers depict how many people were hired during the year both for newly created positions and for positions that became vacant as a result of employee attrition . Employees added as a result of acquisitions are not included . New Hire rate = # of new hires / average annual head count . Employee turnover rate: § 2021: 10% § 2020: 7% § 2019: 13% § 2018: 12% Represents how many employees left the organization voluntarily (includes retirement and death) as well as involuntarily (due to dismissal, misconduct, job performance, etc .) . 401-3 Parental leave Retention rate after parental leave (for EMEA and the Americas 2018; Americas and APAC 2019, 2020 and 2021): § 2021: Of 147 employees who took leave in 2020, 99% were still at Equinix in 2021 (100% of men, 96% of women) § 2020: Of 109 employees who took leave in 2019, 90% were still at Equinix in 2020 (90% of men, 92% of women) § 2019: Of 61 employees who took leave in 2018, 93% were still at Equinix in 2019 (100% of men, 83% of women) § 2018: Of 82 employees who took leave in 2017, 79% were still at Equinix in 2018 (85% of men, 73% of women) SOC-3-a (Equinix Internal Metric) Employee satisfaction – survey response rate In 2020, Equinix moved from administering its Pulse Survey from twice a year to administering it on a quarterly basis . The “response rate” metric shows how many employees participated in the Pulse Survey . Higher response rate is preferred because it indicates that the survey is representative of a larger percentage of the employee population . The Pulse Survey was released four times in 2021: § In Q1 of 2021, 81% of employees completed the survey . § In Q2 of 2021, 78% of employees completed the survey . § In Q3 of 2021, 79% of employees completed the survey . § In Q4 of 2021, 79% of employees completed the survey . When averaged across the quarters, the response rate was 79% . SOC-3-b (Equinix Internal Metric) Employee satisfaction – survey results Employee satisfaction is derived from the Pulse Survey administered each quarter . In 2021, employees responded with a satisfaction score of 84 in Q1, 83 in Q2, 83 in Q3 and 82 in Q4 . 19
GRI 403: OCCUPATIONAL HEALTH AND SAFETY Disclosure No. Disclosure Title 2021 Response 103-1 Explanation of the material topic and its Boundary Materiality Assessment 103-2 103-3 The management approach and its components Evaluation of the management approach Equinix’s Social efforts 403-9 Work-related injuries In 2021, Equinix had: § No fatalities as a result of work-related injury; § 0% high consequence work-related injury rate; and § A recordable work-related injury rate of 0 .31 globally per 200,000 hours worked . Equinix previously reported its absentee rate and lost day rates for the U .S . and Canada, but it is not a recommended disclosure in the new version of the GRI Standards: GRI 403: Occupational Health and Safety 2018 . To request this information, please contact sustainability@equinix . com . GRI 404: TRAINING AND EDUCATION Disclosure No. Disclosure Title 2021 Response 103-1 Explanation of the material topic and its Boundary Materiality Assessment 103-2 103-3 The management approach and its components Evaluation of the management approach Equinix’s Social efforts 404-1 Average hours of training per year per employee In 2021, Equinix employees averaged 21 . 7 hours of training per employee per year . 404-2 Programs for upgrading employee skills and transition assistance programs Learning resources available to employees include: Equinix-specific material created and deployed by various departments such as HR, Sales, Operations, Customer Care; CrossKnowledge libraries; Project Management; Agile; PMP Certification; Digital Literacy; Microsoft Office; Leadership; LinkedIn Learning; and a large variety of leadership and soft skills training resources . Equinix also has robust training programs covering our global policies and procedures . These are mandatory courses assigned to all employees, and are available in multiple languages . Examples include: Global Code of Business Conduct; Anti-Bribery and Corruption; Preventing Workplace Harassment (in U .S . and Asia-Pacific); Security Awareness and Responsibility; Business Continuity Training; and an introduction to REITs . Training and resources are also provided through external channels such as function-specific conferences and function- specific trainings such as Tableau training . Equinix also offers tuition reimbursement for academic programs, which contributes to overall employee development . In 2021, Equinix averaged $722 in training costs per FTE . GRI 405: DIVERSITY AND EQUAL OPPORTUNITY Disclosure No. Disclosure Title 2021 Response 103-1 Explanation of the material topic and its Boundary Materiality Assessment 103-2 103-3 The management approach and its components Evaluation of the management approach Equinix’s Social efforts 20
GRI 405: DIVERSITY AND EQUAL OPPORTUNITY, continued Disclosure No. Disclosure Title 2021 Response 405-1 Diversity of governance bodies and employees The 2021 composition of Equinix’s governance bodies and Executive team was as follows: § Board of Directors: 6 Men: 3 Women (67%; 33%) § E-staff members: 9 Men: 1 Woman (90%; 10%) The 2021 composition of Equinix’s employees was as follows: § Regional FTEs*: Americas (5,011), Asia-Pacific (2,154), EMEA (3,447), TOTAL (10,612) § Regional Breakdown: Americas (47%), Asia-Pacific (20%), EMEA (32%) § Gender Diversity: Women (25 .3%), Men (74 .2%), Decline to ID (0 .5%) § Race/Ethnic Diversity (U .S . only): Black/African American (6 .3%), Hispanic/Latinx (13 .2%), Asian (24 . 7%), White (47 .1%), Other (4 .6%), Decline to ID (4 . 1%) § Age Diversity: Gen Z (1999–2012) (0 .30%), Millennials (1982–1999) (48 .4%), Gen X (1965–1981) (43 .8%), Baby Boomers (1946–1964) (7 .3%), Decline to ID (0 .2%) § Age Diversity: Under 30 (13%), 30–50 (66 . 1%), Over 50 (20 .7%), Decline to ID (0 .2%) § Skills Diversity: General & Administrative (26%), Sales & Marketing (16 .4%), Operations (43 .3%), Technology (14 .3%) Representation of Women in 2021 by level, globally: § Representation of women at VP and above levels were at 30 .6% § Representation of women at Manager and above levels were at 27 .9% § Representation of women below Manager levels were at 24% Representation of Women in 2021 in technology roles, globally: § Representation of women in technology roles were at 41 .3%, up 3% from 2020 Representation at each level by Race/Ethnicity (for the U .S . only): § At VP level and above: Black/African American (2 .9%), Hispanic/Latinx (4 .9%), Asian (16 .5%), White (71 .8%), Other (1 . 0%), Decline to ID (2 .9%) § At Manager level and above: Black/African American (3 . 1%), Hispanic/Latinx (6%), Asian (29 .1%), White (53 .8%), Other (3 . 7%), Decline to ID (4 .4%) § At levels below Manager: Black/African American (9 .4%), Hispanic/Latinx (19 .8%), Asian (20 .6%), White (40 .9%), Other (5 .5%), Decline to ID (3 .9%) * Regional FTE numbers may differ between the 10-K and Sustainability Report due to reporting boundaries . 405-2 Ratio of basic salary and remuneration of women to men See Commitment to Equitable Pay for additional information . We are advocates of pay equity . Our Rewards & Compensation team engages in regular market studies about pay, and since 2017, our global guidance to hiring managers is to refrain from asking candidates about their salary history, and instead focus on the appropriate pay for the job being offered . Globally, Equinix representation of women in the workforce and in leadership roles is on par with our peers in the industry . 21
GRI 406: NON-DISCRIMINATION Disclosure No. Disclosure Title 2021 Response 103-1 Explanation of the material topic and its Boundary Materiality Assessment 103-2 103-3 The management approach and its components Evaluation of the management approach Equinix’s Social efforts 406-1 Incidents of discrimination and corrective actions taken Equinix takes seriously the importance of offering a workplace free of unlawful discrimination, harassment and retaliation . Our company policies, including our Employee Handbooks and Code of Business Conduct , prohibit discrimination and outline Equinix’s policies preventing unlawful discrimination, harassment and retaliation, and the numerous resources employees have if they wish to report any potential violations of these policies . Equinix also conducts harassment training in the U .S . and Asia-Pacific . All reports of potential violations of policy are promptly and adequately addressed by members of Equinix’s HR and/or Legal departments . Equinix is opposed to modern slavery and human trafficking in all its forms and expects the same opposition from all who work for us . Equinix requires all business partners to adhere to human rights, employee health and safety, and a voluntary labor force in accordance with the United Nation Declaration on Human Rights and the International Labour Organization Declaration on Fundamental Principles and Rights at Work, as outlined in the Business Partner Code of Conduct . In 2021, Equinix had 0 verified incidents of discrimination . GRI 417: MARKETING AND LABELING Disclosure No. Disclosure Title 2021 Response 103-1 Explanation of the material topic and its Boundary Materiality Assessment 103-2 103-3 The management approach and its components Evaluation of the management approach Equinix’s Environment efforts 417-1 Requirements for product and service information and labeling Equinix data centers provide a secure and reliable place for our customers’ IT equipment . Equinix supplies the power needed to run that equipment 24/7 . In 2021, Equinix tracked the energy content for 100% of its IBX data centers globally and makes available energy consumption, energy efficiency and renewable energy data to its customers . We believe that data centers can leverage their large electricity loads for positive social and environmental impact, and Equinix’s 100% renewable energy goal is bringing more renewable energy generation sources online both locally and regionally in order to address the urgent need to move utility grids away from fossil fuels to address climate change . Upon request, customers can access custom Green Power Reports for their deployments within Equinix data centers . All deployments covered 100% with renewable energy in the calendar year result in a net zero market-based carbon emissions factor (CEF) for electricity at those sites . 22
GRI 417: MARKETING AND LABELING, continued Disclosure No. Disclosure Title 2021 Response SOC-12 (Equinix Internal Metric) Customer experience Equinix is built on a culture of putting the customer at the center of everything we do . Aligning around the customer means delivering value for their business, building long-term strategic partnerships and driving loyalty by listening to and acting on their feedback . We want customers to recommend Equinix above all others because we deliver experiences they value with the digital infrastructure they trust . We aim to reach 100% of our customers through our ongoing Net Promoter Score (NPS) survey, listening and learning across all industries and personas . We are pleased that customer sentiment has reflected our NPS above the tech industry average for all four years of measurement with this metric . In 2021, we saw our score continue to increase year on year, represented by 5,800 voices . Our efforts to make the customer experience a strategic differentiator revolve around: § Listening – We listen through voice-of-the-customer programs that aggregate feedback from a variety of sources, including outbound surveys, events and focus groups, passive forms/surveys, online feedback buttons and employee collected forms . § Analyzing the Data – We measure feedback from customers’ experiences during value moments and by collecting data on how they feel about our overall relationship . Learnings from the analysis inform our strategy and shape our customer improvement initiatives and focus areas . § Taking Action – As we prioritize, implement and track customer improvements across the company, our goal is to ensure our actions are delivering value and positively impacting our customers’ experience . § Sharing Progress – Finally, we recognize that customer improvements aren’t meaningful if no one knows about them . We follow up with customers so they know their voice is being heard and to demonstrate how their feedback makes a difference in how they can expect to do business with us . GRI 418: CUSTOMER PRIVACY Disclosure No. Disclosure Title 2021 Response 103-1 Explanation of the material topic and its Boundary Materiality Assessment 103-2 103-3 The management approach and its components Evaluation of the management approach Equinix protects our customers’ business contact information and other personal data used to facilitate access to our data centers . Equinix has delivered a cross- functional compliance program to implement the EU’s General Data Protection Regulation (GDPR) . GDPR is a comprehensive set of data privacy compliance measures, including stringent personal data breach notification measures, and a process for responding to individual subject access requests . GDPR compliance is implemented across our global platform for systems, processes and policies that handle personal data of our customers, employees and other third parties, helping us facilitate compliance with new data privacy laws as they emerge globally . As Equinix launches new applications and systems, the Equinix Privacy Office is embedded in the process for such builds and launches to ensure that data privacy processes and policies are appropriately addressed . The Privacy Office is led by Legal with functional representation that manages this program of work, and reports to the Nominating and Governance Committee of the Board . The Privacy Office continues to oversee data privacy compliance at Equinix in all applicable markets on an ongoing basis . Equinix continues its involvement across our global customer base to assist customers in their own data privacy compliance, as appropriate . 418-1 Substantiated complaints concerning breaches of customer privacy and losses of customer data In 2021, no material complaints concerning breaches of data privacy impacting our customers or losses of customer data were substantiated . 23
GRI 419: SOCIOECONOMIC COMPLIANCE Disclosure No. Disclosure Title 2021 Response 103-1 Explanation of the material topic and its Boundary Materiality Assessment 103-2 103-3 The management approach and its components Evaluation of the management approach Equinix’s Governance efforts 419-1 Non-compliance with laws and regulations in the social and economic area As a global company, Equinix must comply with the law in all the places we do business . Our Code of Business Conduct makes clear, and our employees receive training that explains, all employees are responsible for understanding and complying with the laws and regulations that affect our jobs . In this way we aim to proactively avoid both the monetary and reputational risks associated with sanctions and fines for non-compliance with appliable laws . In 2021, Equinix received no significant or material fines or non-monetary sanctions for non- compliance with laws and regulations . C OMPANY-SPECIFIC METRICS Disclosure No. Disclosure Title 2021 Response SOC-10 (Equinix Internal Metric) Total customer uptime in a given year as measured in yearly availability . Equinix IBX data centers feature advanced design, security, power and cooling elements to provide customers with industry- leading reliability, including average uptime of 99 .9999% globally in 2021 . As of December 31, 2021, all Equinix IBX data centers are equipped with UPS power, backup systems and N+1 (or greater) redundancy . The company guarantees certain service levels, such as uptime, as outlined in individual customer contracts . SOC-11 (Equinix Internal Metric) Annual Average Power Usage Effectiveness (PUE) Equinix measures PUE, a measure of data center efficiency, at all of its sites . We are transitioning to PUE1, a 12-month rolling average of PUE . Although currently sites are reporting data differently, we report an annual average PUE of 1 .48 across our global portfolio in 2021 . This excludes recent and planned acquisitions such as GPX and MainOne . 24
Equinix.com EMEA Equinix (EMEA) BV Rembrandt Tower Amstelplein 1 1096 HA Amsterdam Netherlands +31 .20 .754 . 0305 info@eu . equinix . com Asia-Pacific Equinix Hong Kong Limited 65/F International Commerce Center 1 Austin Road West Kowloon, Hong Kong +852 .2970 .7788 info@ap .equinix . com Americas Corporate HQ Equinix, Inc . One Lagoon Drive Redwood City, CA 94065 USA +1 .650 .598 .6000 info@equinix . com “At Moody’s, we strive to partner with suppliers like Equinix who make our value chain more sustainable . We are grateful for their commitment to achieving net-zero and excited that they have adopted science-based targets . Our partnership with Equinix helps us meet our own net-zero goals, as we continue working toward decarbonizing our supply chain and creating a more sustainable future .” Moody’s Corporation