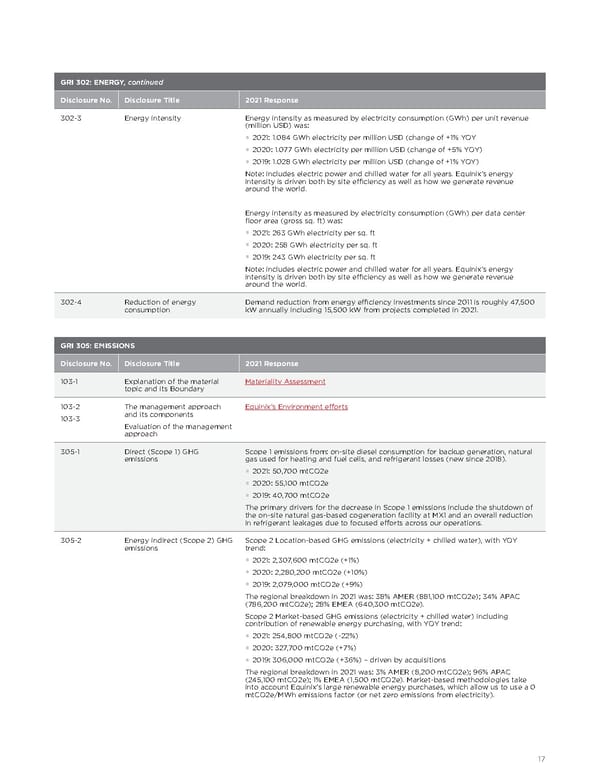
GRI 302: ENERGY, continued Disclosure No. Disclosure Title 2021 Response 302-3 Energy intensity Energy intensity as measured by electricity consumption (GWh) per unit revenue (million USD) was: § 2021: 1 . 084 GWh electricity per million USD (change of +1% YOY § 2020: 1 . 077 GWh electricity per million USD (change of +5% YOY) § 2019: 1 . 028 GWh electricity per million USD (change of +1% YOY) Note: includes electric power and chilled water for all years . Equinix’s energy intensity is driven both by site efficiency as well as how we generate revenue around the world . Energy intensity as measured by electricity consumption (GWh) per data center floor area (gross sq . ft) was: § 2021: 263 GWh electricity per sq . ft § 2020: 258 GWh electricity per sq . ft § 2019: 243 GWh electricity per sq . ft Note: includes electric power and chilled water for all years . Equinix’s energy intensity is driven both by site efficiency as well as how we generate revenue around the world . 302-4 Reduction of energy consumption Demand reduction from energy efficiency investments since 2011 is roughly 47,500 kW annually including 15,500 kW from projects completed in 2021 . GRI 305: EMISSIONS Disclosure No. Disclosure Title 2021 Response 103-1 Explanation of the material topic and its Boundary Materiality Assessment 103-2 103-3 The management approach and its components Evaluation of the management approach Equinix’s Environment efforts 305-1 Direct (Scope 1) GHG emissions Scope 1 emissions from: on-site diesel consumption for backup generation, natural gas used for heating and fuel cells, and refrigerant losses (new since 2018) . § 2021: 50,700 mtCO2e § 2020: 55,100 mtCO2e § 2019: 40,700 mtCO2e The primary drivers for the decrease in Scope 1 emissions include the shutdown of the on-site natural gas-based cogeneration facility at MX1 and an overall reduction in refrigerant leakages due to focused efforts across our operations . 305-2 Energy indirect (Scope 2) GHG emissions Scope 2 Location-based GHG emissions (electricity + chilled water), with YOY trend: § 2021: 2,307,600 mtCO2e (+1%) § 2020: 2,280,200 mtCO2e (+10%) § 2019: 2,079,000 mtCO2e (+9%) The regional breakdown in 2021 was: 38% AMER (881,100 mtCO2e); 34% APAC (786,200 mtCO2e); 28% EMEA (640,300 mtCO2e) . Scope 2 Market-based GHG emissions (electricity + chilled water) including contribution of renewable energy purchasing, with YOY trend: § 2021: 254,800 mtCO2e (-22%) § 2020: 327,700 mtCO2e (+7%) § 2019: 306,000 mtCO2e (+36%) – driven by acquisitions The regional breakdown in 2021 was: 3% AMER (8,200 mtCO2e); 96% APAC (245,100 mtCO2e); 1% EMEA (1,500 mtCO2e) . Market-based methodologies take into account Equinix’s large renewable energy purchases, which allow us to use a 0 mtCO2e/MWh emissions factor (or net zero emissions from electricity) . 17
 Equinix Sustainability Report Page 18 Page 20