ESG Report | IBM
2021 ESG Report IBM impact
Contents Ethical impact Introduction Environmental impact Appendix Equitable impact Governance Introduction Social Environment 2 IBM 2021 ESG Report 2 IBM 2021 ESG Report
Introduction 3 IBM 2021 ESG Report 3 IBM 2021 ESG Report 3 IBM 2021 ESG Report

This is a modal window.
Arvind Krishna Chairman and Chief Executive Officer IBMers have always applied their time, talent, and technology to make a meaningful impact in the world, evolving the nature of their work over time to meet the most urgent needs of society. This is true in both IBM’s core business and in the many ways IBMers engage with the global community. Today, that includes standing with the people of Ukraine. IBM condemns Russia’s war against Ukraine in the strongest terms. We suspended business in Russia and are taking steps to protect IBMers in that country who may be facing difficult circumstances. We covered the costs of relocating IBM employees in Ukraine to neighboring countries and are providing for their physical and mental health. IBMers are supporting the Red Cross in Ukraine, and IBM is matching all employee donations to the organization. Letter from the Chairman and CEO ↗ 4 IBM 2021 ESG Report 4 IBM 2021 ESG Report
Ethical impact As a responsible steward of technology, IBM is focused on developing policies and practices that prioritize ethics, trust, transparency, and accountability. Our clients and partners must drive innovation while delivering the highest standards of security, privacy, data protection, and compliance. We are committed to supporting them as the most trusted and ethical technology partner of the 21st century. That is why IBM will train 1,000 partners in technology ethics by the end of 2022. It is also why we added a diversity modifier to our executive compensation program to reinforce accountability for building a diverse workplace, a key organizational goal. I invite you to read more about our efforts to make an impact wherever it is needed. As always, we stand ready to collaborate with our clients, partners, and governments to build a safer, more equitable, and peaceful future. I am humbled and inspired by IBMers’ dedication to this critical work. Thanks to them, IBM is well positioned to fulfill its purpose—to be the catalyst that makes the world work better—for decades to come. Arvind Krishna Chairman and Chief Executive Officer Environmental impact In 2021, we continued IBM’s long tradition of conserving natural resources and reducing pollution, using renewable energy, and developing solutions to climate change. IBM set a new 2025 greenhouse gas emissions reduction goal that exceeds the rate of reduction that the UN Intergovernmental Panel on Climate Change indicates is necessary to limit Earth’s warming 1.5 degrees Celsius above pre-industrial levels. This is another milestone in our roadmap to achieve net-zero greenhouse gas emissions by 2030. We are also applying our technology and expertise to help make net zero a reality for our clients. Earlier this year we announced the acquisition of Envizi, a leader in environmental performance management. Building on other IBM investments in AI-powered software, Envizi will help organizations create more resilient and sustainable operations and supply chains. IBM also increased its waste recycling goal, committing to divert 90% of IBM’s total nonhazardous waste from landfills and incineration by 2025. Equitable impact IBM is proud of its inclusive culture and the programs we have established globally to provide wider access to critical skills and training. This focus on inclusivity extends across our business. In 2021, IBM again grew the percentage of women and underrepresented minorities in our workforce as a whole as well as in our executive ranks. We also committed to dedicating 15% of our first-tier diversity supplier spending to Black-owned businesses by 2025. Through IBM’s career-building programs and more than 170 new academic and industry partnerships, we are committed to skilling 30 million people globally by 2030. IBM is investing $250 million by 2025 in our apprenticeship and new collar programs, which offer alternative paths to in-demand skills and tech industry jobs. And we established a target of 4 million IBM volunteer hours by 2025. 5 IBM 2021 ESG Report 5 IBM 2021 ESG Report
IBMers have mobilized and are participating in multiple volunteering initiatives, once again showcasing the best of IBM values and culture. The war situation is fast evolving as of the writing of this report, but we know IBMers around the world remain unified in our hope that peace can be quickly restored. We commend world leaders who have acted decisively in hopes of expediting an end to this war. IBM does not condone violence or acts of aggression, and we firmly condemn the Russian war in Ukraine. Thanks to the continued generosity of IBMers around the world, we have now raised over $1.85 million ($925,000 in IBMer donations, plus a $925,000 company match) for the International Committee of the Red Cross. IBM also donated $250,000 each to two local organizations that are providing critical support to the most heavily impacted areas along the borders of and in Ukraine: People in Need, and Polish Humanitarian Action. The safety and security of IBMers is at the heart of all our decisions, and our top priority is IBMers and their families in the impacted regions. Since February 2022, we have been providing them with relocation assistance, financial support, and other forms of direct engagement. On March 7, 2022, IBM announced the suspension of business activities in Russia. The war in Ukraine and IBM’s efforts ↗ 6 IBM 2021 ESG Report 6 IBM 2021 ESG Report
ESG at IBM ↗ IBM is always focused on the challenges and complexities facing today’s world. Environmental, social, and governance (ESG) reporting at IBM embodies this philosophy through three pillars. Equitable impact Creating spaces and opportunities for everyone by focusing on diversity, equity, and inclusivity within IBM as well as globally Environmental impact Creating better pathways to conserve natural resources, reduce pollution, and minimize climate-related risks Creating innovations, policies, and practices that prioritize ethics, trust, transparency, and above all—accountability Ethical impact IBM impact 7 IBM 2021 ESG Report 7 IBM 2021 ESG Report
Environmental impact – Reach net-zero greenhouse gas emissions by 2030 – Divert 90% (by weight) of IBM’s total nonhazardous waste from landfill and incineration by 2025 – Initiate 100 client engagements or research projects by 2025 in which IBM solutions have enabled demonstrable environmental benefits Equitable impact – Skill 30 million people globally by 2030 – Log 4 million volunteer hours by 2025 – $250 million investment in apprenticeship and new collar programs by 2025 – 15% of first-tier supplier diversity spend with Black-owned suppliers by 2025 Ethical impact – Include technology ethics education in training for IBM ecosystem partners, reaching 1,000 partners by end of 2022 – Added diversity modifier to executive annual incentive program metrics – Engage 100% of suppliers on sound practices, including social and environmental responsibility, ethics, and risk planning This report covers our progress and performance in 2021 and some notable activities during the first quarter of 2022. In selecting content for inclusion, we were inspired by frameworks and initiatives such as the Global Reporting Initiative (GRI) Standards, the Sustainability Accounting Standards Board, the Task Force on Climate-Related Financial Disclosures (TCFD), the Stakeholder Capitalism Metrics, and the United Nations Sustainable Development Goals. IBM’s full GRI report, using the GRI Standards guidelines, can be found online. 1 In 2021, we engaged Business for Social Responsibility (BSR)— a nonprofit consultancy dedicated to sustainability—to provide input on our ESG priorities and to inform our ongoing ESG reporting strategy. The data in this report covers our global operations. The information in this report has not been externally assured by third parties, except where noted. With the separation of Kyndryl on November 3, 2021, for comparability purposes, the qualitative and quantitative data included in this report is not consistent with the presentation in the 2020 and earlier reports, which included Kyndryl data. Except where noted, the presented data excludes Red Hat,® which can be found at the Red Hat Community and Social Responsibility website. You can find the unofficial submission of Red Hat EEO-1 data as of December 31, 2021, on our ESG website . Information about our business and financial performance is provided in the 2021 IBM Annual Report . Examples of IBM’s commitment to creating environmental impact, equitable impact, and ethical impact: 1 Each of the frameworks and initiatives referenced above discloses policies and material metrics related to ESG topics. However, the concept of materiality is defined differently under these reporting frameworks, and we do not attempt to formally reconcile the divergent uses of the term “materiality” by these frameworks. 8 IBM 2021 ESG Report 8 IBM 2021 ESG Report
Human rights salience assessment In 2019 IBM adopted a Human Rights Statement of Principles , committing IBM to respecting human rights in line with international standards, such as the UN Guiding Principles on Business and Human Rights, the Universal Declaration of Human Rights, and the ILO Declaration on Fundamental Principles and Rights at Work. In 2021, we began working with a sustainability and human rights nonprofit to identify and prioritize the salient human rights risks across our business. This work has continued into 2022. We will use the assessment to identify gaps in human rights risk management, prioritize areas for future due diligence, and inform the development of a human rights strategy going forward. The list of our salient human rights issues is in the chart below: Accountability of ESG at IBM IBM’s long-term performance strategy integrates economic, environmental, and societal performance and leadership. IBM’s Board of Directors and its committees have oversight responsibility for these areas and under their guidance and supervision, IBM senior management is responsible for the company’s environmental and social performance. Two groups help to integrate corporate responsibility across the business: The ESG Executive Steering Committee provides leadership and direction on key corporate responsibility issues and approves organization-wide goals. It meets monthly, chaired by the Vice President for IBM Corporate Social Responsibility and ESG, and includes senior executives from functional areas across IBM. Each functional area is responsible for developing its goals and strategy. Members include: – Vice President, IBM Research Climate and Impact Science – Vice President and Chief Sustainability Officer – Vice President, Global Labor Relations – Vice President and Chief Diversity and Inclusion Officer – Vice President and Chief Privacy Officer – Vice President and Chief Procurement Officer – Vice President, Investor Relations – Vice President, Government and Regulatory Affairs – Vice President, Assistant General Counsel & Corporate Secretary – Vice President and Chief Accountant The ESG Working Group , led by the Director of ESG Strategy and Programs, sustains awareness of work related to ESG matters occurring across the company, and helps bring forward for discussion the interests of external parties. It includes representatives from functional areas across IBM and meets at least monthly to review key policy and strategic issues, and to make recommendations to the ESG Executive Steering Committee. IBM’s Corporate Social Responsibility and ESG functions, which report to the Senior Vice President, Marketing and Communications and Chief Communications Officer, coordinate day-to-day ESG-related activities. Salient human rights issues Product and Research Misuse Inequality / Discrimination via Products Human Rights in the Supply Chain Privacy and Cybersecurity Ethics and Corruption Human Autonomy and Dignity Freedom of Expression and Access to Information Labor Rights at IBM Climate and Human Rights Right to Science 9 IBM 2021 ESG Report 9 IBM 2021 ESG Report
IBM’s ESG strategy Environment VP and Chief Sustainability Officer VP, Corporate Social Responsibility and ESG VP, Corporate Social Responsibility and ESG Finance and Operations VP and Chief Accountant Human Resources VP, Global Labor Relations VP and Chief Diversity and Inclusion Officer Supply Chain VP and Chief Procurement Officer Research VP, IBM Research Climate and Impact Science Government and Regulatory Affairs VP, Government and Regulatory Affairs Investor Relations VP, Investor Relations Governance VP, Assistant General Counsel and Secretary VP and Chief Privacy Officer Additional members Chair Oversight IBM Board of Directors Leadership Advising Support ESG Steering Committee ESG Working Group SVP, Marketing and Communications & Chief Communications Officer Director, ESG Strategy and Programs 10 IBM 2021 ESG Report 10 IBM 2021 ESG Report
Governance 11 IBM 2021 ESG Report 11 IBM 2021 ESG Report
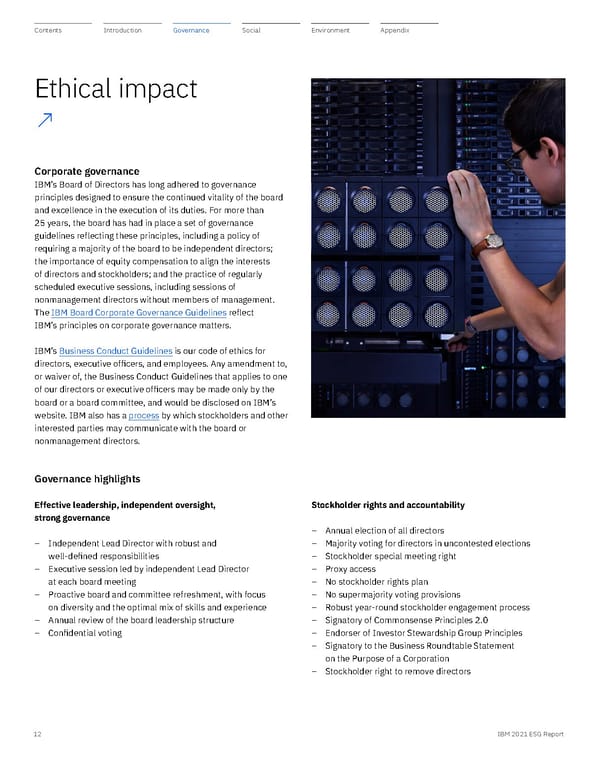
Stockholder rights and accountability – Annual election of all directors – Majority voting for directors in uncontested elections – Stockholder special meeting right – Proxy access – No stockholder rights plan – No supermajority voting provisions – Robust year-round stockholder engagement process – Signatory of Commonsense Principles 2.0 – Endorser of Investor Stewardship Group Principles – Signatory to the Business Roundtable Statement on the Purpose of a Corporation – Stockholder right to remove directors Ethical impact ↗ Corporate governance IBM’s Board of Directors has long adhered to governance principles designed to ensure the continued vitality of the board and excellence in the execution of its duties. For more than 25 years, the board has had in place a set of governance guidelines reflecting these principles, including a policy of requiring a majority of the board to be independent directors; the importance of equity compensation to align the interests of directors and stockholders; and the practice of regularly scheduled executive sessions, including sessions of nonmanagement directors without members of management. The IBM Board Corporate Governance Guidelines reflect IBM’s principles on corporate governance matters. IBM’s Business Conduct Guidelines is our code of ethics for directors, executive officers, and employees. Any amendment to, or waiver of, the Business Conduct Guidelines that applies to one of our directors or executive officers may be made only by the board or a board committee, and would be disclosed on IBM’s website. IBM also has a process by which stockholders and other interested parties may communicate with the board or nonmanagement directors. Governance highlights Effective leadership, independent oversight, strong governance – Independent Lead Director with robust and well-defined responsibilities – Executive session led by independent Lead Director at each board meeting – Proactive board and committee refreshment, with focus on diversity and the optimal mix of skills and experience – Annual review of the board leadership structure – Confidential voting 12 IBM 2021 ESG Report
Diverse and global perspective— The board’s diversity and international experience is crucial for IBM, which operates in more than 175 countries. Our business success is derived from an understanding of diverse business environments and economic conditions, and a broad perspective on global business opportunities. The board includes directors who have a deep understanding of our business, and members who bring new skills and fresh perspectives. We have a deliberate mix of age and tenure on the board, which reflects our commitment to ongoing and proactive board refreshment. – Eleven out of 12 director nominees are independent. – In the last three years, two women directors and three ethnically diverse directors were added. – The average tenure of director nominees is 4.9 years. – Fifty percent of our director nominees were first elected to our board in the past three years. The directors, the Corporate Governance Committee, and the board believe that the abovementioned attributes, along with the leadership skills and other experiences of the board members described below, provide IBM with the perspectives and judgment necessary to guide IBM’s strategies and oversee their execution. IBM’s Board of Directors The IBM Board is composed of a diverse group of members, all leaders in their respective fields. All current directors have leadership experience at major domestic and international organizations with operations inside and outside the United States, at academic or research institutions, or in government. Directors also have deep industry expertise as leaders of organizations within some of the company’s most important client industries and constituencies. Business operation, innovation, transformation, and digital experience— For over a century, IBM has continuously reinvented itself to help its clients move from one era to the next. The ability to comprehend and analyze complex matters, including technology, is key to the IBM board’s oversight of the company’s innovation and digital transformation. All IBM directors have led large organizations—crucial experience for understanding and overseeing the scale, scope, and complexity of IBM’s business. Industry expertise— IBM uniquely combines innovative technology with deep industry expertise, underpinned by security, trust, and responsible stewardship. IBM’s directors have experience leading organizations in a variety of industries that enhance the board’s knowledge. Their perspectives on contemporary business issues and experience running data-intensive organizations are an asset to the company and to our stockholders. IBM Board of Directors—Experience and skills of director nominees Director Thomas Buberl David N. Farr Alex Gorsky Michelle J. Howard Arvind Krishna Andrew N. Liveris F. William McNabb III Martha E. Pollack Joseph R. Swedish Peter R. Voser Frederick H. Waddell Alfred W. Zollar Client industry † expertise Financial Services and Insurance Manufacturing Healthcare Government Information Technology Chemicals Financial Services and Insurance Research and Development Healthcare Energy Financial Services and Insurance Information Technology Organizational leadership and management ✓ ✓ ✓ ✓ ✓ ✓ ✓ ✓ ✓ ✓ ✓ ✓ Global operations ✓ ✓ ✓ ✓ ✓ ✓ ✓ ✓ ✓ ✓ ✓ ✓ CFO ✓ Specific risk oversight/ risk management exposure ✓ ✓ ✓ ✓ ✓ ✓ ✓ ✓ ✓ ✓ ✓ ✓ Technology, cybersecurity, or dgital ✓ ✓ ✓ ✓ ✓ ✓ ✓ ✓ ✓ ✓ ✓ ✓ Academia ✓ ✓ Government/regulatory, business associations, or public policy ✓ ✓ ✓ ✓ ✓ ✓ ✓ ✓ ✓ ✓ ✓ ✓ Public board ✓ ✓ ✓ ✓ ✓ ✓ ✓ ✓ ✓ Gender identity Male Male Male Female Male Male Male Female Male Male Male Male Race and/or ethnicity White/ Caucasian White/ Caucasian White/ Caucasian Black/African American Asian/Pacific Islander White/ Caucasian White/ Caucasian White/ Caucasian White/ Caucasian White/ Caucasian White/ Caucasian Black/African American Born outside the US ✓ ✓ ✓ ✓ † These client industries provide a snapshot into the many key and diverse industries in which our directors have relevant experience. Many of our directors have experience in multiple client industries. 13 IBM 2021 ESG Report
Risk management IBM’s consistent, systemic, and integrated approach to enterprise risk management (ERM) is designed to identify, mitigate, and manage significant risks. Our ERM function assesses risks across the organization to develop a holistic, enterprise-level view of risks arising from evolving regulatory or financial environments, operations, or strategic planning and execution—including environmental and climate-related risks. The program also assesses interdependencies between risks, and collaborates with risk owners to optimize actions across IBM. We also promote a company culture of risk awareness through online education and mandatory training in areas such as business integrity and cybersecurity—including a new Risk Academy, where IBMers can take courses and earn badges on risk management awareness and skills. Additionally, IBMers can report potential risks through numerous online channels (anonymously if preferred), or to local management. Oversight of risk management begins with IBM’s Board of Directors, which is responsible for assessing our ERM approach and overseeing management’s execution of its risk responsibilities. The board and its three committees receive periodic updates on the ERM program, and each committee examines specific risk components: – Audit Committee— Financial and audit risks identified through IBM’s enterprise management framework, including those related to cyber, privacy, and AI ethics. – Executive Compensation and Management Resources Committee— Risks related to compensation programs and employee engagement as an indicator of company culture, and reviews IBM’s human capital management, diversity and inclusion, and other management resources programs. – Directors and Corporate Governance Committee— Risks associated with government and industry regulations, as well as corporate social responsibility, sustainability, environmental, and other societal and governance matters. IBM’s senior management is responsible for assessing and managing IBM’s various exposures to risk on a day-to-day basis, while the ERM program is overseen by our chief risk officer (reporting to the CFO), a risk council of business unit and process leaders, and senior management’s relevant governance forums. IBM has developed tools that employ analytics and AI technologies to assist our ERM processes. Our Country Financial Risk Scorecard identifies emerging risk areas and alerts country and regional leadership so they can respond proactively. 14 IBM 2021 ESG Report
Business ethics IBM’s legacy of ethics and responsible business practices continues today in how we govern our operations and conduct relationships. Every year, employees worldwide participate in IBM’s Business Conduct Guidelines (BCGs) program to certify their understanding of IBM’s code of business conduct and ethics and recommit to doing business with integrity. The IBM BCGs policy is available in 26 languages, and the accompanying online course, which includes ethical dilemmas that employees may face day to day, is available in 20 languages. In 2021, IBM again achieved 100% participation in the annual BCGs program. In addition, IBM Trust and Compliance also conducts extensive in-person and virtual training on topics including public procurement, business amenities, anti-corruption, speaking up and nonretaliation, being a gatekeeper, and fraud prevention. These training initiatives are sponsored and attended by our business leaders, setting the tone from the top. These trainings are customized to highlight the risks the particular audience faces, and they leverage new tools and applications to drive engagement and participation, such as live polling. In 2021, Trust and Compliance also introduced behavioral ethics into many integrity education modules and sessions. IBM’s internal reporting channel, which was refreshed in 2021 to improve the user experience, enables employees to report concerns or suspected violations of our BCGs, as well as unethical or unlawful behavior within IBM. We also have similar reporting channels for suppliers, business partners, and others to raise concerns. Learning about issues and concerns allows IBM to intervene early, investigate, and remediate. Our annual Global Integrity Survey, first launched in 2010, enables IBMers to provide feedback on their perception of ethics and integrity within IBM. The insights gained from the surveys help us gauge employee sentiment regarding speaking up, retaliation, and “doing the right thing.” We also use the results to develop action plans to enhance training on targeted topics. In 2021, we conducted benchmarking to refresh our questions, which we anticipate will yield even better insights. Our education initiatives go beyond IBMers, as we expect our business partners and suppliers to meet our ethics and integrity standards. In 2021, IBM provided online and in-person education to over 34,000 representatives of partners and suppliers worldwide. Scenario Planning Advisor is an AI tool developed with IBM Research that combines human-domain knowledge with machine reasoning and planning to project a wide range of scenarios and emerging risks. Environmental and climate-related risks Climate change is a serious concern that warrants meaningful action on a global basis. IBM considers risks as identified by the TCFD in its risk management process. IBM, like other companies, is subject to potential climate-related risks and costs, such as those resulting from increased severe weather events, prolonged changes in temperature, new regulations affecting hardware products and data centers, carbon taxes, and increased environmental disclosures requested or required by clients, regulators, and others. IBM senior management assesses the significance of environmental and climate-related risks and opportunities, and manages them accordingly. Senior management regularly reports to the Directors and Corporate Governance Committee of the IBM Board of Directors on IBM’s environmental programs, challenges, and emerging issues. IBM does not expect climate change or compliance with environmental laws and regulations focused on climate change to have a disproportionate effect on the company or its financial position, results of operations, and competitive position. Conversely, we believe that there is opportunity to use IBM’s AI, hybrid cloud, and other technologies to assist clients with managing their climate-related risks, and we continue to invest in solutions such as the IBM Environmental Intelligence Suite and our recent acquisition of Envizi to enhance IBM’s capabilities in this area. 15 IBM 2021 ESG Report
Additionally, IBM is a member of the Data & Trust Alliance , established in 2020, to develop and adopt responsible data and AI practices. IBM helped lead the development of a set of criteria for organizations to measure against, in order to help mitigate against algorithmic bias and promote transparency and explainability when adopting AI to be used in human resources and workforce decisions. Other large employers have since endorsed this set of criteria. IBM was one of two original signatories to the Vatican’s Rome Call for AI Ethics in 2020, intended to promote cooperation in creating “a future in which digital innovation and technological progress grant mankind its centrality.” IBM will join other organizations in renewing our commitment to these principles in 2022. Emerging neurotechnologies already offer impressive benefits in areas such as healthcare, but this potential comes with questions about risks to privacy and consumer welfare. In 2021, the IBM Policy Lab and the Future of Privacy Forum jointly published “Privacy and the Connected Mind” —a set of recommendations for promoting privacy and mitigating risks relating to brain-computer interfaces, which can record, process, analyze, or modify brain activity, invasively or non-invasively. IBM believes that policymakers, researchers, and other stakeholders should proactively seek to understand these risks and develop precise technological and policy safeguards. Technology ethics As a company with a long history of pioneering new technologies responsibly, IBM is working to advance transformative innovations such as AI into business, government, medicine, and everyday life with a strong commitment to ethics. We advocate the IBM Principles for Trust and Transparency and work to embed ethical principles into our AI applications and processes. IBM continues to demonstrate leadership in AI Ethics, building on the portfolio of AI toolkits for trustworthy AI that we’ve contributed to the open source community. AI FactSheets 360 and Uncertainty Quantification 360 allow other organizations to use and contribute to our experience and knowledge in the creation of AI solutions. In 2022, IBM will include technology ethics in the training provided to our ecosystem partners, with a goal of 1,000 partners participating by year-end. The World Economic Forum and the Markkula Center for Applied Ethics at Santa Clara University recognized IBM as an AI ethics leader in 2021 with their publication of “Responsible Use of Technology: The IBM Case Study.” The white paper showcases IBM’s Trustworthy AI approach and best practices, recognizing many years of work that began in IBM Research and expanded across the IBM portfolio and beyond to external partnerships worldwide. The World Economic Forum Global Council launched the Global AI Action Alliance, a flagship initiative to accelerate the adoption of inclusive, transparent, and trusted artificial intelligence globally. The alliance is co-chaired by IBM CEO Arvind Krishna and brings together over 100 companies, governments, civil society organizations, and academic institutions to accelerate the adoption of AI in the global public interest. IBM and Notre Dame founded the Tech Ethics Lab in 2020 as a cross-disciplinary research initiative to examine real-world challenges and provide practical models and applied solutions for ethical technology design, development, and deployment. In 2021, the lab invited proposals for projects related to the ethics of technology scale, automation, identification, prediction, persuasion, and adoption. In January 2022, the lab announced that 26 projects would receive over $500,000 in combined funding, selected from more than 100 submissions. 16 IBM 2021 ESG Report
To validate IBM’s security controls, we ensure that they are tested and certified regularly through a combination of frameworks and assessment activities, including ISO, System and Organization Controls (SOC), the Sarbanes-Oxley Act, the Federal Risk and Authorization Management Program, the Health Insurance Portability and Accountability Act (HIPAA), and others. IBM also undergoes numerous internal and external audits, and each services team conducts ongoing self-assessments. You can learn more about IBM’s internal IT security principles at the IBM Trust Center . Data privacy IBM believes that consumers deserve strong privacy protections, consistent across jurisdictions, and that businesses should build trust by providing those protections. IBM also advocates for policymakers to focus on constancy and compatibility when crafting new regulations, to facilitate a consistent approach to handling personal information while enabling the free and secure flow of data across regions. Improving transparency and the user experience continued to be priorities for IBM in 2021, culminating in November with the publication of a new, simplified IBM Privacy Statement . The IBM Privacy Portal was also enhanced so that users can see the status of their data subject requests and manage their company’s information more easily. IBM published a case study in 2021 detailing how our three-year effort to prepare for implementation of the EU General Data Protection Regulation (GDPR) led IBM to develop our Unified Privacy Framework. By embedding governance and privacy controls directly into systems and business processes, this framework enables a more proactive approach to compliance governance and reduces the time and effort required to comply with new regulations—for IBM as well as our clients. Learn more about this “continuous compliance” approach at the IBM Policy Lab . All IBMers, contractors, and employees of IBM subsidiaries receive annual data privacy training. In 2021, we redesigned our annual data privacy education program and deployed a new adaptive learning platform that provides more targeted role-based education based on real-world examples. Cybersecurity IBM maintains a multifaceted risk-management approach to identify and address cybersecurity risks. This includes a foundation of policies and procedures upon which IBM manages its infrastructure and data, as well as ongoing assessments of technical controls and methods for identifying emerging risks. IBM’s security monitoring program and incident response process applies to all IBM operations worldwide, identifying and responding to any threats or attacks on networks, end-user devices, servers, applications, data, and cloud solutions in IBM’s operating environment. IBM also fosters security awareness and responsibility among its workforce with online training, educational tools, videos, and other initiatives. All IBMers and contractors take cybersecurity education within 30 days of joining IBM, and repeat this training annually. IBM’s Enterprise and Technology Security group works across the company to protect against cybersecurity risks. Within that group, IBM’s chief information security officer (CISO) leads a team responsible for information security strategy, policies, standards, architecture, and processes. IBM maintains extensive internal corporate directives requiring information security activities, including the creation and implementation of standards, processes and procedures. The IBM CISO reviews and approves these directives and other corporate policies annually, while the IBM Board of Directors and its Audit Committee also receive regular updates from IBM’s security management and other cybersecurity experts. Our enterprise IT security policy and related standards are based on industry best practices, including but not limited to the National Institute of Standards and Technology (NIST) and the International Organization for Standardization (ISO). To maintain leading-edge security, we have implemented a set of practices, called IBM Security and Privacy by Design , that all IBM business units use to assess threats, test protections, and verify that security requirements are met. IBM Data Security and Privacy Principles (DSP) details the contractual commitments of security and data protection IBM makes to its clients. IBM has modeled the DSP to be an industry-leading collection of security terms that take into account industry standards, IBM standard practices, and regulatory requirements to craft a comprehensive set of security and privacy commitments to all our clients. 17 IBM 2021 ESG Report
– IBM also continues to support programs and policies that can help people qualify for skilled jobs without a traditional bachelor’s degree. In the United States, for example, we advocate for expanded registered apprenticeship programs, education that is better aligned to industry skills needs, and a skills-first approach to hiring. We also believe the Higher Education Act should be modernized to increase flexibility and access to federal student aid programs. IBM is committed to meaningful management and oversight, and accurate reporting with respect to our public policy engagement, including with respect to trade associations. We receive consistently high ratings from independent analysts of corporate practices on lobbying and political spending, including the Center for Political Accountability and Transparency International UK. More information about our public policy governance and public reporting is available on our Philosophy and Governance webpage. Policy advocacy IBM’s public policy advocacy spans a range of issues relevant to our business and stakeholders. We engage leaders worldwide to promote ideas that can help spur growth and innovation with new technologies, or address societal challenges, such as building a skilled and diverse workforce. We do this by developing innovative policy ideas that are aligned with national agendas, through building trusted relationships with policymakers, and through partnerships with academia and civil society. IBM has never made political contributions nor endorsed candidates for office, and our company does not have a political action committee. Following are highlights of our policy advocacy in 2021. – IBM is advocating for a reinvigorated approach to science and innovation in the US and globally. Our “Science Forward” platform includes increased support for quantum computing technology and research, increased investment in semiconductor innovation, and creating a “Science Readiness Reserves” to mobilize in times of crisis. You can find more detail on these proposals in IBM CEO Arvind Krishna’s letter on the IBM Policy website. – In May 2021, the IBM Policy Lab published a set of policy recommendations on mitigating bias in artificial intelligence, where we called on governments to implement five policy priorities to strengthen adoption of testing, assessment, and mitigation strategies to minimize instances of bias in AI systems. In September, IBM responded to the EU proposal for a regulation on artificial intelligence, welcoming its approach to regulating specific uses of AI rather than the technology itself. We also published detailed views on how the regulation might be clarified to better target the new rules to areas of greatest risk. IBM also invests in advocacy around diversity and inclusion policy, which you can read about on page 21 . Additional details of our policy advocacy in 2021 can be found at the IBM Policy Lab and our THINKPolicy blog. 18 IBM 2021 ESG Report
Social 19 IBM 2021 ESG Report 19 IBM 2021 ESG Report

Accountability Accountability for our leaders encompasses achieving goals, owning actions, and communicating progress to our employees. Our commitment, outlined in IBM’s 2022 Proxy Statement , is to measure our executives globally in their annual incentive program with a modifier for diversity results. The diversity modifier is based on improvement in executive representation for women globally and US underrepresented minority (URM) groups (specifically, Black and Hispanic) executives in the US. Our goal remains to improve and close the gap in representation in these key areas. We set goals across our business segments globally and met the diversity modifier in 2021 with an improvement in the executive representation of women globally, and Black and Hispanic executives in the United States by 1.0 point, 1.5 points, and 0.4 points, respectively. Our three-year trend shows an increase year over year in women globally and most US minority group representation and hiring across four categories: overall representation, management, executive, and technical (see pages 27-28 for more detail). Further, we committed to disclose our US EEO-1 data in 2022; you will find the unofficial submission as of December 31, 2021, on page 28 . Equitable impact ↗ Diversity and inclusion Through our diversity, equity, and inclusion journey at IBM, our goal is to provide a culture of inclusion and belonging for all IBMers. The purpose is to establish trust among IBMers by creating a more diverse workforce, cultivating a flexible work environment, enabling an inclusive culture, and advocating for equity, both inside and outside IBM. We foster a culture of conscious inclusion and active allyship where every IBMer can make a positive impact on society while bringing their authentic selves to work. As we navigated through the second year of the pandemic in 2021, we focused on helping IBMers become better, stronger, adaptable, and more resilient. We created an environment to meet employees where they were, including their needs on flexibility, hybrid work schedule options, additional time off, and enhanced benefits through mental health support and Employee Assistance Program offerings. Our four strategic priorities include accountability, advocacy, allyship, and employee experience, which measure our progress through actions and outcomes. We believe that transparency, accountability, action, and progress garner trust. 20 IBM 2021 ESG Report
Advocacy Advocacy is about increasing opportunity through investments, partnership programs, external advocacy, and legislation. We donated $2 million to our partners advocating for diversity. Throughout the year, we supported several bills brought forth to the US Congress in support of our diverse communities of IBMers: – The Equality Act, to extend Civil Rights Act protections to the LGBTQ+ communities, February 2021 – The Dream Act, to provide protections and certainty for Deferred Action for Childhood Arrivals (DACA), or DREAMers, March 2021 – The George Floyd Justice in Policing Act, to address constitutional rights, March 2021 – Hate crime legislation passed in Arkansas, April 2021 – Asian American and Pacific Islander (AAPI) Hate Crimes Bill, passed in US Congress, May 2021 Emb(race) Emb(race),™ created in June 2020, is both a call to action and organizing principle that began with a pledge empowering IBM and IBMers to call for change to ensure racial equality. The commitment to sustained action with measurable outcomes, demonstrated through the tenets of Emb(race), continued to build momentum in 2021 with the development of four core pillars focused on representation and transparency, creating economic opportunity, leading in good technology, and social justice policy advocacy. This year, IBM will continue to push back against inequity and further drive the Emb(race) advocacy campaign. Emb(race) illustrates our collective stance and shared vision for continued advocacy, actions, and accountability toward mitigating implicit bias. – Surpassed $100 million given in kind to historically Black colleges and universities – Total diverse supplier spend in Americas exceeds $1 billion – Exceeded goal with more than 1,000 opportunities for P-TECH® students Call for Code for Racial Justice The Call for Code for Racial Justice developer challenge, launched in 2020, resulted in seven projects that are now available as open source solutions. Since its launch, the open source community has grown to more than 3,000 members who have been engaged in community events and contributed to the projects. Call for Code for Racial Justice also launched a premier partnership with YMCA of Metropolitan Los Angeles to deploy Five Fifths Voter—a solution for fighting voter suppression—as part of its civic engagement programming for its 500,000 constituents. It also received the Inclusion and Diversity Award at All Things Open for its work with Five Fifths Voter. Racial Equity in Design In 2021, IBM designers led several efforts to champion Racial Equity in Design , which focuses on ensuring diversity of thought and strengthening the pipeline in design careers for IBM and the industry at large. The IBM Design organization represents a diverse community of design practitioners and leaders who guide others through enterprise experiences. The team of designers collaborated to sponsor the State of Black Design Conference and a CBS syndicated TV show, America By Design , and also created the IBM Design Honorary Scholar program. We created a national conversation about racial equity in the design industry due to the lack of diverse talent in this career track. As a result, we doubled the number of Black designers at IBM, to nearly triple the industry average. HBCU commitment In 2020, we committed an investment of $100 million in assets, technology, and resources for historically Black colleges and universities (HBCUs)—integrating access to IBM Skills Academy, coursework, instructor training, and curriculum reviews. In addition to our Quantum Research Innovation Centers, we will partner with more than 20 HBCUs to establish cybersecurity leadership centers to build a more diverse US cyber workforce. OneTen Propelled by a powerful and common vision of mobilizing 1 million Black people into family-sustaining jobs in 10 years, OneTen welcomed 17,000 hires across its network of 60 companies and supported the promotion of 4,000 Black employees within the same organizations in 2021. IBM launched as the Raleigh-Durham market leader for OneTen in June 2021 and has since partnered with OneTen leadership to develop its talent development, transformation, and platform strategies. The IBM team designed and hosted monthly Skills First Working Group webinars and office hours, managing the security and development of the talent platform. The latter represents a $1.3 million gift to OneTen and our collective vision. 21 IBM 2021 ESG Report
Employee experience IBM’s purpose is underpinned by a corporate culture driven to achieve growth for our clients, our company, and ourselves. The employee experience at IBM is about empowering every IBMer to exemplify the behaviors that foster a culture of conscious inclusion where innovation can thrive and individuals progress. We are dedicated to promoting, advancing, and celebrating plurality of thought from all backgrounds. In 2021, we had over 40 events to embrace how we are different and to find areas where we share commonality. Recent external ratings also illustrate the impact of our focus on employee experience. For example, our Glassdoor employee rating increased to 4.1, and our Comparably rating for best company culture was 4.7 on a scale of 1–5—a 6-point increase from 2019, resulting in 81.4% of IBMers saying they would recommend IBM as a great place to work. In 2021, more than 68,000 people joined IBM, with significant capacity additions in consulting and key technical areas. Over 41% of hires were women globally, and in the United States, 15% were Black and 10.2% were Hispanic. Accelerating career growth resulted in 38% promotions for women, 8.1% for Black employees, and 8.2% for Hispanic employees. We deployed the IBM Accelerate program to build skills for high-potential undergraduate freshman and sophomore students, of which 2,000 participated. We also had more than 1,000 interns from P-TECH and university students across the US. IBMers completed 9.5 million technical learning hours, and we issued 82,000 cloud badges. “Your Career Guides,” which supports the career journey for IBMers, was launched in May 2021 to support a culture of mentoring and coaching within IBM. Over 13,000 IBM coaches and mentors supported a community of over 40,000 users in 2021, with continued growth occurring in 2022. We doubled the number of participants in our career accelerator programs to develop and retain diverse talent through leadership and career development. Top talent on an accelerated trajectory received coaches and sponsorship who are in the pipeline for leadership appointment. Allyship Allyship means creating a psychologically safe and supportive workplace where IBMers can be their authentic selves. It requires a culture that fosters a sense of inclusion and belonging for everyone. Allyship includes the intentional action of others so every voice is respected and heard. Current workforce and social trends point to significant societal challenges and experiences, like #MeToo, #PressForProgress, #BlackLivesMatter, #TimesUp, #NoBanNoWall, #StopAsianHate, #WontBeErased, and #SayHerName. We are experiencing a time of unprecedented need for allyship, which includes compassion, kindness, justice, dignity, unity, and empathy. Allyship at IBM is commitment to action. Fostering employee-centered allyship behaviors begins by co-creating learning experiences around topics not previously discussed in the workplace, such as systemic racism, implicit bias, being an upstander, and covering. We have established an allyship intranet site where IBMers can promote their commitment to allyship, practice allyship behaviors, volunteer to engage and mentor new allies, or share their stories about brave allyship. We proudly recognize IBM Be Equal® Allies, who embody intentional and positive everyday efforts to advance and benefit people different from themselves. And finally, because allyship is an evolution, the Be Equal allyship portal shares resources so IBMers can engage in conversations about current events, lead through crises, and practice inclusive language through our Inclusive Language Guide. In July 2021, we dedicated the month to our inclusive learning bundle. The course highlighted building an inclusive culture learning plan for all employees and learning specific to managers about diversity and inclusion concepts on identity, bias, race, and inclusive behaviors. A three-hour facilitated workshop for managers focuses on building action plans leaders can take to build more inclusive behaviors and teams. In 2022, trainings include new offerings for sponsorship and intersectionality, along with learning modules on inclusive behaviors. 22 IBM 2021 ESG Report
Women We grew representation of women globally by 3.7 points from 2020 to 2021, and hiring increased 2.3 points. We were impacted by attrition, due primarily to the ongoing challenges of the pandemic and other factors causing many women to leave their jobs in 2021 around the world. This year, our focus will be on retention programs and on careers and benefits to support women, parents, and their families. See more detail on our three-year trends on page 27 . IBM Women’s Executive Council represents IBM culturally across global markets and organizations. Its goal is enabling women to thrive through sponsorship, allyship, and well-being, which has been especially needed during the pandemic. Because paid-leave benefits are vital for IBMers who are parents and caregivers, IBM has helped establish a multi-industry coalition of companies and trade associations to promote paid family and medical leave policies at the federal US level. Senior IBM executives support these policies through discussions and advocacy before the US Congress and White House. IBM’s women’s community collaborates on issues including heart health, breast cancer awareness, exercise, and healthy eating. During the pandemic, the community worked to develop mental health resources, such as the Employee Assistance Program and special health programs. By inviting an external expert to speak on Menopause Awareness Day, we also took a bold global initiative to take the stigma away from menopause, especially as it relates to the workplace. LGBTQ+ In 2021, our LGBTQ+ community represented 9% of IBMers who had self-identified. This community is led by a council of executives and members of the community who drive change around a select few priorities that have been determined by the global LGBTQ+ community. In April 2021, the IBM Institute for Business Value (IBV) joined Out & Equal and Workplace Pride to host the first Global LGBT+ Innovation Jam, a 34-hour online dialogue that generated more than 2,800 comments. The event’s findings are included in Striving for Authenticity , a report released in June and co-authored by IBM and Out & Equal. The report also includes a survey of 6,000 US-based professionals, conducted by the IBV and Oxford Economics. The survey found that despite legal progress and efforts by employers, discrimination in the workplace remains a reality. The report includes recommendations for organizations to improve LGBTQ+ inclusion. Pay equity Paying people fairly based on their job and without discrimination—regardless of gender or race—is not optional. It is a mandate that aligns with our values. IBM has a longstanding practice of pay equity and is firmly committed to equal pay for equal work. It has been part of our global policy since 1935—preceding the US law by several decades. We have been conducting statistical pay equity analysis in the US since the 1970s. To support our commitment to pay equity, each year we follow a consistent methodology to identify and address any gender pay equity gaps. In the US, we also compare pay for minorities, and at the intersection of gender and race. In 2021, all countries where IBM has employees were included in the pay equity analysis. Sixty-four percent of the total salary investment for pay equity was to address gender pay gaps globally, and 36% of the investment was based on race and ethnicity in the US. Of the total investment made, whether for gender or race, 68% went to women and 32% to men. We are proud of the results: overall, IBM pays equitably for similar work. Women globally as well as in the US earn $1.00 for every $1.00 earned by men for similar work. The same is true for underrepresented minorities in the US. IBMer diverse communities IBM is committed to recruiting and developing employees from all backgrounds and fosters greater inclusion with our Business Resource Groups (BRGs), focused on specific IBMer communities. IBM also has a Senior Leader Council, co-chairs, and D&I Leadership Council leaders to support the objectives set in the annual strategy with the respective community. We have three global communities: women; people with diverse abilities (PwDA), including our neurodiverse community; and LGBTQ+. Additionally, we have four US racial/ethnic groups— Black, Hispanic, Pan-Asian, and Native American—as well as a group for our military veterans. In 2021, our Multi-race group represented 0.7% of our population. Our eight D&I communities support over 300 BRGs globally across 47 countries with over 32,000 IBMers actively participating in programs, events, and other D&I initiatives. We had 13 new BRGs established in countries including the US, Turkey, Argentina, Brazil, Mexico, and Poland. Following are highlights of how we bring our culture of inclusion to life across our eight communities and countries. 23 IBM 2021 ESG Report
Throughout the year, we referenced the IBM white paper Designing AI Applications to Treat People with Disabilities Fairly , published December 2020, as a tool to work with all our vendors to implement changes to make our tools more accessible. The D&I leadership organization is involved in working with our Real Estate Operations team to co-design our IBM workplaces. Our UK PwDA community was directly involved with ensuring a new IBM location was accessible for people with disabilities and neurodivergence. This included adding accessibility features such as automated doors, Braille and tactile signage, reflection rooms, and hearing induction loops, to ensure that all employees, clients, and visitors would be welcome and able to work at this location. Continuing our commitment to disabled talent and employees, IBM UK gained Disability Confident employer scheme status. In 2022, we plan to launch disability confidence and neurodiversity acceptance workshops, and increase the outreach, hiring, retention, and advancement of people with disabilities and neurodivergent individuals globally. We are also working to modernize and standardize IBM’s long-standing process for workplace accommodations in addition to the $600 per person allotted for home office support. Since launching our gender transition support framework and corresponding white paper in 2017, IBM has continued to evolve its support of transgender employees. Not all trans and nonbinary employees are able to change their legal name, so IBM updated its internal systems in 2021 to offer IBMers the option to use their chosen name as the default, unless there is a legal/business need for a legal name. Also in 2021, IBM introduced education about pronouns with the launch of laptop stickers and pin badges, plus an internal video featuring IBM’s senior leaders sharing their pronouns and stating why doing so is important. Our global Working Positively initiative, in partnership with SAP, was born out of our team in Germany to remove the stigma of HIV-positive employees and create awareness that this disease does not just impact the LGBTQ+ community but all communities. This initiative invites employers to commit to being visible role models in their support for HIV-positive employees. By creating a stigma-free environment, employers can cultivate a workplace that is safe, supportive, and inclusive. Additionally, it supports medical benefits and education to remove myths and the stigma in the workplace. IBM won the Cultural Vistas Award in 2021 for its work with the Working Positively campaign, signing up 10 countries. People with Diverse Abilities (PwDA) By the end of 2021, there were about 1% of IBMers who self-identified as being part of the PwDA community. From 2020 to 2021, we were able to increase our number of PwDA hires by nearly 220%. We are on track to increase our PwDA population in 2022. The global Neurodiversity@IBM program saw tremendous growth and recognition in 2021. IBM hired over 70 neurodivergent individuals as apprentices, P-TECH interns, and entry-level new employees in Australia, Brazil, Ireland, Japan, Mexico, the UK, and the US. Neurodiversity 101, our internal education course, was completed by more than 4,800 IBMers in 61 countries, exceeding its goal of 3,500. IBM also maintains private channels on the Slack messaging system for neurodivergent and autistic IBMers, providing safe spaces for support, to share experiences and resources, and to ensure their voices are heard. IBM celebrated International Day of Persons with Disabilities with numerous learning opportunities around the world, including a live accessibility training session. In 2021, over 800 IBMers earned the Accessibility Advocate digital badge. Our goal for 2022 is for 2,022 more IBMers to earn this badge. 24 IBM 2021 ESG Report
Veterans In 2021, our Veterans community represented 5% of IBMers who self-identified. Our veterans community has been represented by a council leader from each armed forces organization. IBM proactively recruits military veterans and participates in training programs, including IBM SkillsBuild,® that can help veterans transition to civilian careers. More information about these efforts in the US is available at Military and Veteran Talent Services on ibm.com. IBM’s Veterans Executive Council works to support veterans coming into IBM through four priorities: camaraderie, mentorship, leadership advancement, and recruitment. Our Veterans Mentorship Program allows IBMers to develop a path for greater social interaction and bridges connections with peers and executives. IBM also allows our employees to share their veteran status to identify and invite veterans into an ExecOnline development program, while camaraderie events promote community among former service members now at IBM. We deployed engagement programs, including a fireside chat with Admiral Michelle Howard, IBM Board of Director and Admiral of the United States Navy (Ret.), for Veteran’s Day with a focus on how veterans’ experiences offer exponential IBM leadership opportunities, the importance of mentorship to accelerate growth, and the value of teamwork. Additionally, we provided support and safe spaces conversations for our veterans after the US exit from Afghanistan. We have hosted many topics of interest, including a fireside chat with the International Space Station and astronaut Mark Vande Hei. We kicked off 2022 supporting a recruitment event with the Fort Gordon military base, home of the Cyber Center of Excellence, followed by sponsoring the Soldiers to Sidelines event. In 2022, we are exploring expanding our programs to include military spouses and hiring. Pan-Asian US Pan-Asian representation increased to 20.1% in 2021, while hiring was up 0.3 points. We experienced attrition due to the pandemic and other factors. Our focus is to continue to close the gap across all representation categories at the senior levels and focus on retention programs. Research from the IBM Institute for Business Value, published in 2021, found that the US work environment for some Asian American executives can be uncomfortably challenging and discriminatory. Asian American inclusion in the workplace presents insights from a survey of 1,455 executives, managers, and entrepreneurs, with nearly half of all respondents reporting discrimination in the workplace. The report presents detailed results from the study, focusing first on the Pan-Asian experience. 2021 was met with challenges such as discrimination, hate, and violence against the Pan-Asian community, instilling fear for safety across the community and for their families. Our IBMers rallied in support of our Asian community with a focus on listening, learning, and taking action. Internally, IBM hosted 12 Emb(race) Safe Spaces in 2021, inviting IBMers from the Pan-Asian community to discuss challenges they face, with over 2,700 IBMers participating and all our senior vice presidents attending at least one conversation. Pan-Asian community members and allies also focused on educating fellow IBMers about the experience of our Asian community. Education included an internal video series focused on personal stories of discrimination and violence, and another on Asian and Pacific Islanders’ contributions to society. Additionally, we executed three key programs, concentrating on executive mentorship, career development, and career coaching sessions for entry- and midlevel professionals. US Underrepresented Minorities (URM) Our URM community represents people of color who self-identify in the US race categories of Black, Hispanic, Native American, Native Hawaiian and Other Pacific Islanders (NHOPI), or Multi-race. URM representation increased 1.2 points in 2021. Attrition was flat in 2021 after experiencing the highest attrition rate in 2020, significantly tied to the pandemic. In the US, representation for IBMers who identify as Multi-race was 0.7%. Our focus will include continuing the momentum with our culture of inclusion and representation at all levels, retention, and career programs. See more detail on our three-year trends on page 27 . 25 IBM 2021 ESG Report
Hispanic US Hispanic representation increased to 6.8%, and 10.2% among new hires in 2021. Attrition remained flat overall; however, in our management, technical, and executive roles, our attrition declined. Our focus is to continue to close the gap across all representation categories and focus on acceleration and retention programs. See more detail on our three-year trends on page 27 . In June 2021, IBM reinforced its commitment to the American Dream and Promise Act and maintains its position that the US Congress should pass a permanent, bipartisan legislative solution that will provide a path to citizenship for work-authorized employees under the Deferred Action for Childhood Arrivals (DACA) policy. We focused on hiring through programs such as P-TECH, apprenticeships, and IBM Accelerate to attract talent across all careers, including in STEM fields. We focused on career accelerator programs for Hispanic women leaders, STAR technical development pipeline program, executive sponsorship, mentoring matters, and partner leadership development programs. In 2022, our focus is hiring, retention programs and developing talent representation at all levels. Black US Black representation rose to 7.7% in 2021 and 15% among new hires. Our goal is to continue to close the gap across all representation categories to better reflect the communities in which IBMers live and work, with a focus on retention programs. See more detail on our three-year trends on page 27 . IBM’s Emb(race) initiative, launched in 2020, continued through 2021 and is focused on four pillars: representation/transparency, economic opportunity, technology, and policy advocacy. Internally, we launched several career development programs in support of Black IBMers, which offer avenues to build leadership skills, secure high-level mentors, and participate in external training and development opportunities. Throughout 2021, we hosted programming that addressed cultural awareness, education, mental wellness, and professional development. Externally, we exceeded our previously announced $100 million in-kind giving to HBCUs with additional equipment, software, and other resources amounting to $6 million. Also in 2021, the IBM Institute for Business Value published several reports: Black leaders in business , Nurturing Black women leaders , and Investing in Black technical talent . In 2022, our focus is hiring, retention programs, and developing talent representation at all levels. 26 IBM 2021 ESG Report
Science and Engineering Society and the Society for Advancement of Chicanos/Hispanics and Native Americans in Science—to build relationships with tribal colleges throughout the United States. The council also works with IBM SkillsBuild (previously known as Open P-TECH®) and similar organizations to increase awareness in indigenous communities of STEM careers and to support the growth of talent from these communities throughout IBM. In 2022, our focus is signature hiring events with job flexibility on location and retention programs. Native American US Native American representation showed positive trends in hiring in 2021; however, attrition impacted gains made in hiring and promotion. Our focus is to continue to close the gap across all representation categories with focus on hiring initiatives with our community partners and retention programs (e.g., sponsorship, mentoring and career development). See more detail on our three-year trends on page 28 . IBM’s Native American and Indigenous Executive Council and community works to increase Native American representation within IBM by engaging with partners—the American Indian 2019 2020 2021 2019 2020 2021 Women (global) Representation New hires Overall 33.3% 33.9% 37.6% Overall 39.1% 38.3% 40.6% Management 28.5% 29.0% 31.7% Management 29.7% 30.9% 34.0% Technical 26.6% 28.1% 31.3% Technical 28.8% 30.7% 34.8% Executive 27.6% 28.3% 29.3% Executive 33.5% 29.9% 32.8% Data includes active regular employees. Underrepresented Minorities (US) Representation New hires Overall 13.3% 13.7% 14.9% Overall 20.7% 21.3% 25.8% Management 10.3% 11.0% 11.5% Management 11.0% 14.0% 18.4% Technical 12.4% 12.9% 14.3% Technical 19.2% 21.3% 23.1% Executive 10.4% 11.6% 13.4% Executive 11.4% 13.9% 20.5% Underrepresented minorities include people who are Black, Hispanic, Native American, and Native Hawaiian and other Pacific Islanders (NHOPI). Black (US) Representation New hires Overall 6.8% 6.9% 7.7% Overall 11.2% 11.3% 15.0% Management 4.9% 5.4% 5.9% Management 4.5% 8.3% 9.4% Technical 5.9% 6.0% 6.9% Technical 10.1% 11.1% 12.9% Executive 4.8% 5.4% 6.9% Executive 4.8% 8.0% 11.9% Hispanic (US) Representation New hires Overall 6.0% 6.3% 6.8% Overall 8.8% 9.4% 10.2% Management 5.0% 5.2% 5.3% Management 5.0% 5.7% 8.3% Technical 6.1% 6.4% 6.9% Technical 8.3% 9.7% 9.6% Executive 5.2% 5.7% 6.1% Executive 4.8% 5.8% 8.1% 2021 results are as of December 31, 2021. All data (except for women, as noted above) includes active regular and nonregular (supplemental) employees. “Overall” includes all members of the specific community. “Management” includes all executives and people managers. “Technical” includes Distinguished Engineers, Designers, IBM Fellows, etc. “Executive” includes Director level and above. Representation and hiring trends 27 IBM 2021 ESG Report
2019 2020 2021 2019 2020 2021 Native American (US) Representation New hires Overall 0.3% 0.3% 0.3% Overall 0.4% 0.3% 0.4% Management 0.3% 0.2% 0.3% Management 1.0% 0.0% 0.4% Technical 0.3% 0.3% 0.2% Technical 0.4% 0.2% 0.3% Executive 0.3% 0.3% 0.3% Executive 1.0% 0.0% 0.0% Pan-Asian (US) Representation New hires Overall 18.3% 18.9% 20.1% Overall 23.6% 24.9% 25.2% Management 15.8% 16.4% 18.2% Management 18.5% 20.2% 20.3% Technical 24.4% 25.6% 26.1% Technical 31.1% 32.0% 33.9% Executive 15.0% 15.5% 17.3% Executive 31.1% 21.2% 18.4% Multi-race (US) Representation New hires Overall 0.8% 0.7% 0.7% Overall 0.2% 0.1% 0.1% Management 0.8% 0.8% 0.7% Management 0.0% 0.0% 0.0% Technical 0.9% 0.8% 0.7% Technical 0.3% 0.0% 0.0% Executive 0.7% 0.7% 0.6% Executive 31.1% 0.0% 0.0% 2021 results are as of December 31, 2021. All data (except for women, as noted above) includes active regular and nonregular (supplemental) employees. “Overall” includes all members of the specific community. “Management” includes all executives and people managers. “Technical” includes Distinguished Engineers, Designers, IBM Fellows, etc. “Executive” includes Director level and above. Representation and hiring trends continued Female Male Total Native American Black Pacific Islander White Asian Hispanic Multiple Native American Black Pacific Islander White Asian Hispanic Multiple Executive/senior officials and managers 4 68 547 110 48 7 4 92 2 1,101 298 96 7 2,384 First/midlevel officials and managers 10 227 2 1,742 386 121 27 10 208 6 3,382 999 258 37 7,415 Professionals 34 1,195 23 6,020 2,601 828 98 50 1,359 40 13,557 5,014 1,504 132 32,455 Technicians 4 183 1 797 286 115 12 12 340 13 2,187 465 351 28 4,794 Sales workers 11 201 5 1,073 227 129 9 21 306 7 3,207 615 299 23 6,133 Administrative support workers 1 59 56 15 21 1 28 1 107 27 35 1 352 Craft workers 5 20 6 1 7 1 37 1 6 84 Operatives 3 8 11 Totals 64 1,938 31 10,258 3,631 1,263 154 97 2,340 70 23,586 7,419 2,549 228 53,628 Data includes all US employees on IBM’s payroll, including active full-time, part-time, casual, temporary (if on the company payroll), co-ops/interns, and people on short-term disability. Not included are employees who are inactive, terminated or on severance, retired (but still on the payroll for benefits or payouts), expatriates, contractors, inpatriates on foreign payrolls, or people on long-term disability. EEO-1 snapshot The data below is from IBM’s unofficial submission of US EEO-1 data as of December 31, 2021. Some data differs slightly from the representation and hiring trends tables shown above, due to EEO-1 reporting criteria. 28 IBM 2021 ESG Report
IBMers’ skills and leadership development IBM invests in its employees’ professional development with a range of advanced tools and resources that empower IBMers to direct their own career paths and build the skills required to pursue their goals. Our focus in 2021 was promoting wider awareness and use of our online resources among IBMers. Your Career and Learning is our digital platform that uses Watson AI technology to generate personalized recommendations and direct employees to learning resources. Your Learning Boost is an app that enables IBMers to collaborate and share their learning goals and achievements. Your Career at IBM is designed to help IBMers assess their current skills, identify ones they need for new roles, and find career opportunities within IBM. It connects IBMers to certification programs, as well as coaching and mentoring to supplement their development. Leadership development We seek to empower every IBMer to understand and demonstrate the behaviors that bring our culture to life. As part of this work, we launched the IBM Growth Behaviors: Growth Minded, Trusted, Team Focused, Courageous, Resourceful, and Outcome Focused. These six behaviors reflect the mindset and habits IBMers need to drive new ideas, collaboration, inclusion, and speed to unleash IBM’s full potential and accelerate growth. They represent who we are today as a company, as well as guide us on where we should all focus to continuously evolve. IBM leaders were activated through digital enablement and workshops, while senior leaders were activated through key activities within the Acceleration Team. Most notably, the growth behaviors were embedded across strategic HR portfolios so that they represent what we look for when we hire, how we recognize and reward teams, and how we measure engagement and performance, as well as how we assess, select, and develop leaders. During 2021: – The IBM Growth Behaviors site, launched in Q1 with digital enablement learning and resources, was visited by over 32,000 IBMers, followed in Q2 by the IBM Growth Leadership Workshop, completed by more than 9,700 leaders over 454 sessions. Our entire Leadership Development portfolio was updated to align with the growth behaviors, including a new “Candid Feedback” workshop and digital enablement. – The Acceleration Team received presentations by external thought leaders, team activations sessions, workshops, and a Culture Cue weekly series. Professional coaches aligned the growth behaviors. – Our leadership assessments across all leadership levels were updated with Growth Behaviors 360 and Growth Assessment for Motivation and Preferences, replacing a variety of existing assessments to drive coherence and behavior change at scale. Apprenticeships and returnships The IBM Apprenticeship Program provides an entry point into IBM for people with relevant skills but without advanced degrees—what we call “new collar” talent. Our registered, competency-based program enables apprentices to be paid while they learn skills for various strategic roles. Launched in 2017, the program began with software engineering and has expanded to more than 20 occupations, including data science, cybersecurity, and design. We expect to surpass 1,000 apprenticeship hires by year-end 2022, and more than 90% of past program graduates have become full-time IBMers. The IBM Tech Re-Entry Program seeks people looking to rejoin the workforce after a career break. This paid “returnship” provides a path back to full-time employment and helps individuals modernize their skills with learning, plus mentorship from IBM experts. Available in nine countries, this initiative is also providing opportunities to people whose careers were disrupted by the COVID-19 pandemic. 2019 2020 2021 Employee learning Per capita investment ($) 1,321 940 1,124 Total hours worldwide (M) 29.0 32.5 22.5 Hours per employee 77.0 88.0 84 Investments worldwide ($M) 452 308 298 Unless expressly noted otherwise, 2021 results in tables throughout this report include Kyndryl until November 2021. 29 IBM 2021 ESG Report
We believe apprenticeship and returnship models can help close the opportunity gap as well as narrow the skills gap in IT. To promote this approach, IBM has committed to investing $250 million in apprenticeship and new collar programs by 2025. We also joined the Consumer Technology Association to create the CTA Apprenticeship Coalition , whose mission is helping companies launch apprenticeship programs to create a corps of skilled workers for new collar jobs in the United States. In 2021, we became founding members of the OneTen Coalition and the New York Jobs CEO Council , as well as a chair of the Business Roundtable’s Multiple Pathways Initiative . These efforts work to improve opportunities by scaling new collar programs and encouraging more companies to adopt skills-first talent strategies. Health and safety at IBM The health, safety, and well-being of our employees remains a top priority, and in 2021 we continued using science and evidence to protect IBMers, clients, and contractors against COVID-19. We have a robust case management system to manage COVID-19 exposures, and a comprehensive playbook on workplace health and safety measures that allows our offices to reopen and adjust capacity levels based on local clinical conditions. These health and safety measures are constantly adjusted based on the evolving pandemic situation and government requirements. They include limiting travel and in-person meetings and events, requiring self-screening before accessing workplaces, and imposing strict social distancing and mask wearing, among others. During the COVID-19 crisis, we anticipated that IBMers would be impacted. In India, IBM provided employees with enhanced insurance coverage, a telephonic helpline to access information and medical consultation, oxygen concentrators for employees and their family members in need, COVID-19 care centers for mild cases in partnership with hotels and hospital chains, grief counseling support, and COVID-19 vaccination camps for IBMers and their families. Employees’ mental health has always been an IBM priority, even before the pandemic imposed new levels of stress. All IBMers worldwide have confidential, 24/7 access to critical mental health support through employee assistance programs and other mental health resources. On World Mental Health Day, we launched the Mental Health Ally Badge program, an online training designed to help employees become an ally by learning basic information about mental health, how to address stigma, and how to connect someone who asks for support with an appropriate service or resource. Established in 1999 and underpinned by IBM’s policy and standards on health and safety, as well as compliance with country legal requirements, IBM’s Health and Safety Management System provides a framework to manage evolving health and safety risks. This system allows IBM to identify, assess, and address health and safety risks IBMers face in their day-to-day work activities, including emerging risks such as the current pandemic. IBM’s HSMS has obtained corporate certification to the ISO 45001:2018 occupational health and safety standard, covering IBM operations globally. Worker-related injuries 2021 Number of fatalities 0 Rate of fatalities 0 Number of high-consequence work-related injuries ‖ 5 Rate of high-consequence work-related injuries † 0.0082 Number of recordable work-related injuries ‡,§ 38 Rate of recordable work-related injuries † 0.0625 Number of hours worked 607,952,000 Main types of work-related injury Slips, trips, and falls, automobile and struck by These results include Kyndryl until September 2021. † One million hours worked is used for rate calculations. ‡ ASTM E2920-19 Standard Guide for Recording Occupational Injuries and Illnesses is used for reporting work-related injuries and illnesses. § Level one injuries and illnesses as defined by ASTM E2920-19 are reported as recordable. ‖ High-consequence work-related injuries are reported in accordance with GRI 403-9. Work-related ill health 2021 Number of fatalities as a result of work-related ill health 0 Number of cases of recordable work-related ill health ‡ 22 Main types of work-related ill health Hearing loss and musculoskeletal 30 IBM 2021 ESG Report
Community development Skills IBM made a groundbreaking commitment and released a global plan in October 2021 to provide 30 million people of all ages with new skills needed for the jobs of tomorrow by 2030. This ambitious initiative kicked off with more than 170 new academic and industry partnerships, utilizing IBM’s existing programs and career-building platforms to expand access to education and in-demand technical roles. Partnerships extend to NGOs as well, particularly those focused on underrepresented and historically disadvantaged communities. IBM’s combined education initiatives reached 3.5 million participants in 2021 via IBM SkillsBuild, STEM for Girls, our Global University Programs, P-TECH, free courses offered on edX and Coursera, Cognitive.ai, IBM training, and other initiatives. IBM SkillsBuild IBM SkillsBuild is a free, digital training program that helps students and adults develop skills, explore career options, and connect to potential job opportunities, regardless of their background or education. As of 2022, IBM SkillsBuild operates in 159 countries, offering over 1,000 courses in 19 languages in technical disciplines such as cybersecurity, AI, quantum computing, or data analysis, as well as workplace skills. Participants can earn IBM-branded digital credentials to certify their relevant skills, and a global network of 90 nonprofit partners helps connect learners with local job opportunities. Most learners start with no experience and can be ready to apply for IT jobs within six months through project-based learning and mentoring support. As of February 2022, 1.72 million students and job seekers worldwide have joined IBM SkillsBuild and completed nearly 4 million learning hours. Teachers also access additional resources to help lead hands-on projects and classroom discussions, as well as an educator dashboard to track students’ progress. STEM for Girls STEM for Girls is an initiative launched in India to improve education and career pathways for girls in schools. To date, the program has impacted 200,000 girls. Girls receive digital literacy, coding, and technology skills, and career development support through mentors. We have established baseline measures and have some early positive indicators, such as increased excitement about STEM and increased confidence for participants. The program has recently been expanded to Taiwan and Italy. University programs IBM Global University Programs builds a synergistic relationship between academia and industry. IBM is providing technology, supporting research, and creating assets to advance relevant skills for today’s workforce. To date, we have more than 900,000 participating students across 10,000 universities, offering over 334 specialized academic courses. – The IBM Academic Initiative provides students and faculty at accredited institutions with self-service access to select IBM resources at no charge for classroom and noncommercial research purposes. Participants completed over 67,000 learning hours in 2021. – The IBM Skills Academy offers online “train the trainer” sessions to faculty members, to help empower college and university students with high-demand technology skills. In 2021, 87,000 participants completed 6.5 million learning hours. – IBM University Awards supports basic research, curriculum innovation, and educational assistance through monetary and in-kind awards in areas fundamental to innovation and strategic imperatives to IBM. We distributed 99 awards in 2021, valued at $11 million. – The IBM University Guest Lectures program provides IBM Academic Ambassadors (technical subject matter experts) to speak on topics in their expertise in university settings. These free lectures are available in the classroom, virtually and on demand. Our experts provided over 66,000 hours of guest lectures in 2021. IBM also continues to invest in the IBM-HBCU Quantum Center education and research initiative with historically Black colleges and universities. Since its launch in 2020, the initiative has grown to include 23 HBCUs across the United States, with more than 500 participating faculty, researchers, and students. In 2021, IBM also announced it will partner with more than 20 HBCUs to establish Cybersecurity Leadership Centers to build a more diverse US cyber workforce. 31 IBM 2021 ESG Report
P-TECH P-TECH is a global education and career readiness model that combines public high school and no-cost community college, along with mentoring and paid workplace experiences from industry partners, equipping graduates to start a new collar career, continue their education, or both. Since its 2011 launch, the program has grown to include over 300 schools with more than 600 industry partners, and has provided over 1,000 paid IBM internships in the United States. Tech for social impact IBM Sustainability Accelerator The IBM Sustainability Accelerator is IBM’s new flagship social impact program for the environment. Launched in February 2022, it provides pro bono delivery of IBM technologies and an ecosystem of experts to enhance and scale nonprofit and governmental interventions. Our goal is to help populations that are especially vulnerable to environmental threats including climate change, extreme weather, and pollution. IBM has invited organizations worldwide to submit proposals for projects that would benefit from IBM’s expertise and support, and we plan to engage with approximately five of such organizations each year. As part of a pilot launch in 2021, IBM supported projects from three organizations, all focused on sustainable agriculture. One is a collaboration with Heifer International to develop scalable, affordable digital solutions designed to equip farmers’ cooperatives in Malawi with weather and crop yield forecasts, to help increase their yields and incomes. Another project, with The Nature Conservancy India, is building a public information platform to help eliminate crop residue burning in North India, while the third is a collaboration with the Plan21 Foundation for Sustainable Human Development, to help smallholder farmers in Latin America manage crops more sustainably. For 2022, the RFP focus is “clean energy,” and through April 2022 IBM is seeking proposals from nonprofit and governmental organizations for tech-driven initiatives that advance the equity, science, and/or scholarship associated with clean energy usage and/or transition. 2019 2020 2021 Total contributions worldwide ($M) 728.9 394.9 † 470.6 Contributions by type ($M) Technology 629.8 317.1 387.8 Services 62.0 36.8 42.1 Cash 37.1 41.0 40.7 Contributions by issue ($M) Education 708.1 367.8 456.8 Human Services 8.2 13.7 3.9 Environment 1.8 4.3 3.9 Health 5.3 3.7 3.5 Culture 3.3 2.0 0.5 Other 2.2 3.4 2.0 Contributions by region ($M) Europe, Middle East, Africa 279.3 129.1 167.6 Asia Pacific 160.0 69.6 150.2 North America 235.3 168.3 106.4 Latin America 54.3 27.9 46.4 † Reflects year-to-year decrease due to COVID-19 pandemic of approximately $334 million in IBM Academic Initiative software contributions reported in Education and Technology, and across all regions. IBM giving worldwide IBM has a comprehensive giving strategy that allows us to provide the breadth of our services, technology, and cash giving to support our Corporate Social Responsibility mission and priorities in education and skills, sustainability, social justice, and others. Our giving strategy is global and focuses on areas where IBM seeks to make a significant impact on those with the greatest need for the support we provide. 32 IBM 2021 ESG Report
Call for Code Call for Code is the largest tech-for-good initiative of its kind, with over 500,000 developers from 180 nations creating open source solutions since 2018 to address natural disasters, racial justice, COVID-19, and more. The 2021 challenge sought solutions that combat climate change in three focus areas: clean water and sanitation, zero hunger, and responsible production and green consumption. The top prize went to Saaf water , an accessible water quality sensor and analytics platform for people living in rural localities. Leveraging IBM’s Service Corps, we will work with Saaf water to incubate, test, and deploy their solution in communities relying on groundwater for domestic use. AI incubator In 2021, IBM conducted an AI incubator to help social impact organizations explore and use high-impact data science and AI projects to advance their missions. IBM AI for Social Good invited proposals and selected four organizations with three projects to work with IBM AI experts, while leveraging the power of the IBM Cloud Pak® for Data as a Service platform. The goal was to support organizations with an identified gap or aspiration in data and AI, and help them enhance their long-term impact in the communities they serve. The three projects included an effort to analyze social disparities in the criminal justice system of the state of Alabama using AI and data science tools, a project to analyze the relationship between low-wage workers’ financial characteristics and their probability of experiencing financial distress, and a third to help an organization that distributes diapers and other hygiene products to low-income families create a more comprehensive understanding of its clients’ needs. Science for Social Good IBM Research® continued its long-standing Science for Social Good program to conduct joint research with social change organizations, and develop algorithmic solutions for problems relevant to their missions. In 2021, the goal was to work with organizations from different areas of the social sector and devise a common, reusable solution framework to address their needs. The team developed a novel restless multi-armed bandit algorithm to support the decision making of Breaking Ground in homeless outreach, Change Machine in financial coaching for socioeconomically disadvantaged people, and Leket in gleaning unharvested food. Learn more at IBM Research . IBM Volunteers IBM Volunteers® leverages the collective power of people and resources to ensure meaningful impact worldwide. The program supports active and retired IBMers who donate their time and talents to academia, grassroots initiatives, and organizations helping to build our communities—and their efforts can qualify for IBM grants to the eligible organizations they support. Volunteers can use activity kits that equip them to introduce technologies such as coding and cybersecurity, or deliver engaging projects focused on recycling, AI, and more. IBM Volunteers has more than 89,000 registered users who recorded over 860,000 volunteer hours in 2021. IBM has established a goal of registering 4 million volunteer hours by 2025. IBM Service Corps gives IBMers the opportunity to use their professional skills to help communities tackle complex challenges in education, humanitarian efforts, cybersecurity, and economic development. Since 2008, IBM Service Corps has engaged over 4,000 employees in teams to undertake 456 projects in 54 countries. 2019 2020 2021 Volunteering Worldwide retiree/employee hours 1.25M 2.02M 860K † † Impacted by remote working due to COVID-19, and partly by the Kyndryl spinoff. 500K Since 2018, over 500,000 Call for Code developers have created open source solutions to global humanitarian challenges. 33 IBM 2021 ESG Report
Supply chain IBM spent $22.2 billion in 2021 with 13,000 suppliers, as we continued to promote a commitment to social responsibility among our global supply chain and throughout our industry. IBM is a founding member of the Responsible Business Alliance (RBA), a nonprofit industry group that helps its members support continuous improvement in the social, environmental, and ethical responsibility of their supply chains. We require our first-tier suppliers of hardware, software, and services (and IBM’s own operations) to adhere to the RBA Code of Conduct, which contains provisions on labor, health and safety, environmental requirements, ethics, and management systems. New suppliers must demonstrate having management systems for social and environmental responsibilities within a year of starting to do business with IBM. Suppliers must establish goals, disclose results, cascade IBM’s requirements to their next-tier suppliers, and more. In 2022, IBM committed to engaging 100% of our suppliers on sound practices including social and environmental responsibility, ethics, and risk planning. See the IBM Supply Chain Responsibility website for more detail. To help suppliers meet our requirements, IBM provides and facilitates education that includes online access to the RBA learning academy for many suppliers, as well as materials IBM developed to augment the RBA courses. IBM continuously updates these programs to address areas where assessments reveal improvement in the supply chain is needed. We also encourage suppliers to publish reports on their responsibility programs and results—63 of our top 100 suppliers did so in 2021, and 52% of those followed Global Reporting Initiative guidelines (as does IBM). Going forward, IBM will place renewed focus on having its top suppliers publish their ESG reports as part of driving greater supply chain transparency and best practice sharing. IBM’s top suppliers are listed on page 51 , with links to their ESG reports if available. IBM collaborates with a range of external organizations to promote social responsibility, and encourages our suppliers to participate as well. We contribute to advancing RBA’s code of conduct, which in 2021 began requiring expanded public reporting on environmental impact and minerals sourcing. We also collaborate with organizations such as the Mexican NGO Centro de Reflexión y Acción Laboral, which works to address mutual concerns regarding working conditions in the supply chain in Mexico. 2019 2020 2021 Supplier spending by category ($B) Services and general procurement 20.8 20.3 18.8 Production procurement 3.7 3.3 2.9 Logistics procurement 0.6 0.6 0.5 Total ($B) 25.1 24.2 22.2 Supplier spending by region ($B) North America 11.3 10.9 10.2 Asia Pacific 7.0 5.1 5.0 Europe, Middle East, Africa 5.6 5.5 4.9 Latin America 1.2 2.7 2.1 Total ($B) 25.1 24.2 22.2 First-tier supplier spending Total US ($B) 10.1 9.5 8.5 Diverse US ($B) 1.4 1.5 1.4 Diverse non-US ($M) 621 570 584.3 2021 diverse spending (US and non-US) results include Red Hat. 34 IBM 2021 ESG Report
Supplier audits Each year, a cross-section of IBM’s global suppliers is requested to participate in RBA-validated audits to gauge their degree of conformance to the RBA code and to IBM’s requirements. If an audit reveals nonconformance, IBM works with suppliers to review their corrective action plans and suggests recommendations to reach code conformance. IBM follows the RBA assessment process and requires reaudits for these suppliers to measure their progress toward full conformance. In 2021, IBM suppliers participated in 68 RBA full-scope audits and 25 reaudits in 19 countries where heightened risks for social responsibility are known to exist. The 68 full audits revealed 661 nonconformances against the five provisional sections of the RBA Code—the 10 most frequent nonconformances are shown in the graph on the following page. 2021 full audits and reaudits by country Full audit Reaudit Total China 17 13 30 India 10 0 10 Mexico 6 2 8 Korea 4 2 6 Taiwan 5 1 6 Thailand 5 1 6 Brazil 2 1 3 Chile 3 0 3 Hungary 3 0 3 Philippines 2 1 3 Singapore 2 1 3 Japan 1 1 2 Portugal 2 0 2 Romania 2 0 2 United Arab Emirates 1 1 2 Malaysia 0 1 1 Saudi Arabia 1 0 1 Turkey 1 0 1 Vietnam 1 0 1 Totals 68 25 93 These results include Kyndryl for the full year. In 2021, IBM collaborated with 25 suppliers to plan and execute RBA reaudits to vet corrective action plans associated with full audits performed during 2019–21. These reaudits found an 80% improvement against the nonconformances from the full audits. In this same group, 60% of suppliers had attained full compliance to the RBA Code after one cycle of audit, correction action, and reaudit. We remain engaged with suppliers that show residual nonconformance and require a second corrective action plan to be developed for further assessment. As part of our RBA Code conformance management system, IBM reviews full and reaudit results monthly with IBM’s procurement teams and vice presidents, and IBM’s chief procurement officer reviews them quarterly. From this dialogue, IBM makes alterations to its supplier education programs, assistance, and future sourcing patterns. 35 IBM 2021 ESG Report
2021, improved nonconformance rates from reaudits Full audits Reaudits 2021 distribution of nonconformances by section of the RBA code of conduct (68 full audits) 0.0% 5.0% 10.0% 15.0% 20.0% 25.0% E w Supplier responsibility (Mgt) Management accountability and responsibility (Mgt) Food, sanitation, and housing (H&S) Legal and customer requirements (Mgt) Audits and assessments (Mgt) Occupational safety (H&S) Freely chosen employment (Lab) Emergency preparedness (H&S) Wages and benefits (Lab) Working hours (Lab) 21.1 8.5 10.6 2.8 9.9 1.4 7.1 0.0 0.0 6.0 0.0 4.2 0.0 4.2 3.5 0.7 3.5 0.7 2.8 2.1 Environmental 6% Health and Safety 28% Labor 32% Ethics 7% Management Systems 27% These results include Kyndryl for the full year. These results include Kyndryl for the full year. 2021, top 10 nonconformances from 68 full audits (661 total nonconformances) Priority and major nonconformance Minor nonconformance Risk assessment and risk management Nondiscrimination Audits and assessments Occupational injury and illness Management acccountablity and responsibility Wages and benefits Freely chosen employment Occupational safety Emergency preparedness Working hours 8.9% 3.3% 12.2% 6.4% 0.9% 7.3% 4.2% 2.1% 6.3% 4.2% 1.1% 5.3% 3.3% 1.1% 4.4% 10.4% 12.5% 2.1% 3.9% 0.5% 4.4% 3.5% 0.2% 3.6% 3.0% 0.5% 3.5% 2.6% 0.1% 2.7% 0.0% 3.0% 6.0% 9.0% 12.0% 15.0% These results include Kyndryl for the full year. 36 IBM 2021 ESG Report
Supplier diversity IBM’s supplier diversity program operates in all countries where we do business, and diverse suppliers provide products and services in every IBM procurement category. In 2021, IBM spent $1.9 billion with first-tier diverse suppliers worldwide, including $1.4 billion in the United States (both totals include Red Hat and 10 months of Kyndryl data). IBM has committed to dedicating 15% of our first-tier diversity supplier spending to Black-owned businesses by 2025. IBM requires our first-tier suppliers to report their own diverse- supplier expenditures that are utilized in support of IBM contracts, and including this second-tier spending increases our 2021 aggregate total (first and second tiers) to $2.4 billion. Likewise, IBM submits quarterly reports on diversity spending to approximately 300 clients. Our program includes suppliers that are majority owned, operated and controlled by people from a racial or ethnic minority (as defined in each applicable country or region), women, military veterans, LGBTQ+ individuals, or people with disabilities. Opportunities are also expanded for nonprofit organizations that hire disabled persons, and for US HUBZone companies. You can learn more about our program at the IBM Global Procurement website. Responsible minerals sourcing Since the passage of Section 1502 of the Dodd-Frank Financial Reform Act of 2010, IBM’s focus has been to ensure that 3TG minerals (tantalum, tin, tungsten, and gold) used in our products do not contribute directly or indirectly to armed groups in the Democratic Republic of the Congo and adjoining countries. We deploy a multifaceted approach that includes robust policies and practices, as well as external collaboration, to reach these objectives. At year-end 2021, IBM’s in-scope suppliers reported using 266 smelters or refiners (SORs)—achieving 100% usage of conformant, active, or recycled 3TG SORs for the third consecutive year. IBM’s responsible minerals sourcing policy is aligned with the framework of the Organisation for Economic Co-Operation and Development (OECD) Due Diligence Guidance for Responsible Supply Chains of Minerals from Conflict-Affected and High-Risk Areas (CAHRAs), including Annex II and the related supplements pertaining to downstream companies. IBM has expanded its efforts to include ethically sourced cobalt, following the approach we built with our suppliers on 3TG. IBM is an active member of the Responsible Minerals Initiative, and engages directly with our in-scope suppliers to collaborate and build capacity, to assure lasting progress. We require in-scope suppliers to source 3TG minerals from ethical SORs that are conformant or active in a recognized third-party validation scheme, or from 100% recycled scrap sources. IBM pairs skilled members of our responsible minerals team with suppliers to work on training, best practice sharing, and overcoming the challenges of a dynamic market environment where SOR status changes occur and must be adapted to. Our working relationships span multiple layers of the supply chain, in which many interrelationships exist, in order to sustain progress. Additionally, the IBM Almaden Research Center has invented a battery technology free of nickel and cobalt, which could potentially help eliminate the need for heavy metals in battery production, and transform the long-term sustainability of many elements of our energy infrastructure. You can learn more about our Responsible Minerals policy and due diligence process, or download our annual Conflict Minerals Reports and our white paper “IBM’s journey in Responsible Minerals Sourcing,” at IBM’s Responsible Minerals website. 2013–2021 3TG smelter or refiner validation 0 50 100 150 200 250 300 350 0 50 100 150 200 250 300 350 2016 2017 2018 2013 2014 2015 2019 2020 2021 Conformant SORs Nonconformant SORs 37 IBM 2021 ESG Report
Environment 38 IBM 2021 ESG Report 38 IBM 2021 ESG Report
Stakeholder engagement and voluntary collaborations We proactively engage and collaborate with stakeholders from a cross-section of nongovernmental organizations (NGOs), government agencies, businesses, industry associations, investors, academia, communities, and employees. Some examples: As a founding member of the United Nations Environment Programme’s Science-Policy-Business Forum on the Environment (UNEP-SPBF), IBM is helping to demonstrate how data and advanced information technology can underpin new solutions to persistent environmental problems. In 2021, IBM participated in the launch of the UNEP-SPBF Asia chapter, sharing information on how: – Farmers are using insights enabled by data and AI to improve crop yields. – The Plastic Recovery Insight and Steering Model platform (PRISM)—co-developed by IBM and the Alliance to End Plastic Waste—is digesting disparate data and applying analytics to help inform decisions to reduce plastic waste leakage. – The IBM-developed VolCat process can turn PET (a type of plastic commonly used in food packaging and polyester clothing) into a renewable resource. – IBM is identifying new catalysts that enable efficiency improvements in the conversion of carbon dioxide (CO 2 ) to new materials such as aliphatic polycarbonates. Environmental impact ↗ For more than 50 years, IBM has committed to environmental responsibility—a commitment formalized by our first corporate environmental policy in 1971, which integrated environmental responsibility throughout the fabric of our business. IBM views environmental leadership as a long-term strategic imperative, demonstrated today as we continue to set ambitious goals and apply our technologies to accelerate solutions to global environmental challenges. Global environmental management system IBM’s corporate environmental policy provides the strategic framework for the company’s global environmental management system (EMS). IBM has sustained a formalized EMS for decades, and it is continually updated to reflect our company’s intersections with environmental matters. The global applicability and scope of IBM’s EMS covers hardware product design, manufacturing, data centers, real estate operations, procurement, logistics, asset recovery services, and business services. This year marks the 25th anniversary of IBM’s single global registration to the ISO 14001 EMS standard and 10th anniversary of IBM’s single global registration of its EMS to the ISO 50001 energy management systems standard. Both registrations have been maintained continuously. 21 goals for environmental sustainability In 2021, IBM announced an updated set of 21 comprehensive, voluntary environmental sustainability goals that address the ways in which today’s IBM intersects with the environment. Collectively, the goals cover energy and climate change, conservation and biodiversity, pollution prevention and waste management, supply chain and value chain, and our global EMS. We establish near-term goals that are transparent and authentic to drive real progress and accountability. We work hard to avoid opaque representations of achievement. For detailed information about each of these goals, please see “Driving progress with 21 goals for environmental sustainability.” 39 IBM 2021 ESG Report
Spinoff of IBM’s managed infrastructure services business IBM completed the spinoff of its managed infrastructure services business, now a publicly traded company called Kyndryl, in early November 2021. Accordingly, the environmental information in this report includes 10 months of data for that business. When we publish results for calendar year 2022, they will cover a notably different base of operations. Energy and climate change IBM has been demonstrably committed to addressing climate change for three decades. As a founding partner, IBM helped the US Environmental Protection Agency (EPA) launch ENERGY STAR in 1992. We began disclosing CO 2 emissions in 1994, and made our first purchase of renewable electricity in 2001. IBM published its policy position on climate change in 2007, long before today’s acute focus, recognizing that climate change is a serious concern that warrants timely, meaningful action on a global basis. In 2015, IBM voiced its support for the Paris Agreement, and reaffirmed such support in 2017. IBM became a founding member of the Climate Leadership Council in 2019 and continues to support the council’s bipartisan plan for a carbon tax, with its proceeds—a “carbon dividend”—to be returned to citizens. Updated goals In 2021, IBM established its third consecutive goal for the use of renewable electricity; its fifth consecutive goal to reduce greenhouse gas (GHG) emissions; a goal to achieve net-zero GHG emissions; and related goals for energy conservation, data center energy efficiency, energy-efficient product design, suppliers, and client engagements. Nine of our goals involve climate change. Five are described below, and the others are cited in this report’s sections regarding product energy efficiency and supplier environmental goals: – Procure 75% of the electricity IBM consumes worldwide from renewable sources by 2025, and 90% by 2030. – Reduce IBM’s GHG emissions 65% by 2025, against base year 2010, adjusted for acquisitions and divestitures. – Reach net-zero GHG emissions by 2030, using feasible technologies to remove emissions in an amount which equals or exceeds IBM’s residual emissions. Aim for residual emissions of 350,000 metric tons of CO 2 equivalent or less by 2030. IBM joined the Climate Neutral Data Centre Pact in 2021. As a member, IBM will continue to increase energy efficiency, purchase additional renewable electricity, conserve water, and facilitate the reuse and repair of IT equipment at our data centers. Also in 2021, IBM became a founding member of the European Green Digital Coalition (EGDC). The EGDC is a group of companies committed to supporting the green and digital transformation of the European Union. In joining the coalition, IBM pledged to continue developing digital technologies and services that are more energy- and material-efficient, along with methods and tools to measure the environmental impacts of these technologies. IBM joined a dozen other enterprises as inaugural members of the Massachusetts Institute of Technology Climate and Sustainability Consortium, whose mission is to accelerate the large-scale, real-world implementation of solutions to address the threat of climate change. Charity Wayua of IBM Research Africa spoke at a UN Environment Assembly meeting on big data for the environment in March 2022. Photo credit: DSkilton/UN-SPBF 40 IBM 2021 ESG Report
IBM will publish year-end 2021 progress against its new renewable electricity and GHG emissions reduction goals in June 2022, once we have completed our annual external limited assurance audit of our GHG emissions calculation process and underlying data. + With reference to the voluntary Greenhouse Gas Protocol, this addresses Scope 1, Scope 2, and Scope 3 emissions associated with electricity consumption at third-party co-location data centers. + IBM has also committed to initiating 100 client engagements or research projects by 2025, in which IBM solutions have enabled demonstrable environmental benefits. For example, IBM Research is supporting the development of new carbon-removal solutions by accelerating the discovery of enabling materials. – Implement a minimum of 3,000 new energy conservation projects to avoid the consumption of 275,000 megawatt- hours (MWh) of energy from 2021 to 2025. – Improve average data center cooling efficiency 20% by 2025, against base year 2019. IBM’s new 2025 GHG emissions reduction goal achieves a rate of reduction that exceeds what scientists from the UN Intergovernmental Panel on Climate Change (IPCC) indicate is necessary to limit Earth’s warming to 1.5 degrees Celsius above pre-industrial levels. Our energy and emissions goals and reporting cover all activities taking place in IBM-owned or leased facilities (inclusive of Red Hat). These facilities also include IBM data centers located in facilities managed by third parties where IBM does not procure the energy or control the operations of the buildings—also known as co-location data centers. Energy conservation Continuing IBM’s five decades of commitment, we implemented 936 energy conservation projects in 2021 across more than 190 locations globally, avoiding 90,000 MWh of energy consumption and 26,500 metric tons (MT) of CO 2 emissions, and saving $9.9 million. 1 We adjusted schedules for lighting levels, temperature and other building systems to avoid unnecessary consumption of energy during the COVID-19 pandemic, when buildings were underutilized. We also implemented projects in our data centers to improve the energy efficiency of both cooling and IT equipment, retrofitted lighting, and improved the operational efficiency of our building infrastructure. 1 In measuring performance against IBM’s energy conservation goal, we only include the first year’s savings from projects. Accordingly, IBM’s total energy savings and CO 2 emissions avoidance from these projects are greater than this simple summation of the annual results. We do not include reductions in energy consumption resulting from downsizings, the sale of operations or cost-avoidance actions, such as fuel switching and off-peak load shifting, in our energy conservation results. 2021 energy conservation savings by project type Building controls projects 2% IT and cooling efficiency projects in data centers 30% Heating, ventillation, and air conditioning projects 37% Lighting efficiency and controls projects 9% Other projects 11% Central utility plant efficiency projects 11% 41 IBM 2021 ESG Report
We have deployed IBM’s Internet of Things (IoT) and analytics solution at 25 major IBM campuses covering 190 buildings and encompassing 41% of IBM’s global energy consumption. During 2021, this program helped identify energy conservation opportunities that resulted in the avoidance of 3,400 MWh of energy and $356,000 in expense. From 1990 through 2021, IBM conserved 9.9 million MWh of energy—equivalent to more than double IBM’s current annual energy consumption—saving $670 million and avoiding 4.6 million MT of CO 2 emissions. Data center energy efficiency We take a holistic approach to managing and improving the energy efficiency of our data centers—from improving existing space to derive more workload per area; to modernizing our IT infrastructure and reducing its energy consumption; to building or leasing new, higher-efficiency space. IBM calculates the power usage effectiveness (PUE) 1 at many of the data centers we manage and obtains PUE data from landlords of co-location data centers. For the limited number of data centers where we are unable to obtain PUE data, we use industry average data. Using this approach, we calculated our 2021 weighted average PUE to be 1.53. 2 This puts us on track to achieve our goal to improve the average cooling efficiency of our data centers by 20% by 2025 against a base year of 2019. Following the spinoff of IBM’s managed infrastructure services business in 2021, the majority of IBM’s data centers reside in third-party managed locations. We have developed and negotiated lease terms that enable us to engage and collaborate 1 Power usage effectiveness (PUE) is the ratio of the total energy consumed by the data center divided by the energy consumed by the IT equipment. The closer the value is to 1, the more energy efficient the data center and its cooling delivery are. 2 Includes only those data centers that remained with IBM after the Kyndryl spinoff. 2017 2018 2019 2020 2021 Energy and climate change IBM total energy consumption in megawatt-hours 4,845,695 4,666,514 4,455,805 4,118,636 † Renewable electricity procurement as % of total electricity consumption (goal 75% by 2025) 39.0 37.9 47.5 59.3 † CO 2 emissions reduction as % of 2005 base year CO 2 emissions (previous goal 40% by 2025) 30.1 32.2 39.7 56.6 † IBM total operational CO 2 emissions in metric tons 1,417,985 1,375,027 1,222,623 880,188 † Note: Energy and emissions goals and reporting cover all activities taking place in IBM-owned or leased facilities (inclusive of Red Hat). These facilities include co-location data centers. Renewable electricity procurement includes contracted purchases and renewable electricity that automatically comes to IBM via routine grid power. CO 2 emissions reduction data is adjusted for acquisitions and divestitures. † IBM will publish its 2021 energy and climate change data in June 2022, after we have completed an external limited assurance audit of our GHG emissions process and underlying data. with landlords to improve the efficiency of support infrastructure toward meeting our goal. Use of renewable electricity In 2020, 59.3% of the electricity consumed across IBM’s global operations came from renewable sources. That total includes 43.3% directly contracted from IBM’s power suppliers, in addition to the other 16% already in the electricity mix we received from the grid. We continued to increase our usage of renewable electricity in 2021, executing seven new renewable electricity contracts and expanding our supply of renewables in six existing contracts and leases across seven countries. IBM will publish its full 2021 progress in June 2022, when it releases its 2021 GHG emissions inventory. When reporting our consumption of renewable electricity, we count only what is generated in the grid regions where our consumption actually occurs. We do not purchase unbundled renewable energy certificates representing energy we cannot consume, which would inflate our results. For more information about how IBM calculates its consumption of renewable electricity, please visit our website . 42 IBM 2021 ESG Report
consumed (rPerf/kilowatt [KW]) by 34% over previous- generation IBM Power9-based servers. IBM Power® has a 20-plus-year history of improved system performance per watt. Since the release of our first system with Power4 processors in 2001, to the release of our Power10 processor-based servers in 2021, the IBM Power family has improved its performance by a factor of 43. When performance is measured per unit of power consumed (rPerf/KW), the IBM Power processor-based servers show a 64x improvement. IBM continues to certify products under the US EPA ENERGY STAR program. In 2021, IBM had five Power9-based server models subject to ENERGY STAR criteria, and four of them were certified (models S914, S922, S924, and E950). No IBM Power10 servers released in 2021 were subject to the ENERGY STAR criteria. IBM also had four storage products certified to ENERGY STAR in 2021. CO 2 emissions reduction In 2020, IBM’s operational CO 2 emissions decreased by 56.6% against base year 2005, adjusted for acquisitions and divestitures. IBM does not purchase nature-based carbon offsets to claim any reduction of IBM’s emissions. IBM will publish its 2021 progress against its new GHG emissions reduction goal in June 2022, together with its 2021 GHG emissions inventory. Product energy efficiency IBM designs its products to be energy efficient, incorporate recycled content and environmentally preferable materials, and facilitate reuse and recycling at their end of life. For more than two decades, IBM has maintained a goal to improve the computing power delivered for each kilowatt-hour of electricity consumed for new server products as compared to equivalent, previous-generation products with a valid upgrade path. IBM’s latest Power10-based server, the E1080, was released in 2021 and improved the work delivered per unit of power 64x improvement 0.0 0.5 1.0 1.5 2.0 2.5 Power10 Power9 Power8 Power7 Power6+ Power6 Power5+ Power5 Power4+ Power4 Hundreds (rPerf/KW) References: IBM Power Performance Report Power7 to Power10 IBM Power Systems Performance Report Archive (Power8, Power7, Power6, and Power5) Notes: – Comparisons are made for Power processors generation to generation based on a possible server upgrade path from machine to machine. – Values for Power4 through Power6+ are based on rPerf SMT2. For Power7, high-end rPerf values are based on SMT4. Power8 and Power9 rPerf SMT4 values are used. – Power consumption values published are based on the IBM “Maximum Measured Power Consumption,” which is the greatest overall power consumption based on the largest configuration and highest utilization. While the rPerf configurations are smaller and may not be operating at 100% utilization, for a fair comparison between models with a power consumption consistently published, the maximum measured power consumption is used. IBM Power relative performance per kilowatt energy consumed (rPerf/KW) improvement 43 IBM 2021 ESG Report
certification program such as the Forest Stewardship Council, Programme for the Endorsement of Forest Certification, Sustainable Forestry Initiative, or the Canadian Standards Association Group Sustainable Forest Management System standard. In 2021, over 99% (based on spend) of the paper and paper/wood-based packaging IBM directly procured worldwide came from suppliers that warranted that the source was derived from sustainably managed forests. Biodiversity IBM has been a member of the Wildlife Habitat Council (WHC) since 1991. Four IBM sites (IBM Corporate Headquarters, New York; IBM Research Triangle Park, North Carolina; and IBM Almaden Research Center and IBM Silicon Valley Laboratory, California) have maintained WHC Conservation Certification for their wildlife habitat management and conservation education programs for over 17 years. In 2021, we worked with the WHC to develop education materials on how to create pollinator-friendly habitats and provided them to IBM employees worldwide. We also set a goal to plant 50 pollinator gardens at IBM locations globally by year-end 2023. Planning and design are underway as we work toward this goal. Conservation and biodiversity IBM has comprehensive programs and goals that help conserve natural resources and protect the biodiversity of our ecosystems. Water conservation Preserving water resources and safeguarding watersheds are important priorities. IBM’s water conservation goal is to achieve year-to-year reductions in water withdrawals at larger IBM locations and data centers in water-stressed regions. In 2021, withdrawals at these locations decreased by 1.2% versus 2020. IBM’s primary use of water at locations subject to this goal is cooling and humidity control at offices and data centers (40% of total water withdrawals), irrigation (31% of total water withdrawals), and domestic water use in the workplace (29% of total water withdrawals). In 2021, water withdrawal reduction efforts consisted of installing automatic irrigation systems and decreasing overall landscape irrigation, upgrading cooling tower equipment and water storage tanks, and ongoing maintenance of water pipes. In addition, IBM reused or recycled over 26,500 cubic meters of water for landscape irrigation and to supplement makeup water used in cooling tower systems. Further, IBM is raising awareness of the importance of efficient use of water and conservation during new employee onboarding. IBM also continues to look for opportunities to reduce water use at locations outside of water-stressed regions. In 2021, more than 40,000 cubic meters of water were saved through various conservation projects, including upgrades to reverse osmosis deionized water systems at IBM Research locations to allow for reuse of reject water. Paper and paper/wood-based packaging IBM has sustained a voluntary goal for the responsible sourcing of paper and paper/wood-based packaging since 2002, requiring that paper and paper/wood-based packaging directly procured by IBM come from suppliers that source from sustainably managed forests. Suppliers must either disclose their sources for paper and paper/wood-based packaging to IBM or provide evidence that their sources have been certified to be from sustainably managed forests by an accredited third-party 2017 2018 2019 2020 2021 Water conservation % annual reduction in water withdrawals at data centers and other large IBM locations in water-stressed regions (goal year-over-year reduction) 2.9 0.4 2.0 6.7 1.2 IBM considers climate-related risks in its enterprise risk management process. See page 15 for more information. 44 IBM 2021 ESG Report
Local EcoTeams—employees who volunteer to participate in a variety of local environmental initiatives—lead projects to support ecosystem diversity and protection. IBM’s 28 EcoTeams, which span 70 IBM locations across 21 countries, completed approximately 180 activities in 2021: holding learning events; planting trees; maintaining pollinator gardens, bird boxes, and beehives; participating in beach cleanups; and more. Pollution prevention and waste management The best way to prevent pollution is to reduce the generation of waste at its source. This has been a basic tenet of IBM’s pollution prevention program since 1971. For waste that is generated, we focus on preventing pollution through a comprehensive, proactive waste management program. IBM’s waste management practices, in order of preference, are: (1) prevention and source reduction, (2) reuse, (3) recycling, (4) recovery, (5) other treatment, and (6) land disposal. Nonhazardous waste In 2021, IBM updated its nonhazardous waste goal to divert 90% or more (by weight) of IBM’s total nonhazardous waste from landfill and incineration by 2025, through reuse, recycling, composting, and waste-to-energy processes, and to use waste-to-energy processes for no more than 10% (by weight) of the diverted waste. This goal builds upon IBM’s prior waste management goals across several decades. In 2021, our operations generated 20,700 MT of nonhazardous waste worldwide, including IBM-owned nonhazardous end-of- life machines, parts, and materials, which accounted for 48% by weight of IBM’s total nonhazardous waste generated worldwide. We diverted 94.2% (by weight) of IBM’s total nonhazardous waste from landfill and incineration. Only 9.7% (by weight) of the total nonhazardous waste diverted from landfill and incineration was sent to waste-to-energy processes. These results were achieved through proper management of end-of-life IT materials by IBM’s global network of equipment recovery centers that enhance IT product reuse and recycling; improved office, cafeteria, and yard waste collection infrastructure resulting in better waste separation; and the elimination of some nonessential, single-use plastic items and packaging from our cafeterias. In addition, IBM avoided the generation of 424 MT of waste and saved an estimated $200,000 in disposal costs through a newly launched Furniture Donation Program for employees and external organizations in 2021. 2017 2018 2019 2020 2021 Nonhazardous waste landfill and incineration avoidance Total generated (metric tons × 1,000) 36.7 † 34.0 † 31.5 † 22.1 † 20.7 % by weight diverted from landfill or incineration (goal 90% by 2025) 87.7 † 89.4 † 87.3 † 83.3 † 94.2 % by weight of diverted waste sent to waste-to-energy processes (goal no more than 10%, established in 2021) – – – – 9.7 † Some batteries managed appropriately as hazardous waste were erroneously reported as nonhazardous waste during 2017–20. Although the change is extremely small, we have updated the results with the quantity of this hazardous waste removed. Product reuse and recycling % by weight of total IT product waste sent by IBM’s product end-of-life operations to landfill or incineration for treatment (goal not to exceed a combined 3% by weight) 0.7 0.7 0.8 0.5 0.3 45 IBM 2021 ESG Report
Nonessential, single-use plastics in cafeterias IBM set a goal in 2021 to further our efforts to eliminate nonessential, single-use plastic items (e.g., cups, straws, cutlery, plates, carry bags, and food containers) from IBM-managed cafeteria operations globally by 2025. Our focus in 2021 was to engage with our largest cafeteria vendor to identify single-use plastic items used in IBM-managed cafeterias at 37 locations spanning 17 countries. Alternatives for nonessential, single-use plastic items that are either reusable or compatible with each site’s local recycling/composting infrastructure were identified and will begin to roll out in 2022. Product packaging IBM set a goal in 2021 to eliminate nonessential plastic from the packaging of IBM logo hardware by year-end 2024. For essential plastic packaging, our goal is to ensure such packaging is designed to be 100% reusable, recyclable, or compostable, or incorporates 30% or more recycled content where technically feasible. We established a team of packaging engineering and logistics experts to execute the goal. The team completed an inventory of plastic packaging items and determined whether the items were essential. We have started to eliminate nonessential items and identify possible alternatives for the remaining items. To date, 18 single-use plastic packaging elimination and material substitution projects have been identified and are at various stages of investigation and implementation. Two specific projects completed in 2021 were: – The elimination of stretch wrap (low-density polyethylene) used to protect parts/machines from weather. The estimated annual material savings from implementation of this project is 1.9 MT, or 238,000 linear meters of stretch wrap. – The qualification and implementation of high-recycled- content polyethylene cushions used for IBM z Systems,® Power, and storage products. These efforts have reduced the use of virgin packaging materials by 60%. The estimated annual material savings from implementation of this project is 90 MT. 2021 product end-of-life processing methods Product reuse and recycling For many decades, IBM has developed products with consideration for ease of their servicing and upgradability, and for the reuse, recyclability and recoverability of materials used in the products. We also have a long-standing goal to reuse or recycle end-of-life products such that the amount of product waste sent by our operations to landfills or for incineration does not exceed a combined 3% (by weight) of the total amount processed. In 2021, IBM processed more than 18,000 MT of end-of-life products and product waste, with 97.7% (by weight) reused, resold, or sent for recycling, 2.0% sent to waste-to- energy for final disposition, and 0.3% sent to landfills or for incineration. Since we began reporting on product disposal in 1995, IBM has processed 1.12 million MT (2.46 billion pounds) of products and product waste worldwide. Landfill or incineration 0.3% Resold 35.7% Recycled 60.5% Waste-to-energy 2% Reused 1.5% 46 IBM 2021 ESG Report
Supplier environmental goals Since 2010, IBM has required all first-tier suppliers to establish their own social and environmental management systems as well as set quantifiable goals and publicly disclose progress toward those goals in the areas of energy management, GHG emissions reduction, and waste management. This is an important aspect of IBM’s deployment of the RBA code with its suppliers of hardware, software, and services. In 2021, IBM established three goals to help accelerate GHG emissions reductions in our supply chain and to encourage suppliers to take ownership and build their capabilities across a broad range of sustainability topics. These goals: – Require key suppliers in emissions-intensive business sectors to set an emissions reduction goal by 2022, addressing their Scope 1 and Scope 2 GHG emissions, that is aligned with scientific recommendations from the UN IPCC to limit Earth’s warming to 1.5 degrees Celsius above pre-industrial levels. + During 2021, we worked with logistics, airline, and hotel suppliers (representing 28% of suppliers covered by the scope of our goal) to collect information about their emissions reduction goals, and we have started an assessment to determine their alignment with the UN IPCC recommendations. In 2022, we will contact the remaining in-scope suppliers, complete an assessment of their targets, and work with any suppliers not yet meeting the goal to establish action plans. – Establish, by year-end 2021, individual baselines for fleet carbon intensity with each key carrier and shipment supplier involved with IBM’s product distribution globally. Starting in 2022, convene with each supplier to set a fleet carbon intensity reduction target covering the services they provide to IBM. + In 2021, we engaged our top five logistics suppliers and established a fleet carbon intensity baseline for their logistics operations. In 2022, we will continue to work with these suppliers to obtain more insights into the carbon intensity of their fleets and set carbon intensity reduction goals. – Convene an annual Sustainability Leadership Symposium to recognize progress and achievement among suppliers in emissions-intensive business sectors across applicable areas of environmental stewardship. + Our first Supplier Sustainability Leadership Symposium is planned for the second half of 2022. Remediation At IBM, we take swift action to clean up any environmental contamination found at former and current sites, and we are committed to taking proactive measures to prevent future contamination. When groundwater contamination was first discovered at one of IBM’s sites in 1977, we voluntarily initiated groundwater monitoring at our manufacturing and development locations worldwide. Today, IBM has more than 2,000 monitoring wells in place at its current and former locations. In 2021, IBM operated remediation systems that removed approximately 10,200 pounds of solvents from groundwater and soil vapor at three currently operating IBM locations and 12 former IBM locations. IBM also has financial responsibility for remediation at one additional former location. Under the US Superfund law, IBM is also involved in remediation activities at some third-party sites in the United States. The Superfund law creates retroactive responsibility for all parties that may have sent waste or otherwise contributed to contamination at a site, regardless of whether the site’s operations and/or the shipments of waste to that site were legal, or even best practices, at the time. Currently, IBM is participating in remediation activities or bears some financial responsibility at 19 Superfund sites. 47 IBM 2021 ESG Report
Using technology and expertise to help clients and the world IBM continues to apply technologies and expertise to help clients become more environmentally sustainable and accelerate solutions to address environmental challenges. Using AI to help reduce landfill waste As Italy’s largest waste management and recycling company and a leading multi-utility, Hera is on the front lines working to reduce waste and minimize environmental impacts. Hera personnel manually analyze the waste unloaded at their plants and help direct recoverable materials for downstream sorting. It’s an onerous job, and consider it at scale: 1,400 spotters across 89 plants treating 6.3 million tons of waste every year. Hera worked with IBM to explore how AI-powered automation could improve efficiency and help channel more material to new use. By engaging IBM Garage™ and incorporating IBM Watson® Studio and IBM Watson Machine Learning technology, Hera and IBM co-created and released a minimum viable product (MVP) in just eight weeks that captures video of trash at individual collection points and uses AI to recognize plastic waste that would qualify for recovery and reuse. The teams continue their work to train AI to find recoverable waste and scale their MVP. Learn more here . Harnessing data and AI to operationalize insights Companies increasingly recognize the expectations to demonstrate their progress toward sustainability in a quantifiable way. IBM has a growing portfolio of AI-enabled software to help companies assess the impacts of the environment on business and of business on the environment, including its recently acquired Envizi. Using Envizi with IBM’s broader software portfolio, companies will now be able to automate the feedback generated between their environmental initiatives and the operational endpoints being used in daily business activities—a crucial step in making sustainability efforts more scalable. For example, Envizi will integrate with IBM Maximo® asset management solutions, IBM Sterling® supply chain solutions, and IBM Environmental Intelligence Suite, which helps companies increase resiliency by assessing and planning for the impact of environmental conditions on their operations. Learn more here . Supporting renewable electricity market growth The state of Maine is encouraging greater use of renewable resources. This has resulted in significant changes to the electric distribution business to connect distributed generation facilities with electric consumers. IBM helped Versant Power, one of Maine’s largest utilities, define new business processes and upgrade its systems to support renewable electricity market growth. Since these modified systems were deployed in mid-2021, 11 new renewable generation facilities have been added to Maine’s electricity supply and 17.4 megawatt (MW) capacity has been brought online. Another 342.7 MW are expected to be added within the next two years. Accelerated discovery of more sustainable materials IBM researchers are using AI, hybrid cloud, and quantum computing to find novel and more sustainable materials faster. In the field of materials discovery, identifying a new material may take 10 years of research and can cost $10 million to $100 million to develop. The AI-boosted Accelerated Discovery approach, developed at IBM Research, uses a combination of advanced computing technologies to enable researchers to rapidly design new materials with specific properties that can be used to develop more sustainable products, mitigate climate change, and more. Some recent successes of this approach: Computer chips: Photoacid generators (PAGs) play a vital role in the manufacturing of computer chips, but they are one of several classes of chemical compounds used in semiconductor manufacturing that have recently come under enhanced scrutiny from global environmental regulators. IBM researchers were able to accelerate the process of designing and synthesizing new PAGs with improved environmental properties . Learn more here . Carbon capture: Invisible and difficult to capture, CO 2 is a great challenge in tackling climate change. Capturing it at the point of origin is thought to be one of the most effective ways to limit its release into the environment. IBM researchers identified several hundred molecular structures that could enable more efficient and cheaper alternatives to existing separation membranes for capturing CO 2 emitted in industrial processes. Researchers are now evaluating these candidate molecules. Learn more here . 48 IBM 2021 ESG Report
Appendix 49 IBM 2021 ESG Report 49 IBM 2021 ESG Report

IBM is recognized every year for its corporate responsibility efforts by publications, advocacy groups, governments, and nongovernmental organizations worldwide. Below are highlights of our recognition from 2021 and early 2022. Fast Company Best Workplaces for Innovators (2021: #5, up from 84) Reuters Responsible Business Awards 2021 – DE&I Shortlist Fortune 100 Best Companies to Work For 2021 – #72 PEOPLE/Great Place to Work 50 Companies That Care 2021 AnitaB.org 2021 Top Companies for Women Technologists Human Rights Campaign 2021 Best Places to Work for LGBTQ Equality Ethisphere 2021 World’s Most Ethical Companies 3BL Media Best Corporate Citizens of 2021 AI Breakthrough Awards 2021 – Best Overall Natural Language Processing Company The Global CSR Awards 2021 “Best Environmental Excellence Award” – Platinum JUST Capital 2022 JUST 100 – #19 overall, #1 in industry Fortune 2021 World’s Most Admired Companies – #46 overall, #3 in IT Services industry Business Intelligence Group 2021 Sustainability Leadership Award (Organization) His Royal Highness The Prince of Wales 2021 Inaugural Terra Carta Seal for our commitment to sustainable markets Institute of Directors, India, 2021 Golden Peacock Global Award for Sustainability S&P Global Platts 2021 Global Energy Awards – Energy Consumer Sustainability Award SEAL Awards – 2021 SEAL Sustainable Product Award for the IBM z15™ Telecommunications Industry Association 2021 Global Sustainability Award Fortune Best Big Companies to Work For 2021 – #14 Fortune Best Large Workplaces in Technology 2021 – #13 Military Friendly Employer 2022 – #3 Winds of Change Top 50 Workplaces for Indegenous STEM Professionals 2021 List IBM Canada was recognized in 2021 as one of Canada’s Best Diversity Employers, for the third year in a row. Forbes and Statista recognized IBM as one of America’s Best Employers for New Grads 2021. Forbes and Statista have recognized IBM as one of America’s Best Employers for Diversity 2021. Awards and recognition highlights 50 IBM 2021 ESG Report
These 50 firms receive 89% of IBM’s spending in this category. II-VI Incorporated AcBel Polytech Amkor Technology Advanced Energy Amphenol BDT Media Automation Benchmark Broadcom Celestica Cisco Delta Electronics Deutsche Post DHL FedEx Flex Fuji Electric Fujifilm Fujitsu Geodis GlobalFoundries Intel Iron Mountain Jabil Kioxia Kyocera Lenovo Adecco Akamai Amazon Web Services Aon Apleona Artech AT&T Beijing Foreign Enterprise Service BMC Software BrandMuscle Broadcom Capgemini Engineering CBRE Cisco Cloudera Collabera Computer Task Group CRESCO Group Dell Technologies Deloitte Ernst & Young George P. Johnson HCL Technologies Infinite Computing Systems Jones Lang LaSalle Marvell Mercury Corporation Micron Technology Molex NCR NEC Platform Technologies Nippon Express NVIDIA Redsis Samsung Seagate SK hynix SMART Modular Technologies Sony Super Micro Computer Teleplan Toshiba Trenton Systems UPG UPS Venture Corporation WESCO Western Digital Wistron Zollner Elektronik Kyndryl Lenovo Manpower Group MetLife Microsoft NTT Group Open Systems Technologies Oracle Persistent Systems Rocket Software Salesforce SAP SDI Incorporated ServiceNow SHI International State Street Sumitomo Corporation Tech Mahindra The Employment Solution TIS INTEC Group UNICOM Systems Verizon Westcon-Comstor Willis Towers Watson WPP These 50 firms receive 47% of IBM’s spending in this category. Production and Logistics Services and General Procurement IBM’s Production and Logistics Procurement suppliers support our hardware brands and product distribution operations, while Services and General Procurement suppliers support client services, software offerings and internal operations. Below are lists of IBM’s top 50 suppliers in each category in 2021, with links to their corporate responsibility reports, if available. (Click on a company name to go to its report.) Top suppliers 51 IBM 2021 ESG Report
International Business Machines Corporation New Orchard Road, Armonk, New York 10504 (914) 499-1900 © 2022 International Business Machines Corporation. All rights reserved. IBM, the IBM logo, ibm.com, Be Equal, Emb(race), IBM Cloud Pak, IBM Garage, IBM Research, IBM Sterling, IBM Volunteers, IBM Watson, Maximo, Open P-TECH, P-TECH, Power, SkillsBuild, z Systems, and z15 are trademarks or registered trademarks of International Business Machines Corp., registered in many jurisdictions worldwide. Red Hat is a registered trademark of Red Hat, Inc. or its subsidiaries in the United States and other countries. Intel is a registered trademark of Intel Corporation or its subsidiaries in the United States and other countries. Microsoft is a trademark of Microsoft Corporation in the United States, other countries, or both. Other product and service names might be trademarks of IBM or other companies.