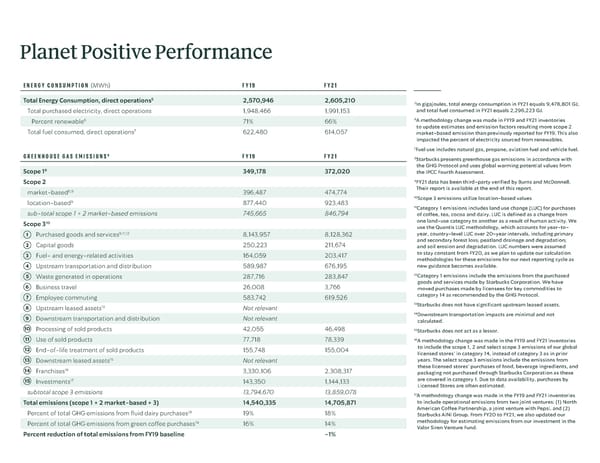
Planet Positive Performance ( ) ENERGY CONSUMPTION MWh FY19 FY21 5 Total Energy Consumption, direct operations 2,570,946 2,605,210 5 In gigajoules, total energy consumption in FY21 equals 9,478,801 GJ, Total purchased electricity, direct operations 1,948,466 1,991,153 and total fuel consumed in FY21 equals 2,296,223 GJ. 6 6 Percent renewable 71% 66% A methodology change was made in FY19 and FY21 inventories to update estimates and emission factors resulting more scope 2 7 Total fuel consumed, direct operations 622,480 614,057 market-based emission than previously reported for FY19. This also impacted the percent of electricity sourced from renewables. 7Fuel use includes natural gas, propane, aviation fuel and vehicle fuel. GREENHOUSE GAS EMISSIONS8 FY19 FY21 8 Starbucks presents greenhouse gas emissions in accordance with the GHG Protocol and uses global warming potential values from 9 Scope 1 349,178 372,020 the IPCC Fourth Assessment. 9 Scope 2 FY21 data has been third-party verified by Burns and McDonnell. 6,9 Their report is available at the end of this report. market-based 396,487 474,774 10 Scope 3 emissions utilize location-based values 9 location-based 877,440 923,483 11 Category 1 emissions includes land use change (LUC) for purchases sub-total scope 1 + 2 market-based emissions 745,665 846,794 of coffee, tea, cocoa and dairy. LUC is defined as a change from 10 one land-use category to another as a result of human activity. We Scope 3 use the Quantis LUC methodology, which accounts for year-to- 1 9,11,12 year, country-level LUC over 20-year intervals, including primary Purchased goods and services 8,143,957 8,128,362 and secondary forest loss; peatland drainage and degradation; 2 Capital goods 250,223 211,674 and soil erosion and degradation. LUC numbers were assumed 3 to stay constant from FY20, as we plan to update our calculation Fuel- and energy-related activities 164,059 203,417 methodologies for these emissions for our next reporting cycle as 4 new guidance becomes available. Upstream transportation and distribution 589,987 676,195 12 5 Category 1 emissions include the emissions from the purchased Waste generated in operations 287,716 283,847 goods and services made by Starbucks Corporation. We have 6 Business travel 26,008 3,766 moved purchases made by licensees for key commodities to 7 category 14 as recommended by the GHG Protocol. Employee commuting 583,742 619,526 13 8 13 Starbucks does not have significant upstream leased assets. Upstream leased assets Not relevant 14 9 Downstream transportation impacts are minimal and not Downstream transportation and distribution Not relevant calculated. 10 15 Processing of sold products 42,055 46,498 Starbucks does not act as a lessor. 11 16 Use of sold products 77,718 78,339 A methodology change was made in the FY19 and FY21 inventories 12 to include the scope 1, 2 and select scope 3 emissions of our global End-of-life treatment of sold products 155,748 155,004 licensed stores’ in category 14, instead of category 3 as in prior 13 15 years. The select scope 3 emissions include the emissions from Downstream leased assets Not relevant these licensed stores’ purchases of food, beverage ingredients, and 14 16 Franchises 3,330,106 2,308,317 packaging not purchased through Starbucks Corporation as these 15 17 are covered in category 1. Due to data availability, purchases by Investments 143,350 1,144,133 Licensed Stores are often estimated. subtotal scope 3 emissions 13,794,670 13,859,078 17 A methodology change was made in the FY19 and FY21 inventories Total emissions (scope 1 + 2 market-based + 3) 14,540,335 14,705,871 to include operational emissions from two joint ventures: (1) North American Coffee Partnership, a joint venture with Pepsi, and (2) 18 Percent of total GHG emissions from fluid dairy purchases 19% 18% Starbucks AiNi Group. From FY20 to FY21, we also updated our 19 methodology for estimating emissions from our investment in the Percent of total GHG emissions from green coffee purchases 16% 14% Valor Siren Venture Fund. Percent reduction of total emissions from FY19 baseline -1%
 ESG Report | Starbucks Page 56 Page 58