ESG Report | Starbucks
021 REPORT STARBUCKS 2021 2 2 0 ORT 21 R E P REP Global 1 OR 20 T 2 T 02 RO 12 PE PER Environmental R 120TRO 2 && Social Impact Report PEOPLE PLANET GOVERNANCE
Introduction Twenty years ago, in our first As we report on the company’s Corporate Social Responsibility environmental and social impact in Together, with direct, open and transparent report, we shared, “Starbucks has FY21, we are proud of the progress the opportunity to lead by example. we have made and we remain conversation and collaboration we will Our responsibility starts with rooted in the belief that we can restore trust in each other, reimagine being accountable to Starbucks lead through the lens of humanity, stakeholders – our partners, far beyond the pursuit of profit. Starbucks and co-create our future. customers, shareholders, suppliers, This report outlines the goals we community members and others – have set and highlights the impact A future where our people and our communicating openly about our we can have together – when communities are never left behind, business practices and performance.” we uplift our partners, when we but always propelled forward. connect with our customers and our A future where our planet is cared Starbucks has always been a communities, and when we remain for and we create value not only for different kind of company – accountable to each other. our company, but for the collective one deep with purpose, where success of all our stakeholders. we work together to create a Our company, like many, is also positive impact in the world. facing new realities in a changed It is our role and our responsibility, We pursue ambitious goals for world – the continued effects of together. our partners, our communities COVID-19, heightened social and and our planet with intention, political unrest, efforts to unionize transparency and accountability. and stakeholders who seek new accountability from businesses. At times, we have fallen short of our ambitions. But we remain transparent about our missteps, while still rising to meet the opportunities ahead of us through our Mission and Values – and always with the aspiration to exceed the expectations of our partners and customers.
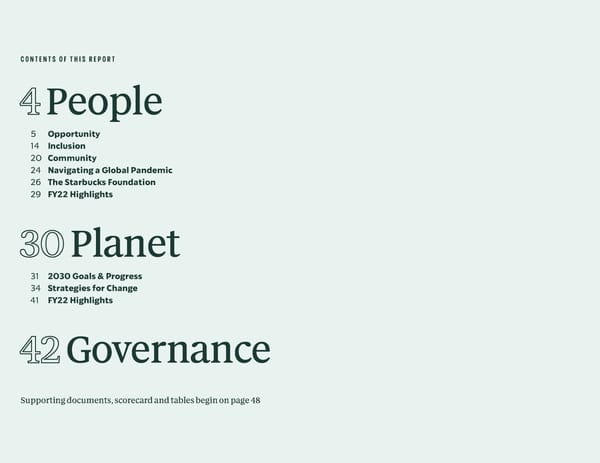
CONTENTS OF THIS REPORT 4 People 5 Opportunity 14 Inclusion 20 Community 24 Navigating a Global Pandemic 26 The Starbucks Foundation 29 FY22 Highlights 30 Planet 31 2030 Goals & Progress 34 Strategies for Change 41 FY22 Highlights 42 Governance Supporting documents, scorecard and tables begin on page 48
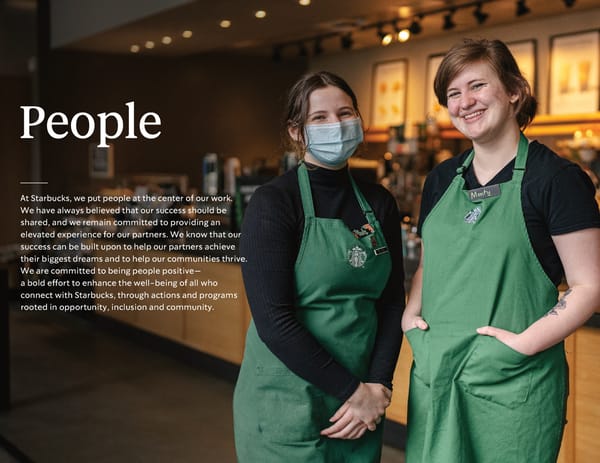
People At Starbucks, we put people at the center of our work. We have always believed that our success should be shared, and we remain committed to providing an elevated experience for our partners. We know that our success can be built upon to help our partners achieve their biggest dreams and to help our communities thrive. We are committed to being people positive— a bold effort to enhance the well-being of all who connect with Starbucks, through actions and programs rooted in opportunity, inclusion and community.
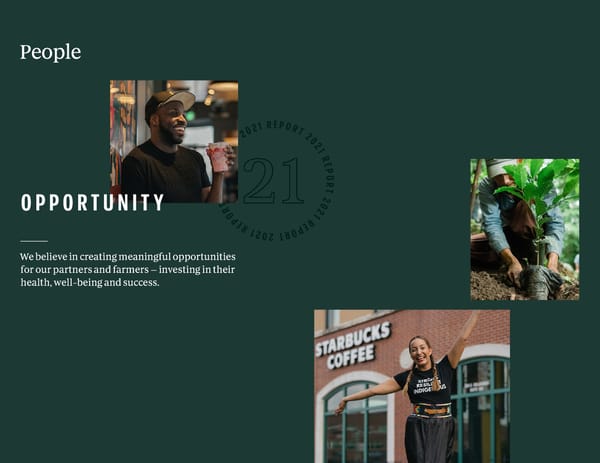
People 021 REPORT 2 T 2 02 OR 1 R EP E 1 R PO 20 TR 2T 02 OPPORTUNITY RO 12 PER PER 1202TRO We believe in creating meaningful opportunities for our partners and farmers — investing in their health, well-being and success.
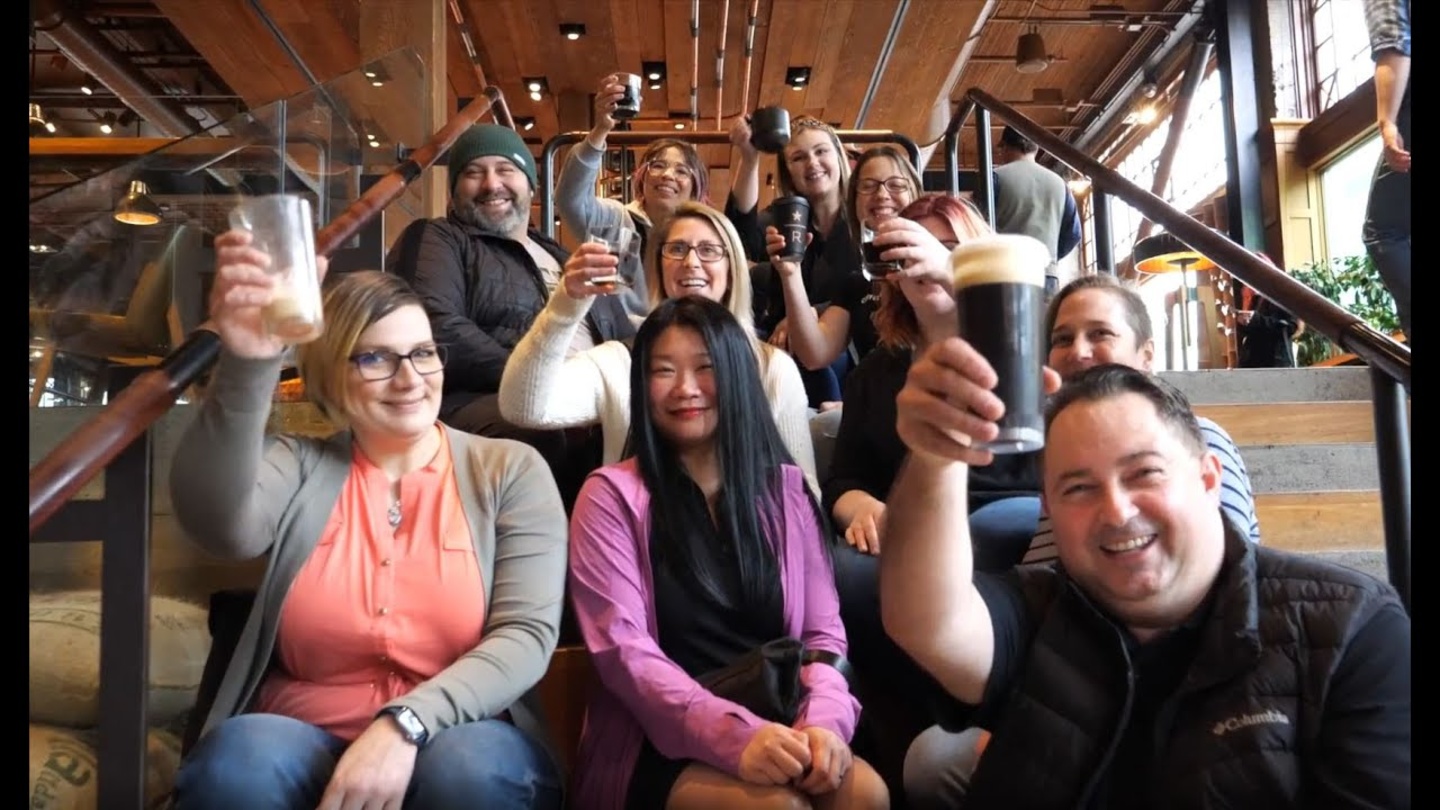
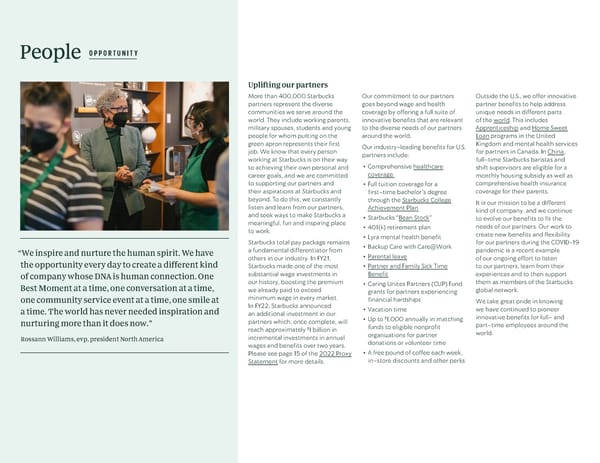
People OPPORTUNITY Uplifting our partners More than 400,000 Starbucks Our commitment to our partners Outside the U.S., we offer innovative partners represent the diverse goes beyond wage and health partner benefits to help address communities we serve around the coverage by offering a full suite of unique needs in different parts world. They include working parents, innovative benefits that are relevant of the world. This includes military spouses, students and young to the diverse needs of our partners Apprenticeship and Home Sweet people for whom putting on the around the world. Loan programs in the United green apron represents their first Our industry-leading benefits for U.S. Kingdom and mental health services job. We know that every person partners include: for partners in Canada. In China, working at Starbucks is on their way full-time Starbucks baristas and to achieving their own personal and • Comprehensive healthcare shift supervisors are eligible for a career goals, and we are committed coverage monthly housing subsidy as well as to supporting our partners and • Full tuition coverage for a comprehensive health insurance their aspirations at Starbucks and first-time bachelor’s degree coverage for their parents. beyond. To do this, we constantly through the Starbucks College It is our mission to be a different listen and learn from our partners, Achievement Plan kind of company, and we continue and seek ways to make Starbucks a • Starbucks “Bean Stock” to evolve our benefits to fit the meaningful, fun and inspiring place • 401(k) retirement plan needs of our partners. Our work to to work. create new benefits and flexibility Starbucks total pay package remains • Lyra mental health benefit for our partners during the COVID-19 “We inspire and nurture the human spirit. We have a fundamental differentiator from • Backup Care with Care@Work pandemic is a recent example others in our industry. In FY21, • Parental leave of our ongoing effort to listen the opportunity every day to create a different kind Starbucks made one of the most • Partner and Family Sick Time to our partners, learn from their of company whose DNA is human connection. One substantial wage investments in Benefit experiences and to then support Best Moment at a time, one conversation at a time, our history, boosting the premium • Caring Unites Partners (CUP) Fund them as members of the Starbucks we already paid to exceed grants for partners experiencing global network. one community service event at a time, one smile at minimum wage in every market. financial hardships We take great pride in knowing a time. The world has never needed inspiration and In FY22, Starbucks announced • Vacation time we have continued to pioneer an additional investment in our $ innovative benefits for full- and nurturing more than it does now.” partners which, once complete, will • Up to 1,000 annually in matching $ funds to eligible nonprofit part-time employees around the reach approximately 1 billion in organizations for partner world. Rossann Williams, evp, president North America incremental investments in annual donations or volunteer time wages and benefits over two years. Please see page 15 of the 2022 Proxy • A free pound of coffee each week, Statement for more details. in-store discounts and other perks
People OPPORTUNITY Our Commitment to Partners Innovative, Inclusive Healthcare Total Compensation & Retirement 100% College Tuition Coverage Partner & Family Support More Partner Perks • Comprehensive and affordable • Competitive wages • The Starbucks College • A welcoming and inclusive place • A po und of coffee each week choices in health insurance • Added pay for tenure at 2+ and Achievement Plan provides 100% to work • Disc ounts coverage with personalized 5+ years tuition coverage for a bachelor’s • Flexible hours to match partner support degree through a partnership with needs • F ree food and beverages on shift • Health insurance coverage that is • Opportunity to grow your career — Arizona State University • F ree Spotify Premium inclusive of transgender medical Barista Trainer, Shift Supervior and • Starbucks also extends this benefit • Professional networking and beyond career development through • F ree Headspace Premium needs to a spouse or child of partners Partner Networks • Fertility services including IVF • A robust 401(k) plan with match who are current members of the • Plus mor e • “Bean Stock” — partners share U.S. Armed Forces and Veterans • Paid Parental Leave for birth and • 20 free mental health sessions in our financial success through • Starbucks Global Academy offers non-birth parents each year grants of Starbucks stock access to courses for personal and • Partner and Family Sick Time professional development at no • Family Expansion Reimbursement cost • Partners can apply on day one • Childcare benefits • Vacation and other time off Partners who work 20 hours or more in the U.S. are benefits-eligible with health and college tuition benefits requiring eligibility. Around the world we have innovative benefits to address unique needs: • U.K.: Apprenticeship and Home Sweet Loan Programs • Canada: Mental health coverage and interest-free housing loans • China: Housing subsidy and health insurance for parents of partners
People OPPORTUNITY Training and Educational Resources Third Place Development Series We are investing Starbucks success back into our partners. Training and FY21 Results: 22 Pour Over sessions have been designed and implemented educational resources are designed to recruit and retain the best people and to date. affirm Starbucks as one of the very best jobs in retail globally. The way we hire, Since the beginning, we have worked to build and provide a third place develop and advance our partners is critical to our journey toward inclusion, where everyone is welcomed and respected. The Third Place Development diversity and equity at Starbucks. Series empowers partners to create an atmosphere of warmth and belonging We believe in sharing our educational resources with those outside of in Starbucks cafés. Building on the 2020 model, Starbucks engaged its Starbucks as part of our commitment to lifelong learning and providing partners in early 2021 to propose and vote on topic ideas through an internal many pathways to opportunity. Starbucks Global Academy is a platform for crowdsourcing platform. More than 175 ideas were submitted, and 2,500 Starbucks partners, customers, suppliers and community members around partners voted on their preferences. The four partner-generated Pour Over the world to access world-class, open-scale learning content without barriers topics selected for 2021–2022 modules include: biases related to age; and at no cost. Operated in partnership with Arizona State University (ASU), biases related to weight; non-apparent disabilities, like multiple sclerosis, Starbucks Global Academy learners deepen their knowledge on key Starbucks chronic fatigue and chronic pain; and bridging the political divide through initiatives and advance their personal and professional goals from a library of conversation. Each Pour Over session averages 10,000 unique views. over 100 curated courses including our To Be Welcoming curriculum, Greener Apron and Starbucks Coffee Academy. To Be Welcoming Barista Basics and Continuous Learning FY21 Results: Over 87,000 course enrollments in To Be Welcoming courses 1 globally and nearly 37,000 course completions since launch. $ FY21 Results: 1.2 billion invested in onboarding, immersion and continuing Our commitment to equal opportunity means cultivating an environment education training programs for our retail partners. where differences are embraced and building a culture that fosters a sense We invest in key training and learning programs to ensure that store partners of belonging. In 2018, we worked with ASU to create the To Be Welcoming are equipped with the knowledge, skills and ability to provide a great anti-bias curriculum for our partners. In 2020, we opened this 15-course $ curriculum to the public, free of cost. Now, we are working to meet our goal experience for Starbucks customers. In FY21, Starbucks invested 1.2 billion in training programs for our new and existing retail partners to foster smart of enrolling 100,000 learners – partners, customers and communities – in onboarding and continuous learning. the program to help more people engage with difficult topics through The Barista Basics Training Program provides the initial training for a newly academically robust, objective and research-based content. hired barista on essential skills and knowledge required for the role. Using simple and intuitive tools, skills are taught through one-to-one delivery and on-the-job training. It is a highly effective learning experience for a new barista that quickly enhances confidence and competence in delivering customer service. Starbucks is redesigning Barista Basics to include additional training time for all roles as well as practice shifts. We are also working to expand beyond our 40 highly successful training stores in the U.S. that are dedicated entirely to training partners in this area. 1 The geographic scope of this data point includes all company- owned and operated markets globally.
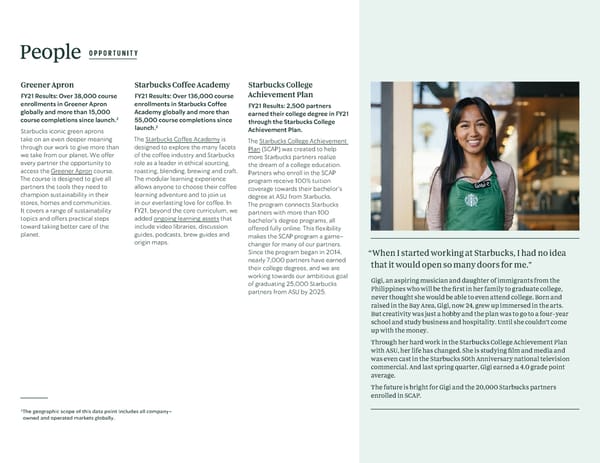
People OPPORTUNITY Greener Apron Starbucks Coffee Academy Starbucks College FY21 Results: Over 38,000 course FY21 Results: Over 136,000 course Achievement Plan enrollments in Greener Apron enrollments in Starbucks Coffee FY21 Results: 2,500 partners globally and more than 15,000 Academy globally and more than earned their college degree in FY21 2 course completions since launch. 55,000 course completions since through the Starbucks College Starbucks iconic green aprons launch.2 Achievement Plan. take on an even deeper meaning The Starbucks Coffee Academy is The Starbucks College Achievement through our work to give more than designed to explore the many facets Plan (SCAP) was created to help we take from our planet. We offer of the coffee industry and Starbucks more Starbucks partners realize every partner the opportunity to role as a leader in ethical sourcing, the dream of a college education. access the Greener Apron course. roasting, blending, brewing and craft. Partners who enroll in the SCAP The course is designed to give all The modular learning experience program receive 100% tuition partners the tools they need to allows anyone to choose their coffee coverage towards their bachelor’s champion sustainability in their learning adventure and to join us degree at ASU from Starbucks. stores, homes and communities. in our everlasting love for coffee. In The program connects Starbucks It covers a range of sustainability FY21, beyond the core curriculum, we partners with more than 100 topics and offers practical steps added ongoing learning assets that bachelor’s degree programs, all toward taking better care of the include video libraries, discussion offered fully online. This flexibility planet. guides, podcasts, brew guides and makes the SCAP program a game- origin maps. changer for many of our partners. Since the program began in 2014, “When I started working at Starbucks, I had no idea nearly 7,000 partners have earned that it would open so many doors for me.” their college degrees, and we are working towards our ambitious goal Gigi, an aspiring musician and daughter of immigrants from the of graduating 25,000 Starbucks Philippines who will be the first in her family to graduate college, partners from ASU by 2025. never thought she would be able to even attend college. Born and raised in the Bay Area, Gigi, now 24, grew up immersed in the arts. But creativity was just a hobby and the plan was to go to a four-year school and study business and hospitality. Until she couldn’t come up with the money. Through her hard work in the Starbucks College Achievement Plan with ASU, her life has changed. She is studying film and media and was even cast in the Starbucks 50th Anniversary national television commercial. And last spring quarter, Gigi earned a 4.0 grade point average. The future is bright for Gigi and the 20,000 Starbucks partners enrolled in SCAP. 2 The geographic scope of this data point includes all company- owned and operated markets globally.
People OPPORTUNITY Partner Networks FY21 Results: 12 Partner Networks EMEA Partner Networks: with 77 active chapters across the • Black Partner Network U.S. and an additional 19 partner (Est. 2020) 3 networks globally. • Pride Network Starbucks Partner Networks are (Est. 2020) partner-led groups that bring • Women’s Impact Network together people with shared (Est. 2020) identities and experiences, along Welcome, engage and empower Starbucks Share the heritage of the African diaspora Foster a community of awareness, with their allies, to promote a Veterans, military spouses and advocate to develop partners, advise our business inclusion and accessibility for partners Asia-Pacific Partner Networks: culture of inclusion and contribute partners in cultivating a strong community and enrich Starbucks contribution to our with apparent and non-apparent • Culture Club to the success of our partners and that embraces Veterans in the workplace customers and communities. (Est. 2007) disabilities. (Est. 2006) and enriches the Starbucks Experience. (Est. 2020, Hong Kong) our business. Our partners are (Est. 2007) • Disability Advocacy Network thoughtful advocates and powerful (Est. 2020, Hong Kong) voices to help promote change and • Partners for Sustainability understanding within the company (Est. 2020, Hong Kong) and beyond. Since the launch of the • Pride Alliance LGBTQ (now Pride Alliance) Partner (Est. 2020, Hong Kong) Network in 1996, partners across • Social Impact the global Starbucks community Celebrate the Latinx culture, develop Develop a global community contributing Preserve and celebrate Indigenous cultural (Est. 2020, Hong Kong) have created 12 networks with 99 partners and positively impact our to the growth of the India market, values, we will interweave communities by • Women’s Impact Network active chapters across the U.S. and customers and communities. (Est. 2006) celebrate Indian culture and support the teaching and understanding our heritage. (Est. 2018, India; est. 2020, 19 partner networks globally as of growth of partners from the region. Together, we will unite and continuously Hong Kong) February 2022. (Est. 2013) Walk in Beauty. (Est. 2020) Latin America and Caribbean Partner Networks: • Diversity Network (Est. 2021, Chile) • Ethical Diversity Network (Est. 2021, Brazil) Support and empower the next generation Foster meaningful connections and elevate Educate, engage and empower Starbucks • Partners with Disabilities of Starbucks leadership. (Est. 2015) the impact of Pan-Asian partners and partners to drive sustainable change. (Est. 2022, Brazil) allies within Starbucks and the community. (Est. 2021) (Est. 2007) • Pride Network (Est. 2019 in Argentina and Uruguay; est. 2021 in Chile and Colombia) • Refugee Network (Est. 2021, Costa Rica) • Sustainability Network (Est. 2021, Chile) 3 Strive to cultivate an equitable, dynamic Welcome, empower and advocate Ignite the power of women to make The geographic scope of this data point and supportive environment for LGBTQ for refugee partners and allies while an impact through partners, allies and includes all company-owned and partners, allies and customers. (Est. 1996) strengthening and enriching their global community. (Est. 2008) operated markets globally. Starbucks Experience. (Est. 2018)
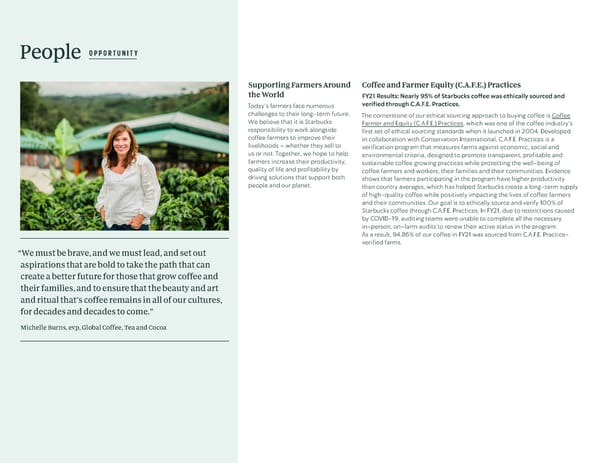
People OPPORTUNITY Supporting Farmers Around Coffee and Farmer Equity (C.A.F.E.) Practices the World FY21 Results: Nearly 95% of Starbucks coffee was ethically sourced and Today’s farmers face numerous verified through C.A.F.E. Practices. challenges to their long-term future. The cornerstone of our ethical sourcing approach to buying coffee is Coffee We believe that it is Starbucks Farmer and Equity (C.A.F.E.) Practices, which was one of the coffee industry’s responsibility to work alongside first set of ethical sourcing standards when it launched in 2004. Developed coffee farmers to improve their in collaboration with Conservation International, C.A.F.E. Practices is a livelihoods – whether they sell to verification program that measures farms against economic, social and us or not. Together, we hope to help environmental criteria, designed to promote transparent, profitable and farmers increase their productivity, sustainable coffee growing practices while protecting the well-being of quality of life and profitability by coffee farmers and workers, their families and their communities. Evidence driving solutions that support both shows that farmers participating in the program have higher productivity people and our planet. than country averages, which has helped Starbucks create a long-term supply of high-quality coffee while positively impacting the lives of coffee farmers and their communities. Our goal is to ethically source and verify 100% of Starbucks coffee through C.A.F.E. Practices. In FY21, due to restrictions caused by COVID-19, auditing teams were unable to complete all the necessary in-person, on-farm audits to renew their active status in the program. As a result, 94.86% of our coffee in FY21 was sourced from C.A.F.E. Practice- verified farms. “We must be brave, and we must lead, and set out aspirations that are bold to take the path that can create a better future for those that grow coffee and their families, and to ensure that the beauty and art and ritual that’s coffee remains in all of our cultures, for decades and decades to come.” Michelle Burns, evp, Global Coffee, Tea and Cocoa
People OPPORTUNITY Responsible Sourcing for Tea Responsible Sourcing for Traceability FY21 Results: 99.9% of tea sourced Cocoa FY21 Results: More than 33,000 by Global Coffee, Tea & Cocoa, the FY21 Results: Global Coffee, Tea bags of coffee were traced using company’s global coffee sourcing and Cocoa, the company’s global our online tool. team, verified as responsibly coffee sourcing team, purchased In 2020, the Starbucks Digital sourced. 10 million kilograms of Traceability tool was launched in Sourcing certified tea is a key aspect segregated cocoa beans. North American retail stores to of our ethical sourcing approach. In Like coffee and tea, we are dedicated transform each bag of coffee beans FY21, Global Coffee, Tea & Cocoa, the to sourcing cocoa responsibly, for into a digital passport, launching company’s global coffee sourcing the betterment of people and planet. coffee lovers on a virtual expedition team, sourced 99.9% of tea from In FY21, Global Coffee, Tea and to meet farmers, roasters and Rainforest Alliance Certified farms. Cocoa, the company’s global coffee baristas and to explore coffee- Farms, forest communities, and sourcing team, purchased 10 million growing regions around the world. businesses that participate in kilograms of segregated cocoa beans In FY21, more than 33,000 bags Rainforest Alliance’s certification from the Ivory Coast through our Tier of coffee were traced using the program are audited against 1 supplier, Cargill.4 traceability tool online, and the tool We continue to rigorous sustainability standards source Rainforest Alliance Certified was accessed by nearly 170,000 based on the triple bottom line: cocoa and to work in partnership unique visitors, raising awareness environmental, economic and social with the Rainforest Alliance to for farmers, C.A.F.E. Practices and well-being. leverage their expertise and increase Starbucks ongoing commitment to In addition to our global coffee our due diligence and transparency transparency. sourcing team, Starbucks regional in our cocoa supply chains. We teams also purchase tea. Moving are a member of the World Cocoa forward, we are working with Foundation and continue to work regional markets to verify their with others across the industry to purchases using a consistent set evolve and strengthen our approach of ethical sourcing guidelines and to responsibly sourced cocoa. expect to provide reporting on those In addition to our global sourcing efforts in coming years. team, Starbucks regional teams also purchase cocoa. Moving forward, we are working to provide additional transparency across all cocoa- based products sourced across the company globally. 4More on Cargill’s approach to Cocoa procurement can be found here.
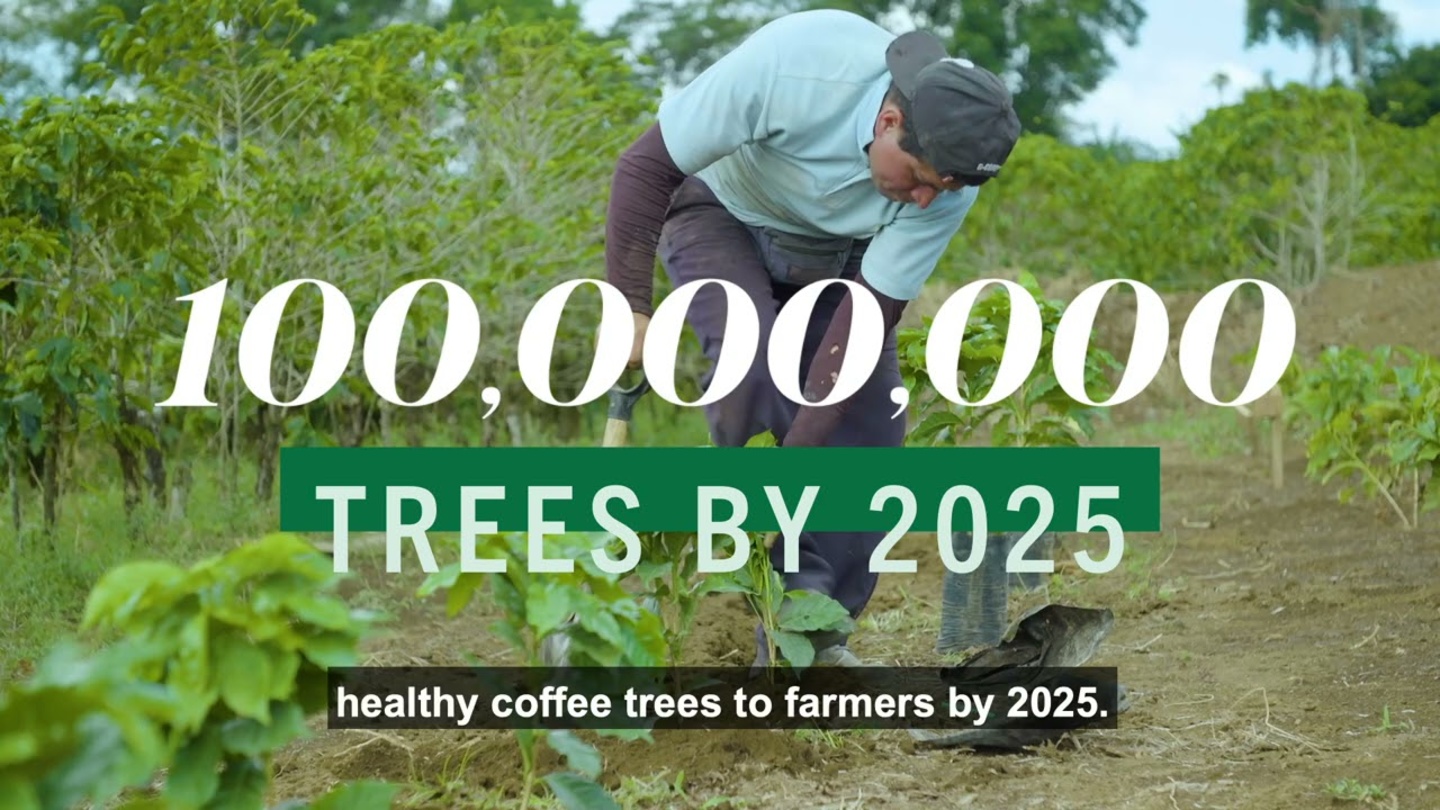
People OPPORTUNITY Global Farmer Fund Farmer Support Centers Childcare Centers FY21 Results: Starbucks doubled the FY21 Results: Opened our 10th FY21 Results: Five new centers $ Global Farmer Fund to 100 million. Farmer Support Center globally. opened in Guatemala to support $ More than 30,000 people farming families during harvest. Since FY18, 54.8 million in loans has been deployed. trained with advanced agronomy Through co-investments with The Starbucks Global Farmer Fund techniques.5 Starbucks suppliers, we opened an was created to improve supply chain Starbucks operates Farmer Support additional five childcare centers resiliency and ensure a long-term Centers in coffee-producing in Guatemala for the 2021-2022 supply of coffee by addressing the countries around the world and harvest season bringing the total unmet business financing needs of in FY21 opened our tenth Farmer operating in this harvest to ten. The farmers. Too often, farmers cannot Support Center. These centers centers provide safe spaces for local turn to traditional banks for business provided free direct-to-farmer and migrant workers’ children to lending because of high interest training along with training to continue their education during the rates. The loans provided through technical experts in a train- coffee harvest season. the fund allow farmers to plant new the-trainer model to more than trees, improve their infrastructure 30,000 people globally. In 2020, and build financial resiliency in the we achieved our goal of training face of shifts in climate and markets. 200,000 people with the latest In FY21, Starbucks committed findings of Starbucks agronomists $ an additional 50 million dollars including advances like new varietals to double the fund. Since FY18, of disease-resistant coffee trees Carlos Mario Rodriguez, director and global head of coffee research $ and advanced soil management Starbucks has deployed 54.8 million and development, was part of the very first Farmer Support Center to coffee businesses and farmers techniques. agronomy team. He drove his pickup truck over countless miles through loans. of narrow roads to visit farmers and help them with a range of sustainability issues and ensure a long-term supply of quality coffee. Carlos helped farmers set up their own test plots, showed them how to space trees correctly and offered suggestions to manage erosion and reduce the use of pesticides. “I think it’s very important for customers to know how difficult it is to produce high-quality coffee,” he said. “It’s critical that we support the farmers.” For Carlos, Starbucks progress in supporting farming communities is best measured one farm, one farmer at a time. “To me, as a professional, as a partner, it’s the best part really when you start working with a particular farmer and see that they are improving their living conditions and being able to keep producing coffee as a 5 good business,” he said. “That’s the best. It’s really something that The geographic scope of this data point includes all company- owned and operated markets globally. motivates us.”
People 021 REPORT 2 T 2 02 INCLUSION OR 1 R EP E 1 R PO 20 TR We believe it is our responsibility to advance 2T 02 racial and social equity, and we are committed RO 12 PER PER to furthering that work with intention, 12 02 T RO transparency and accountability.
People INCLUSION Racial & Social Equity Goals & Representation At Starbucks, we are on a journey to advance racial and social equity for our partners, our community and our society. Our work to advance inclusion, diversity and equity has already led to important policies, programs and initiatives. We are building on the work in our prior Civil Rights Assessments, conducted by Covington & Burling, including the recommendation to hire a chief inclusion & diversity officer and to set and meet representation goals for Black, 6 Indigenous and People of Color (BIPOC) partners and women partners across the company. Starbucks continues its efforts to achieve 2025 representation goals, including achieving at least 30% BIPOC representation at all corporate levels and at least 40% in all retail and manufacturing roles. We also aim to achieve 55% women in all retail roles, 50% women in corporate roles and 30% women in manufacturing roles by 2025. We are working to ensure that our partners represent the communities they are part of and serve. Use our interactive tool to view additional demographic data of Starbucks partners. FY21 Results: Diversity in Retail Stores FY21 Results: Diversity in Corporate Roles FY21 Results: Diversity in Manufacturing Roles Goal: Our partner base will include 40% BIPOC partners and at Goal: We aim to achieve at least 30% BIPOC representation and Goal: We will achieve 40% BIPOC representation and 30% least 55% women partners in all retail roles in the U.S. by 2025. 50% representation of women for all enterprise roles by 2025. representation of women for manufacturing roles in the U.S. by 2025. ROLE BIPOC WOMEN ROLE BIPOC WOMEN ROLE BIPOC WOMEN Regional Vice President 20% 65% Senior Vice President+ 22% 59% Director 13% 13% Regional Director 30% 52% Vice President 32% 49% Manager 24% 28% District Manager 32% 60% Director 29% 56% Individual Contributor 49% 34% Store Manager 37% 69% Manager 30% 54% Shift Supervisor 45% 70% Individual Contributor 38% 54% Barista 50% 73% Board Diversity FY21 Results: Our Board of Directors has 55% BIPOC representation (6 out of 11 members) and 36% representation of women (4 out of 11 members). In FY21, Starbucks announced that Mellody Hobson would build on her experience since joining the Starbucks board of directors in 2005 by serving as the company’s non-executive chair. At the time of this groundbreaking announcement, only 15 companies where the director is not also the CEO among the S&P 500 had a female chair, and none of the women represented identified as Black. Starbucks joined the Board Diversity Action Alliance to act alongside peer companies as part of our commitment to representation of racially and ethnically diverse directors on Starbucks corporate boards of directors. The Board Diversity Action Alliance works to increase the representation of racially and ethnically diverse directors on corporate boards of directors, beginning with Black directors. Our full disclosure is in the 6Demographic percentages represented in this section have been rounded. 2022 Proxy Statement on page 26.
People INCLUSION Global Equity in Pay Civil Rights Assessment FY21 Results: Starbucks has achieved and maintained 100% pay equity for FY21 Results: Starbucks published women and men and people of all races performing similar work in the its third annual Civil Rights U.S. and achieved and maintained gender equity in pay in global company- Assessment. 7 operated markets Canada and Great Britain. Since 2019, Starbucks has Since announcing in 2018 that Starbucks had achieved 100 percent pay equity commissioned an annual, objective for women and men and people of all races performing similar work in the assessment of our company’s United States, we have committed to maintaining that standard annually commitment to civil rights. In FY21, and reaching 100% gender pay equity for all partners in Starbucks company- we published our third Civil Rights operated markets globally. Assessment. This assessment, In FY21, Starbucks once again maintained 100% pay equity for women and conducted by Covington & Burling men and people of all races performing similar work in the U.S. As of the end LLP under the leadership of former of FY21, median pay ratio in the U.S. was 100% for women and BIPOC partners. U.S. Attorney General Eric Holder, Jr., addresses our progress over time Globally, in FY21 the median pay for women was 100% of the median for and provides recommendations men. We once again maintained gender equity in pay in company-operated for how we can better advance markets Canada and Great Britain. inclusion, diversity and equity on In FY20, our licensed partners in Singapore, the Philippines and India achieved behalf of our partners, customers 100% pay equity for women and men. In FY21, eight additional markets in and communities. To promote Asia-Pacific and the Hong Kong Support Center achieved 100% gender pay transparency, we publish these equity, and we continue to work with licensed partners to prioritize gender assessments online. pay equity in all markets. We continue to leverage our experience in achieving gender equity in pay in the U.S. and other markets by sharing our pay-equity principles — equal footing, transparency and accountability — with other employers to help address known, systemic barriers to global pay equity. Starbucks Inclusion & Diversity Mentorship Program We continue to be intentional in cultivating a culture of inclusion, with a focus on partner retention and development by launching a mentorship program. Beginning with our BIPOC partners, the program is designed to connect partners to senior leaders with the goal of creating continuous learning opportunities for the mentor and the mentee. In FY22, the first cohort of participants graduated, and survey results show that 100% of program participants “feel a sense of belonging at Starbucks since the launch of the program.” All mentors and mentees surveyed agreed that they achieved a deeper understanding of partners’ experience with inclusion and diversity. 7 Our goal is to reach 100% pay equity in all global company-owned and operated markets.
People INCLUSION Supporting LGBTQ+ Partners Before joining Starbucks as a store manager in Southern California, FY21 Results: Starbucks scored 100% on the Human Rights Campaign Joe spent 15 years in the restaurant business, eight of them as a Corporate Equality Index. chef. When COVID-19 became a pandemic and everyone started For more than three decades, Starbucks has been committed to building wearing masks, Joe realized he was suddenly deprived of his primary a culture where everyone is welcome. We stand as an ally to the lesbian, communication tool: reading lips. gay, bisexual, transgender and queer community – affirming every way Joe, 28, was born in Guam, unable to fully hear sounds — especially people may choose to identify. In FY21, Starbucks received a 100% score on whispers or anything said behind him. Doctors eventually diagnosed the Human Rights Campaign Corporate Equality Index based on corporate him with otosclerosis, a condition caused by the abnormal growth of the policies and practices for LGBTQ equality for the 11th year. Starbucks also $ tiny bones inside the ears that commonly contributes to hearing loss. donated 50,000 to the Lavender Rights Project to support providing low- cost legal services for transgender and queer low-income people and other “Growing up, I was classified as Deaf,” Joe says. “I was very ashamed $ marginalized communities in Washington state and 50,000 to the National of my hearing. I was embarrassed. I thought if people found out, they Center for Transgender Equality to increase understanding and acceptance of wouldn’t want to be my friend, wouldn’t want to talk to me, wouldn’t trans people across the United States. want to hire me. So I taught myself how to read lips, read the room. I taught myself things to be and feel normal. I wore hearing aids as a little kid, but after a while I would take them off when I got to school... I saw how other kids would act toward kids with disabilities.” Recently, his twin girls — with the help of his wife and father-in-law — gifted him with a new pair of hearing aids. They were an unexpected blessing. They also gave him the confidence to seek out community and a career outside his comfort zone, which led him to Starbucks. “I started to embrace my Deafness and decided I want to learn more about it and inspire other people with Deafness,” Joe says. “Who knows, maybe there’s a handful of partners out there who are afraid or embarrassed to share. I want to let them know it’s all right. We’re all just people at the end of the day.”
People INCLUSION Disability Inclusion Inclusive & Accessible Design Starbucks Signing Stores FY21 Results: Starbucks received FY21 Results: Began offering FY21 Results: Operating 11 Signing 9 100% score on the Disability free Aira service, which provides Stores globally. Equality Index. visual interpreter service for blind Signing Starbucks stores are led by Starbucks is committed to and low-vision customers and store partners who are proficient enhancing accessibility of the introduced new large-print Braille in sign language, whether they are Starbucks Experience for partners menus in all stores in the U.S. and hearing, hard of hearing or Deaf. 8 and customers. We are proud to be Canada. Starbucks operates 11 signing stores recognized for our inclusion policies Starting from the early stages of globally that provide a space for the and practices related to people with design, we strive to create accessible Deaf and hard of hearing community disabilities. In 2015, 2016, 2017, environments in our stores by to connect through sign language 2019 and 2021, Starbucks scored employing universal design principles and celebrate Deaf culture. 100 out of 100 on the Disability and in our digital world through Equality Index and was recognized the Starbucks app and accessible as a “Best Place to Work.” We are a websites. In FY21, we began offering member of Disability:IN’s Inclusion free Aira service, which provides Works program, a national forum for visual interpreter service for blind peer institutions to share best and and low-vision customers and evolving practices on Access and introduced new large-print Braille Disability Inclusion, and have signed menus in all stores in the U.S. and on to Disability:IN’s pledge, Are You Canada. In, committing to advance disability inclusion in the workplace. 8 The geographic scope of this data point includes all company- owned and operated stores in the U.S. and Canada. 9 The geographic scope of this data point includes all company- owned and operated stores globally.
People INCLUSION Refugee Support Veterans and Military Families FY21 Results: Starbucks hired 339 partners who self-identified as refugees FY21 Results: 78 Military Family Stores are now open, and we have hired 10 in the U.S., Canada and EMEA, bringing our cumulative total to 2,959. 7,720 Veterans and military spouses across Starbucks roles in the U.S. Starbucks has a longstanding history of creating opportunity and investing We are dedicated to serving Veterans, military service members and military in the people who are part of the communities we serve. That includes our spouses, whose leadership and sacrifice inspire us each day. Our goal is to commitment to hire refugees across the company, with a goal of hiring hire 5,000 military Veterans and military spouses annually, and in FY21 we 10,000 refugees globally by 2022. In FY21, Starbucks hired 339 refugees have hired more than 7,700 Veterans and military spouses across Starbucks globally, bringing our cumulative total of partners who have self-identified as roles in the U.S. refugees to 2,959. In the U.S., our efforts include a focus on hiring interpreters, Starbucks Military Family Stores have become a hub for active service personnel and their families who served alongside U.S. troops overseas to members, Veterans, families and communities all over the country. Because champion their talent, experience and resilience. Since announcing our military families often live far from family and friends, Military Family Stores commitment, we have built partnerships with organizations around the world are located near major military bases to serve as a place of connection and like International Rescue Committee, LIRS and Upwardly Global. Additionally, support. Each store also works with Veterans Service Organizations to help in FY21, Starbucks joined coalition efforts dedicated to welcoming Afghan connect local Veterans and their families to services and resources. By the refugees in the U.S. such as Mobilizing America for Refugees Fund and end of FY21, Starbucks 78 Military Family Stores were open across the United Welcome.US. States, with the goal to open 132 Military Family Stores by the end of 2022. The Starbucks Foundation, a 501(c)(3) charitable organization with a mission Starbucks is also dedicated to teaming up with service organizations that help to strengthen humanity by transforming lives across the world, awarded Veterans transition to civilian life, develop as leaders and leverage their skills $ more than 350,000 in grants to No One Left Behind, International Rescue and passion to positively change communities. Committee Seattle, ACCES Employment and Refugee Council U.K. - nonprofit organizations supporting the resettlement of Afghans in the United States, • Starbucks has partnered with Team RWB since 2017 to support their Canada and the United Kingdom in FY21. work in building a sense of belonging, camaraderie and inclusiveness for hundreds of thousands of Veterans. • Headstrong helps Veterans and their families heal the hidden wounds of war with confidential, free and effective mental health treatment. With an investment of $ 150,000, Starbucks catalyzed the Headstrong clinical counseling network in the Pacific Northwest. 10 The geographic scope of this data point includes globally company- owned and operated markets and licensed markets in EMEA.
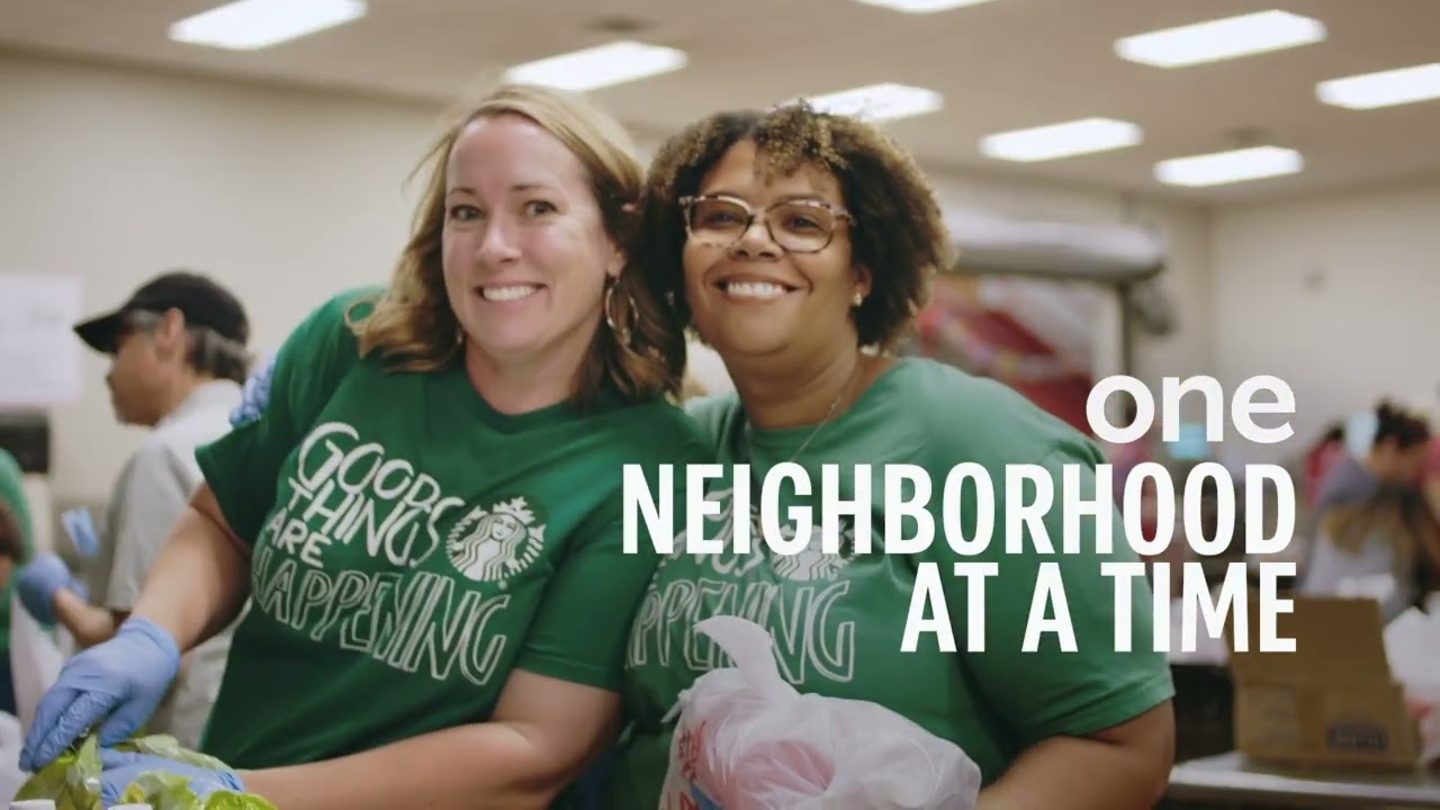
People COMMUNITY We recognize a responsibility to strengthen the REP communities where we live, work and grow. 021 ORT 2 Starbucks impact in communities is most T 2 02 meaningful when our efforts begin with our OR 1 R EP E partners, who know their neighbors best. 1 R PO 20 TR 2T 02 RO 12 PER PER 120 2 TR O
People COMMUNITY Community Stores Hunger Relief FY21 Results: Starbucks dedicated FY21 Results: FoodShare food donation program is available at 100% of its 21st company operated stores in the U.S. and Canada. In FY21, 10.4 million meals Community Store in the th were donated in the U.S. and 1.2 million meals were donated in Canada.11 U.S., and its 13 Community Store in Asia. Since 2016, Starbucks has been committed to the fight against hunger Starbucks Community Stores are through its innovative FoodShare food donation program in partnership ® dedicated to providing economic with Feeding America , Second Harvest Canada and other hunger-relief opportunity in rural and urban organizations. In FY21, FoodShare was scaled to 100% of company-operated communities across the U.S. These stores in the U.S. and Canada, resulting in 10.4 million meals donated and stores are focused on hiring locally, 12 13.8 million pounds of food diverted from waste streams in the U.S., and 1.2 creating dedicated space for million meals donated and 1.4 million pounds of food diverted from waste communities to come together for streams in Canada. Since FoodShare was launched in U.S. in 2016, 39.4 million events, featuring local artists and meals have been donated while we have diverted 47.3 million pounds of food working with diverse contractors from waste streams. FoodShare in Canada launched in 2019, and through the for store construction and remodels. end of FY21, 3 million meals have been donated, along with 3.3 million pounds In FY21, Starbucks dedicated its 21st of food diverted from waste streams. Starbucks hunger relief programs also “When you’re on the receiving end, every bit counts,” Community Store in the U.S. and the expanded to international markets, including the United Kingdom, Japan and th Mexico. 13 Community Store in Asia on the says Antonio Flores Sanchez. journey to opening 100 Community Since 2016, Starbucks has invested $ Stores by the end of 2025. 45 million into hunger relief efforts in It’s 10:30 p.m. on a recent Tuesday night, and the cars are still stop- $ the U.S., and in FY21 made a commitment to reinvest 100 million by 2030. and-go in the drive-thru line at the Starbucks Community Store in Additionally, in FY21, we announced a new $ 1.7 million donation to Feeding Watts. Inside, Antonio, the store manager, is checking his inventory of America to advance equitable access to nutritious food, building on $ 2.69 perishable food. Sandwiches, salads, pastries, wraps. Various protein million invested in food bank mobile pantry programs since 2019. The equitable food access grants were distributed to 16 local Feeding America boxes filled with vegetables, eggs, cheese and chicken. He rifles member food banks located near Starbucks Community Stores. The grants through them all, filling an orange tote with unsold products. are designed to help food banks provide nutritious food to households with He walks the box to a refrigerator in the back and putting it inside. individuals who are BIPOC and residing in communities experiencing high On Wednesday, a delivery truck will stop at one of the Los Angeles rates of food insecurity. Regional Food Bank’s warehouses, a 90,000-square foot storage and distribution center that processes four million pounds of food donations every week. Starbucks uses an innovative backhaul model, which means the same drivers who drop off the supplies at each Starbucks store also pick up the donation boxes, unlocking efficiencies and possibilities that didn’t exist before. Nearly 700 smaller, local agencies work with the Los Angeles Regional Food Bank to get food free of charge for their own programs, whether it’s a larger sub-angency or a kids’ backpack program or a senior- citizen home delivery service. Starbucks helps support mobile food banks and refrigerated vans to ensure that fresh food is delivered 11 The geographic scope of this data point includes all company-owned and operated safely and on time. It’s a story that happens thousands of times over, stores in the U.S. and Canada. at every company-operated Starbucks in the United States. 12 According to the USDA, 1.2 pounds of food is the equivalent to one meal.
People COMMUNITY Community Resilience Fund Supplier Diversity and $ Inclusion FY21 Results: Starbucks committed to invest 100 million in a Community $ $ Resilience Fund; Starbucks deployed 10 million into Chicago Community FY21 Results: Nearly 800 million Development Financial Institutions (CDFIs) to support small businesses. 13 14 spent with Tier 1 diverse suppliers. Too often, entrepreneurs of color can’t thrive because they don’t get the The Starbucks Supplier Diversity and capital and support they need to succeed. In FY21, Starbucks executed its Inclusion program drives inclusion of FY20 commitment to partner with CDFIs to invest $ 10 million in small- qualified businesses with a focus on business development loans for Chicago’s underserved communities. suppliers of all sizes and categories. $ Building on this initiative, Starbucks committed to invest 100 million in In FY21, Starbucks spent nearly the Starbucks Community Resilience Fund. The Fund aims to advance racial $ 800 million with diverse suppliers, equity and environmental resilience by supporting small business growth and supporting more than 6,400 jobs community development projects in BIPOC communities with historically $ and contributing to 1.2 billion in total limited access to capital with a goal to have the total fund invested by 2025. direct, indirect and induced economic The investments will initially focus on 12 U.S. metropolitan areas and impact nationwide. Starbucks has $ their surrounding regions: Atlanta, Detroit, Houston, Los Angeles, Miami, spent more than 8 billion with Tier 1 Minneapolis, New Orleans, New York City, Philadelphia, San Francisco diverse suppliers since 2000. Bay Area, Seattle and Washington, D.C. In partnership with community leaders, CDFIs and other impact-focused financial institutions, the Fund will help provide access to capital intended to support small businesses and neighborhood projects, including those addressing the inequitable impacts of climate change. 13 Tier 1 refers to those suppliers from whom Starbucks directly purchases a given product. 14 The geographic scope of this data point includes all company-owned and operated stores in the U.S. and Canada.
People COMMUNITY Civic Engagement Resources Outreach Worker Program FY21 Results: In FY21, nearly 85,000 people – including customers and FY21 Results: Outreach workers partners – accessed voter registration and election information (via Fuel across six cities connected with Our Democracy) while more than 12,500 partners used civic education over 6,000 customers, helping to resources (via Starbucks Partners Vote). enroll more than 1,600 people in As part of Starbucks commitment to civic engagement, we continued to stabilizing programs. provide tools and resources for partners to ensure their voice is heard in each The Outreach Worker pilot program and every election. We provide partners with voter education and resources launched in FY20 in service to to make a plan to vote and support conversations between managers and support partners in high-complexity partners to ensure partners don’t have to choose between work and voting. stores by connecting them with In July 2021, Starbucks joined the Business for Voting Rights Coalition in hyperlocal street outreach and calling on Congress to update the Voting Rights Act, to help ensure protection social workers that have expertise in of the right to vote for all. connecting individuals to stabilizing programs and resources. The program initially launched in partnership with Community Champions United Way Worldwide and has since FY21 Results: More than 18,000 partners globally engaged as Community and partnered with local nonprofit Champions, participating in over 2,900 community events and donating organizations that specialize in street more than 45,000 volunteer hours to local nonprofit organizations.15 outreach and connect in individuals experiencing homelessness, mental Our vision is to empower every partner to be a Community Champion, and health and substance abuse to we provide the resources, tools and recognition for the many ways partners existing city-specific resources. can make a positive impact in the community. For some partners, being a During FY21, Starbucks scaled the Community Champion may mean donating unused food nightly as part of program to New York City, in addition their store’s FoodShare program. F or other partners it may include planning to continuing operations in its initial and participating in community service events, hosting donation drives in pilot cities (Philadelphia, Washington store, nominating community nonprofits for Neighborhood Grants, donating D.C., Seattle, Los Angeles and to nonprofit organizations or inspiring others to become Community Chicago). $ Champions. Starbucks matches up to 1,000 annually for both full-time and part-time partners’ eligible contributions to nonprofits, including a dollar- for-dollar match on financial donations and, with recent improvements in the program, a match for every hour of volunteer time donated to an eligible nonprofit organization . In support and recognition of U.S. and Canada Starbucks Partners’ Community Champion efforts, Starbucks donated over $ 1 million to more than 2,000 nonprofit organizations. 15 The geographic scope of this data point includes company-owned and operated markets in the U.S. and Canada, and licensed operations in the Bahamas, Indonesia, and Mexico.
People 021 REPORT 2 T 2 02 OR 1 R EP E 1 R PO 20 TR 2 T 02 RO 12 NAVIGATING A GLOBAL PANDEMIC PE R PE R 1 2 0 2 T R O Throughout the COVID-19 pandemic, Starbucks has remained committed to three guiding principles: 1 Prioritizing the health and well-being of our partners, 2 Playing a constructive role in supporting health and government officials, and 3 Showing up in positive and responsible ways to serve our community.
People NAVIGATING A GLOBAL PANDEMIC Our partners are the backbone of our business and they have continued to Support for Front-Line show up for their communities in the face of extraordinary circumstances. Responders Since the start of the COVID-19 pandemic and through FY21, we provided benefits to support our partners that included service pay, catastrophe pay, FY21 Results: Starbucks provided benefits continuation, expanded mental health support, expanded backup 1 million cups of coffee to first childcare support and food and beverage allowances. Additionally, we have and frontline responders through continued to strongly encourage all partners to get fully vaccinated and a partnership with Operation boosted against COVID-19, providing up to two hours of paid time off for Gratitude. partners to receive the vaccine, up to three doses, as well as up to 4 hours of Starbucks has served more than paid time off if partners experience vaccine-related side effects and miss a one million cups of free coffee scheduled shift within 48 hours of receiving the COVID-19 vaccine or booster. to first responders and front- We also created online tools for partners - along with their friends and family line responders supporting the - to create a vaccine plan and easily access state-specific information about healthcare industry. We continue to vaccine availability. And because our partners are known for giving back, we applaud and support our front-line continue to share volunteer opportunities for partners who want to support responder communities through safe and equitable vaccine access in their communities. donations to local organizations. A key part of our COVID-19 action plan is to stay informed and communicative about recommendations from national, state and local health authorities. Since the onset of COVID-19, Starbucks aligned with national, state and local health recommendations to ensure our business decisions are anchored to and guided by facts and science. In addition, Starbucks believes In January, Starbucks and other companies joined Washington State that businesses have a role and a responsibility to support our communities Governor Inslee and Challenge Seattle in a first-of-its-kind public- with safe and equitable vaccine access. In FY21, Starbucks shared educational private partnership (the COVID-19 Vaccine Action Command and information and resources about the COVID-19 vaccine and supported our Coordination System (VACCS) Center), to help optimize accelerated, safe communities in equitable vaccine access and distribution. and equitable access to the COVID-19 vaccines across Washington State. • Starbucks hosted scientists from • I n coffee and tea growing Utilizing the company’s Tryer Center Innovation Lab, Starbucks the Fred Hutchinson Cancer communities, The Starbucks contributed expertise in operational efficiency, scalable modeling and Research Center for virtual Foundation continued to human-centered design to Washington State’s vaccine distribution conversations with thousands of support urgent needs related to efforts. The Starbucks team used this work to inform three different partners to discuss the current COVID-19 of vulnerable families models: vaccination clinics, drive-through clinics and mobile pop- state of COVID-19 and facilitate in Brazil, Colombia, Costa Rica, ups to go to people in more rural or underserved areas. Starbucks, answers to partner questions Ethiopia, Guatemala, India, in partnership with Challenge Seattle and VACCS, also released a on vaccine effectiveness, virus Indonesia and Kenya. Working Playbook of best practices from this partnership, so that other states variants and antibodies and with nonprofit organizations and government leaders may leverage the findings and efficiencies for addressing fears about vaccines. such as Mercy Corps and Bean other mass vaccination sites across the country. • Starbucks and other companies Voyage, these efforts addressed joined a first-of-its-kind food insecurity, expanded access This partnership helped Washington State successfully accelerate public-private partnership, the to clean water and promoted vaccine distribution to meet Washington State’s 45,000 vaccinations Washington State Vaccine Action resilience building. per day goal. Command and Coordination • St arbucks and The Starbucks Systems (VACCS) Center, to help Foundation together contributed optimize accelerated, safe and $ nearly 500,000 to innovative equitable access to the COVID-19 programs designed to increase vaccine across Washington. equitable vaccine access.
People 021 REPORT 2 T 2 02 OR 1 R EP E 1 R PO 20 TR 2T 02 RO 12 PER PER THE STARBUCKS FOUNDATION 12 02 T RO The Starbucks Foundation is a U.S. 501(c)(3) charitable organization with a mission to strengthen humanity by transforming lives across the world. It is focused on enabling community resiliency and prosperity, and uplifting communities affected by disaster. In FY21, the Foundation provided more than $ 23 million in grants to nonprofit organizations across the U.S. and around the world.
People THE STARBUCKS FOUNDATION Origin Grants for Women & Girls $ FY21 Results: 15 unique grants totaling 5 million awarded in support of 16 women and girls in Origin communities. Since International Women’s Day 2018, the Foundation has been working toward a goal to empower 250,000 women and girls in coffee, tea and cocoa growing communities by 2025. Women play key roles for their households, farms and communities, and women are often most disproportionately impacted by evolving challenges, such as the climate crisis. We believe that investing in women and girls in coffee, tea and cocoa-growing regions significantly impacts both families and broader communities. The Starbucks Foundation’s Origin Grants help these communities continue to break down barriers to education, promote clean water, sanitation and hygiene (WASH) and create economic opportunities for women and girls. Through FY21, this effort has made a difference in the lives of more than 125,000 women in coffee- and tea- For Frank, a barista in Texas, volunteering is a way of paying it forward. growing front-line communities across Africa, Asia and Latin America. “When good things started happening to me, I felt I Neighborhood Grants needed to find something to give back to.” $ FY21 Results: 2 million awarded to more than 1,300 local nonprofits 17 Frank, 49, has been volunteering for Resource Center in Dallas for more nominated by Starbucks partners. than 20 years. As a young gay man, he first sought out Resource Center’s The Starbucks Foundation’s Neighborhood Grants are investments in nonprofit HIV education and prevention services when he moved to Dallas. It’s organizations – nominated by Starbucks partners – to help build sustained now one of the largest LGBTQ+ community centers in the country. local impact and inspire increased partner volunteerism in our communities. Frank volunteers at the center in a number of ways, but his heart lies Since 2019, more than 15,000 Starbucks partners have participated, resulting with the food service program. For the last decade, he’s organized in Neighborhood Grants to more than 3,000 organizations across the U.S. and $ Canada totaling more than 5 million. a Thanksgiving meal that has grown to serving over 400 people. In November 2020, the event was cancelled due to the pandemic. But his longtime volunteers still wanted to contribute. Frank also had help from his Starbucks partners. “It wasn’t what we normally did, but it was the next best thing to do. And to see my fellow partners come out to represent Starbucks…They knew it wasn’t going to be glamorous. It was going to be cold. It was going to be outside. They did it with grace and smiles.” Frank’s enthusiasm for Resource Center prompted his manager to nominate it for a Neighborhood Grant from The Starbucks Foundation. These grants are awarded to community nonprofits, all nominated by partners. 16 The geographic scope of this data point includes all company-owned and operated markets globally. “I’m hoping I can bring my experience with philanthropy and 17 The geographic scope of this data point includes all company-owned and operated community outreach to do more under the Starbucks umbrella.” stores in the U.S. and Canada.
People THE STARBUCKS FOUNDATION Youth Equity Grants International Grants Disaster Response $ $ FY21 Results: More than 4 million FY21 Results: More than 40 grants FY21 Results: Nearly 4 million $ in grants awarded to organizations totaling 8 million awarded to awarded to promote resilience and serving BIPOC youth. impact communities that we serve uplift communities impacted by 18 disaster.18 In 2020, The Starbucks Foundation outside of the United States. committed to invest $ 5 million in The Starbucks Foundation supports Throughout FY21, The Starbucks nonprofits that serve BIPOC youth. communities around the world, Foundation continued to uplift In FY21, The Starbucks Foundation including in close partnership with communities affected by disaster $ finalized its grant recipients: Big our Starbucks partners and business by investing nearly 4 million Brothers Big Sisters of America, partners in local markets. In 2018, in preparedness, response and Boys & Girls Clubs of America, The Starbucks Foundation committed resilience programs around the world, City Year, Covenant House, Junior to invest in social impact programs including to support communities Achievement USA, MENTOR, Public in China and in FY21, achieved the disproportionately impacted by the $ Allies and YWCA USA. These grants milestone of 12 million in grants to increased frequency and intensity will support diversity, equity China nonprofit organizations. For of disasters due to climate change. and inclusion initiatives, youth example, the Foundation provided In addition to national support of mentorship and leadership and life a grant to the China Foundation the American Red Cross and global skills for youth through national- and for Poverty Alleviation to promote support of World Central Kitchen’s local-level programs in communities sustainable livelihoods for farmers chef relief efforts, the Foundation across the United States. As of in Yunnan through vocational provided quick support to impacted January 2022, programs supported training and expansion of economic communities, from Hurricane Eta by the Foundation’s grants have opportunities. In FY21, The Starbucks and the Texas winter storms to the impacted more than 100,000 youth. Foundation also expanded its Miami building collapse and volcano partnership with Planet Water eruption in the Democratic Republic Foundation, engaging Starbucks of Congo. partners as volunteers to provide clean water access and hygiene education programs to communities in seven different countries. 18 The geographic scope of this data point includes all company-owned and operated markets globally.
People FY22 HIGHLIGHTS TO DATE At Starbucks, inclusion and belonging Advancing Equity Inclusive and Accessible Physical Positively Impacting Women and must be everyday realities - on both Diversity Across the Supply Chain and Digital Spaces Girls at Origin sides of the counter, in our Starbucks The Starbucks Supplier Diversity and With the recognition that one in four In FY22, The Starbucks Foundation Support Center, across our supply Inclusion program drives inclusion of American adults has a disability and met its commitment to empower chains and in farming communities qualified businesses with a focus on all people experience changes to 250,000 women and girls in origin around the world. Our work to suppliers of all sizes and categories. their physical or mental health, communities by 2025, ahead of enhance the well-being of all who In FY22, we announced our work Starbucks is working to extend schedule. In service of our ambition connect with Starbucks continues to increase the annual spend with disability inclusion and accessibility. to be people positive, The Starbucks in FY22. $ In FY22, Starbucks committed to Foundation committed to expand its diverse suppliers to 1.5 billion by commitment – seeking to positively 2030. design, test and scale more inclusive impact 1 million women and girls in Partner Investments Reaching More People design standards and experiences coffee-, tea- and cocoa- growing Every decision and every investment At Starbucks, we listen and learn across its store portfolio, with the communities by 2030. we make is to ensure our partners from our partners, our customers goal of ensuring that every physical are supported. To do this, we and our communities. To ensure and digital Starbucks environment Addressing the Root Causes of take bold actions with intention, we’re reaching diverse audiences, will meet a bolder, more accessible Chronic Homelessness in Seattle transparency and accountability. we committed to allotting 15% of our standard by 2030. Building on the company’s 50- In FY22 we built upon our work to advertising budget with minority- year legacy of work to strengthen increase pay for partners during the owned and targeted media Community Impact and uplift its hometown, in FY22, COVID-19 pandemic by announcing companies. Starbucks announced nearly a half new wage increases: Global Community Impact Grants a million dollars of investments Small Business Support The Starbucks Foundation, in that will take place throughout $ FY22, announced a $ • At least a 10% pay increase for In 2021, Starbucks created a 100 30 million 2022 to advance solutions that baristas, shift supervisors and million Community Resilience investment by 2030 in a new support those experiencing chronic café attendants hired on or Fund that is designed to support Global Community Impact Grants homelessness in the greater Seattle before September 14, 2020. small business growth and portfolio designed to drive locally region. These efforts include • At least an 11% pay increase for community development projects relevant impact in the communities partnering with the We Are In tenured partners with three in BIPOC communities. The initial where Starbucks operates around Coalition to support Partnership for years of continued service. investments are focused on 12 U.S. the world. To scale the initiative, Zero, led by the King County Regional metropolitan areas and surrounding The Starbucks Foundation invited Homelessness Authority (KCRHA), • A continued investment in shift regions: Atlanta, Detroit, Houston, partner companies (licensees) which expanding support for nonprofits supervisor pay to recognize Los Angeles, Miami, Minneapolis, operate the Starbucks brand across providing dignified access to basic this critical leadership role and New Orleans, New York City, its three international regions – Asia needs including bathrooms, showers attract the best talent. Philadelphia, San Francisco Bay Area, Pacific; Europe, Middle East & Africa; and laundry services for individuals • At least a 5% increase to all Seattle and Washington, D.C. As of and Latin America & the Caribbean experiencing chronic homelessness, starting pay rates to support January 2022, Starbucks has issued – to nominate local nonprofit expanding its commitments to the $ organizations for grants. These grants store managers in continuing to 21 million in funding to seven CDFIs chronically homeless population attract and retain new talent. through the Starbucks Community are intended to fund programs by supporting Plymouth Housing Resilience Fund. that create meaningful local or and extending its investment regional impact and expands on the in Northwest Harvest as part of company’s people positive ambition its FoodShare program. to enhance the well-being of all who connect with Starbucks.
Planet Starbucks is committed to being resource positive — giving back more than we take from the planet. Over the course of our 50 years, with the help of our partners, we have looked for ways to help protect our planet consistent with the belief that we can build a great business that scales for good — driving innovation, ensuring a sustainable future for coffee and caring for people. We have set a bold commitment to reduce our carbon, water and waste footprints in half by 2030, and we continue to work to ensure that our 2030 targets remain ambitious as science and measurement capabilities evolve.
Planet 2030 GOALS & PROGRESS Our aspiration to become resource-positive means we will give more than we take from the planet: storing more carbon than we emit, R E P O providing more clean freshwater than we use 021 RT 2 and eliminating waste. T 2 02 OR 1 R EP E 1 R PO 20 TR 2T 02 RO 12 PER PER 1202TRO
Planet 2030 GOALS & PROGRESS 2030 Planet Goals Carbon Water Waste 50% absolute reduction in scope 1, 50% of water withdrawals will be 50% reduction in waste sent to 2 and 3 greenhouse (GHG) emissions conserved or replenished across landfill from stores (including representing all of Starbucks direct Starbucks direct operations, stores, packaging that leaves stores) operations and value chain. packaging and agricultural supply and direct operations, driven by chain, prioritizing action in high- a broader shift toward a circular risk water basins while supporting economy. watershed health, ecosystem resilience and water equity. CO 2 We are governing our sustainability commitments through our Global “Starbucks sustainability journey has been driven Environmental Council, which is comprised of senior leaders across Starbucks by bold aspirations and a comprehensive approach. whose compensation is tied to performance against our goals. We also formally review and seek counsel from our Board of Directors Nominating Today, our goal is to become resource-positive, and Corporate Governance Committee, along with informal advisors who are storing more carbon than we emit, replenishing more experts and influencers in the sustainability sector. We can only achieve this ambition by working together with, and receiving freshwater than we use and eliminating waste. We set feedback from, our stakeholders — partners, suppliers, non-profit targets to cut our carbon, water and waste footprints organizations, industry partners, government, farmers and customers are all in half by 2030.” part of our journey to store more carbon than we emit, eliminate waste and replenish more freshwater than we use. In FY21, rooted in science, grounded in Starbucks Mission and Values and Michael Kobori, chief sustainability officer informed by comprehensive market research and trials, Starbucks finalized 2030 environmental goals to cut our carbon, water and waste footprints by half, working from a FY19 baseline.
2030 GOALS & PROGRESS Planet Since that time, Starbucks carbon goal has been validated as science-based from the Science Based Targets Initiative (“SBTi”). The SBTi has confirmed that the scope 1 and scope 2 portions of our 2030 carbon target are aligned with a 1.5°C pathway, the most ambitious level they validate. In FY20, we joined the newly established Transform to Net Zero (TONZ) initiative as a founding member. Comprised of nine founding members, the Initiative’s objective is to accelerate the transition to a net zero global economy no later than 2050 by developing and delivering research, guidance and roadmaps to guide businesses in achieving net zero emissions. Starbucks also expanded its goal to conserve or replenish 50% of water used in green coffee production in our direct operations to include global operations, agricultural supply chain and packaging, increasing the projected water conserved or replenished and addressing some of the biggest impacts on Starbucks water footprint. To achieve this, we will focus on expanding water conservation and replenishment efforts to include agricultural supply chains, global operations and packaging; catalyzing holistic watershed health improvements in highest risk basins; and by promoting equity and resiliency for communities through WASH. Starbucks endorsed the United Nations’ Water Resilience Coalition (WRC) to help preserve freshwater resources globally. Coalition members commit to collective action in water-stressed basins, to develop and implement resilient practices across their industry, and to provide leadership and advocacy in the field of water stewardship. Similar to last year, our progress against our 2030 commitments in FY21 was influenced by external factors, including COVID-19. Compared to FY19, GHG 19 emissions increased one percent and water withdrawals decreased by 11% 20 in FY21 . Starbucks diverted 32% of operational waste and 24% of packaging 21 was reusable, recyclable or compostable in FY21 . We are continuously improving data availability and quality as we improve our environmental impact measurement process. 19 At this stage in our journey toward significant reductions, an increase in GHG emissions is expected. We are identifying, testing and scaling innovative solutions across our global operations and engaging with our value chain while improving our measurement systems. 20 Water withdrawals decreased compared to FY19 because of shifts in agricultural commodities purchased due to changing customer preferences, continued impacts from COVID-19 and improvements to data quality and measurement processes. 21 In FY21, data reporting for waste diversion and packaging was changed to increase accuracy in measurement and better aligned to industry standards. We are reviewing our goal going forward.
Planet 021 REPORT 2 T 2 02 OR 1 R EP E 1 R PO 20 TR 2T 02 STRATEGIES FOR CHANGE RO 12 PER PER 1202TRO To meet our 2030 goals, we have set five key strategies rooted in science, grounded in Starbucks Mission and Values and informed by comprehensive research and trials: • Expand plant-based menu options • Shift away from single use to reusable packaging • I nvest in regenerative agriculture, reforestation, forest conservation and water replenishment in our supply chain • Invest in better ways to manage our waste • I nnovate to develop more sustainable stores, operations, manufacturing and delivery
Planet STRATEGIES FOR CHANGE Greener Stores Framework FY21 Results: 2,779 Greener Stores are certified globally. Announced in 2018, the Greener Stores Framework, co-developed with World Wildlife Fund, is designed to accelerate the transformation of retail towards lower-impact stores that achieve reductions in carbon emissions, water usage and landfill waste. With performance-based standards that incorporate design and extend throughout the life of a store, Starbucks Greener Stores in North America have reduced energy consumption by 30% compared with the company’s prior store designs. Additionally, state-of- the-art technologies treat and conserve water, reducing annual water use by more than 30%, saving more than 1.3 billion gallons of water annually. Meanwhile, 90% of company operated stores have adopted waste diversion and circular practices, including recycling, composting, Grounds for Your Garden and Starbucks FoodShare. In FY21, 2,779 Starbucks stores were certified Greener Stores and we Susan, a partner in Shanghai, is excited to be part of the first Greener expanded the framework to international markets, opening the first Greener Store outside of North America. “I feel very lucky to be store manager Store outside of North America in Shanghai with a focus on circularity. The at this very important store. As the first store in China to be certified Shanghai Greener Store has been designed and built to reduce waste, under the ‘Starbucks Greener Store’ standard, this store sets new repurpose goods and serve as a platform for future innovation. In FY22, benchmarks for green retail,” Susan says. Starbucks will continue the international expansion of this program with The Shanghai Greener Store is unique in that it will focus on Greener Stores opening in Japan, the U.K. and Chile. We aim to build and circularity, which means it was designed and built to reduce waste operate 10,000 Greener Stores globally by 2025. and repurpose goods. “[Greener Stores] lead sustainability solutions in store design, construction and operations, with [our Shanghai store] focusing on waste reduction. With the opening of this store, we invite customers and communities to adopt greener lifestyles,” Susan says. The store is designed to bring eco-friendly practices to life for customers. From using wood reclaimed from renovations at other Starbucks stores, to Starbucks green aprons made from recycled cups, to a Circular Lifestyle Lab that showcases sustainability-themed exhibitions featuring emerging young artists and advocates, the store promises to be an immersive learning experience for all. “Protecting the planet is everyone’s responsibility. We are all in this together for a better future. I would like to invite everyone to the store, joining us [in a] greener lifestyle,” Susan says.
STRATEGIES FOR CHANGE Planet Renewable Energy Plant-Based Menu FY21 Results: Renewable energy powered 66% of company-operated FY21 Results: Continued to expand plant-based menu items for customers. facilities globally. Expanding Starbucks plant-based menu items globally is one of the ways we are Worldwide, Starbucks purchases enough renewable electricity to power pursuing our plant positive aspirations. Our aim is to provide our customers a 100% of our company-operated stores in the U.S., Canada and U.K. In FY21, variety of choices as part of their Starbucks experience. Customers around the renewable energy powered 66% of company-operated facilities globally globe continue to see new additions to their local menus. Starbucks joined forces compared to 72% in FY20, with market constraints in China and Japan with plant-based innovators so that today nearly all stores across our markets challenging our ability to meet the goal of using renewable energy to power offer plant-based food and beverage menu items. 100% of our operations globally. In the Asia Pacific region, Starbucks has introduced plant-based beverage and Expanding our roster of renewable energy projects in the U.S. is a priority for food choices in markets such as Hong Kong, Indonesia, Philippines, New Zealand, Starbucks. In FY21, we continued to use our scale to drive innovation across Singapore, South Korea, Taiwan and Thailand. Customers in Starbucks Caribbean the energy sector and support not only our stores but also the communities markets can now enjoy the Impossible Breakfast Sandwich while those in Chile in which we operate with renewable energy. Starbucks committed to can savor two plant-based paninis made in association with NotCo. Starbucks investing nearly $ customers in the U.K. can enjoy Beyond Meat Breakfast Sandwiches and in 97 million in up to 23 new community solar projects in New York in partnership with Generate Capital, which will supply solar energy January 2021, Starbucks in UAE and Kuwait launched new plant-based food to more than 24,000 households, small businesses, nonprofits, churches, including the Beyond Meat Triple Cheese Wrap and Beyond Meatball Arabian universities and Starbucks stores. Six of these projects went into service FY21, Ciabatta. Starbucks continues to introduce new drinks and food to menus while serving communities that historically do not have access to clean energy. innovating with plant-based ingredients across key platforms like espresso, cold Starbucks also completed the installation of a one-megawatt solar array at brew, refreshment, food and more to meet growing customer demand globally. the Starbucks Carson Valley Roasting Plant and Distribution Center. On-site solar energy will provide nearly a third of the Roasting Plant and Distribution Sustainable Dairy Center’s electricity for the year. $ In FY21, a combined Virtual Power Purchase Agreement (VPPA) and FY21 Results: Invested 10 million in U.S. Dairy Net Zero Initiative. Virtual Storage Agreement (VSA) that Starbucks entered came online and Since Starbucks introduced its first handcrafted coffee beverage, the Caffè Latte, is estimated to provide renewable energy for more than 550 stores in in 1984, cow’s milk has been an integral ingredient for the company. While California with solar energy and utility-scale batteries. And, in Southwestern Starbucks will continue to expand plant-based menu options, dairy remains an Washington, Starbucks supported the development of a new wind project important option for our customers. At the same time, dairy is one of the largest which will provide renewable energy to approximately 140 Starbucks Stores contributors to Starbucks carbon footprint and water withdrawals. To reach our and the company’s Kent Roasting Plant, along with numerous communities in planet positive goals, we must innovate and work with others to source dairy Washington. responsibly and sustainably. As Starbucks advances its renewable energy strategy, the company will use its In FY21, Starbucks joined the U.S. Dairy Net Zero Initiative, a partnership of the scale to drive innovation across the energy sector, applying an environmental U.S. dairy community seeking to enable progress toward the industry’s goals and climate justice lens to new investments in the U.S. and Canada. of achieving greenhouse gas neutrality and improvements in water quality on $ farms. Through a 10 million investment, Starbucks is providing more farmers access to effective environmental and economically viable practices and technologies – from feed production to manure handling, cow care and on-farm energy efficiency. Starbucks also joined the Farm Powered Strategic Alliance as a founding member, repurposing food waste in Starbucks supply chain into renewable energy via farm-based anaerobic digesters. The process produces low carbon fertilizer that host farms use to support regenerative agriculture practices, while Starbucks, in turn, helps contribute to a low carbon economy.
STRATEGIES FOR CHANGE Planet Reducing Single-Use Plastic FY21 Results: Continued employing our innovative test-and-learn approach to reducing single-use plastic. Efforts to reduce single-use plastic, particularly cup waste, are not new to We plan to launch a new cup in the fall of 2022 that will meet our goal to Starbucks. We have offered the option for customers to enjoy their beverage include 20% recycled content in our hot cups. Currently, our hot cups contain in For Here Ware or to BYOC (bring your own cup) for a discount since the 10% recycled content. While we are increasing the amount of recyclable 1980s. In FY21, after removing the option from our stores due to COVID-19, content used to make hot cups, we are also working to develop 100% we proudly reintroduced personal reusable cups and For Here Ware in most compostable and recyclable hot cups by 2022. In FY21 and FY22 to date, 22 markets, though less than 1% of beverages sold were in reusable cups. We seven new markets in the U.S. have joined the list of major markets where continue to conduct consumer and market research to better understand Starbucks hot cups are recyclable. We recognize that some of these efforts how best to incentivize the use of reusables towards our goal to double the may be delayed or change because of operational challenges created by the use of reusable cups from 2016-2022. In FY21, our test-and-learn approach COVID-19 pandemic. However, these shifts will not deter our longer-term included testing a Borrow-A-Cup program in stores in Seattle and Korea, objectives for reusables. which gave customers the option to receive their beverage in a reusable cup 23 and return it at a participating store’s contactless kiosk. International markets We achieved our goal to eliminate plastic straws. This effort does not deter also identified key pathways in support of our 2030 waste reduction target. our commitment to accessibility and our responsibility to provide plastic Starbucks EMEA committed to offering a reusable cup share program in all straws for customers who require them to enjoy their favorite beverage. To EMEA stores by 2025, and Starbucks South Korea committed to eliminating eliminate traditional plastic straws, we first reduced demand, through the single-use cups by 2025. rollout of strawless lids, which we has approximately 9% less plastic than the flat lid and straw historically used for iced beverages. Unlike traditional In addition, finding better ways to manage waste with more sustainable plastic straws, the strawless lids can be recycled in many markets in the U.S. packaging solutions is a priority to achieve our Planet Positive goals. As and Canada. We also introduced alternative material straws mostly made of we continue our work to shift away from single-use materials, Starbucks polylactic acid (PLA) and polyhydroxyalkanoate (PHA). While some PLA and is continuing our work to develop compostable and recyclable hot cups in PHA straws have been available in international markets, PHA straws were collaboration with Closed Loop Partners and the NextGen Consortium. We introduced in the U.S. in 2021. are also taking action to shift away from single-use plastics and champion the circular economy through our participation in the Ellen MacArthur Foundation’s New Plastics Economy Global Commitment. 22 The geographic scope of this data point includes all company-owned and operated stores in the US and licensed operations in Korea. 23 The geographic scope of this data point includes all company-owned and operated markets globally.
STRATEGIES FOR CHANGE Planet Sustainable Future of Coffee Climate-Resistant Coffee Trees FY21 Results: Announced goal to achieve Carbon Neutral Green Coffee FY21 Results: More than 10 million climate-resistant trees were distributed by 2030. globally through Starbucks 100 Million Tree commitment. Coffee farmers rely on a healthy planet to produce high-quality coffee. Starbucks has a goal to provide 100 million coffee trees to farmers by 2025. In FY21, Starbucks announced a new goal to achieve carbon neutral green In FY21, we distributed more than 10 million trees to farmers in Mexico, coffee by 2030. This commitment builds on Starbucks work to source coffee Guatemala and El Salvador. Over the past six years as part of our 10-year, 100 responsibly, for the betterment of people and planet, while we also work million-tree commitment, Starbucks has donated nearly 60 million coffee to empower farmers, improve their livelihoods and positively impact their trees to farmers. These new trees are bred to be resistant to coffee rust, a communities, all with the aspiration of ensuring a sustainable future of coffee. disease associated with climate change, and to help farmers improve the To help achieve this goal, we are focused on on-farm carbon mitigation in our quality and yields of their harvest. In FY21, we announced a partnership with supply chain, leveraging precision agronomy to support better soil health and the Federacion Nacional de Cafeteros de Colombia to distribute 23 million fertilizer management. Working across Starbucks Farmer Support Centers and coffee seedlings to more than 12,000 C.A.F.E. Practices farmers over the next in partnership with suppliers and farmers, we continue to collect soil samples two and a half years with the goal of helping farmers renovate their farms and to better help farmers understand the specific nutrients and fertilizer needed, improving productivity and yields. In the last year, we have distributed more with the intent to reduce green coffee’s carbon footprint while helping than 7 million coffee trees as part of this program. In addition, we have also farmers to be more productive and resilient. To date, we have collected nearly expanded the program with a goal to distribute more than 45 million coffee 23,000 soil samples in Guatemala, Mexico, Peru, Rwanda and Kenya to help trees to C.A.F.E. Practice-verified farmers in Colombia by 2023. inform custom fertilization plans. Water Reduction and Replenishment Forest Conservation & Restoration FY21 Results: Committed to conserve water usage in green coffee FY21 Results: Launched two new projects in Colombia and Peru and processing by 50%; To date, contracted more than 1200 eco-wet mills. protected and restored more than 500 hectares of forests. Traditional coffee processing is water intensive. In FY21, Starbucks announced Land-use change and deforestation are the greatest climate risks facing the a goal to conserve water usage in green coffee processing by 50%. With coffee industry. Early in FY21, Starbucks launched projects with Conservation 200,000 wet mills in Starbucks C.A.F.E. Practice supply chain to separate International in Huila, Colombia, and San Martin, Peru, to not only remove coffee fruit from coffee beans, Starbucks has an opportunity to conserve carbon and support our carbon neutral goals, but to provide freshwater water by ensuring farmers have access to more environmentally friendly ecosystems benefits and improve biodiversity. In FY21, these projects have machines, which also standardizes quality and increases processing efficiency resulted in more than 500 hectares of forest in Peru protected or restored for farmers. with restoration plans underway in Colombia. Over the next five years, we In FY21, Starbucks contracted more than 1,200 eco-mills for coffee farms anticipate these projects to conserve or restore more than 6,000 hectares in Guatemala, Mexico, Peru, Kenya and Rwanda. The result has been up to in 16 farming communities across the countries, benefiting both local 80% water savings in coffee processing where installed. As part of Starbucks communities and reducing Starbucks carbon footprint. The projects are long-term water strategy, we are developing water replenishment projects at also developing carbon measurement and water monitoring protocols, in Origin, with a focus on prioritizing action in high-risk basins while supporting conjunction with local stakeholders. watershed health, ecosystem resilience and water equity.
STRATEGIES FOR CHANGE Planet ASU-Starbucks Center for the Future of People & the Planet FY21 Results: Announced the creation of the ASU-Starbucks Center for the Future of the People and the Planet. Building on our long-standing partnership, in FY21, Starbucks and ASU announced the creation of the ASU-Starbucks Center for the Future of People and the Planet – a new research and rapid innovation facility created to find new ways to design, build and operate Starbucks stores. Composed of a dedicated team of scientists, researchers and support staff, including subject- matter experts from Starbucks and ASU, the center’s objective is to positively impact the future of our planet. In its first year, the Center has focused on food and wellness, innovation test stores, greener stores and community betterment.
Planet Animal Welfare Cage Free Eggs Antibiotics Sow Housing Just as with our coffee, Starbucks goal is for everything we sell to be produced FY21 Results: In the U.S. and Europe, FY21 Results: As of 2018, all poultry FY21 Results: Developed plan under high quality and ethical standards. For the food and dairy we serve, 100% of shelled eggs are certified featured in Starbucks products in to phase out excessive use of this means a commitment to social responsibility standards with animal cage-free. In the U.S., 99.3% of stores in the U.S. is raised without gestation stalls. 24 welfare as a primary focus. We are committed to working with and buying liquid eggs are certified cage-free. the routine use of antibiotics. We In December 2021, Starbucks from farmers and suppliers who share our commitment to humane practices Since Starbucks first began buying work closely with our suppliers to released an updated sow housing throughout an animal’s lifecycle. FY21 has brought a renewed focus on Animal cage-free eggs in 2008, we have continue to ensure they meet this commitment for North America. Welfare, and we have launched an internal Animal Welfare working group and made significant progress, increasing commitment. Starbucks is phasing out the steering committee to continue to improve our commitments. Please view our purchases year-over-year. In Starbucks engaged with our excessive use of gestation stalls for Starbucks Animal Welfare-Friendly practices. FY21, Starbucks received a Good Egg suppliers and set a goal to serve the sows (mother pig) in our supply award from Compassion in World only poultry raised without the chain by 2030. The excessive use Farming’s 2021 Egg Track Report for routine use of medically important of gestation stalls would include the progress we’ve made against our antibiotics in all company-operated stalls where gestating sows do not cage-free egg commitment in the U.S. stores by 2020. In 2018, we have the ability to turn around. U.S. and Europe. In FY21, all of the met that goal two years ahead of This commitment extends to shelled eggs we use in our products schedule. The poultry we serve has all Starbucks branded products, in the U.S. and Europe are certified been raised without the routine use including those supplied to our cage-free, and all of the liquid eggs of antibiotics. licensee business partners in the we use in Europe and 99.3% of the U.S. and Canada. To reach our goal liquid eggs used in the U.S. are of phasing out the excessive use certified cage-free. While there have of gestation stalls, we will specify been great strides in availability of 100% “group-housed” pork as a the cage-free egg supply in the U.S. requirement of our pork suppliers and Europe, there is still work to be in the U.S. and Canada and take done across the industry to increase steps to ensure a “group-housed” supply to address market availability pork supply in 2024. We expect to globally. In Asian company-operated demonstrate meaningful progress markets such as China and Japan, towards this goal in 2023. Group the production of cage-free eggs is housing will significantly reduce a not widespread and supply is not sow’s time in a gestation stall. yet available at scale. Starbucks will continue to engage and consult with industry stakeholders on increasing the available supply in order to achieve our goal for company- operated stores. 24 Our goal is to source 100% cage-free eggs globally. The geographic scope of this data point includes all company-owned and operated markets in the U.S. and Europe.
Planet FY22 HIGHLIGHTS TO DATE Starbucks Journey to Innovative Reusable Cup NextGen Consortium Fueling the Future Sustainable Dairy Programs As a founding member of the In FY22, Starbucks continues As a company that works with and Starbucks continues to test “Borrow- NextGen Consortium, Starbucks has to rapidly expand its roster relies on the farming community A-Cup” or Returnable Cup operating been working to address single-use of renewable energy and every day, it is Starbucks models in the U.S., U.K., Japan and food packaging alongside leading decarbonization projects in the responsibility to help drive solutions Singapore, with more countries food and beverage companies United States, including a new that support both people and in the year ahead. In addition, the globally. In October 2021, Starbucks partnership with Volvo to electrify our planet and that help ensure a company continues to encourage and McDonald’s announced a the driving route from the Colorado $ sustainable future of dairy. In FY22, customers to bring their own cup joint 10 million investment in the Rockies to the Starbucks Support we launched a collaborative effort and emphasize for-here-ware as NextGen Consortium to identify, Center in Seattle. Beginning this with dairy farmers and The Nature the default sit-and-stay experience, accelerate and scale commercially summer, Volvo electric vehicle Conservancy while exploring new customer viable, circular foodservice chargers, powered by ChargePoint, to help refine and scale an approach to sustainable dairy and incentives and technologies, like cup packaging solutions. will be available at up to 15 Starbucks environmental stewardship for the washing stations at café counters. In stores along the route as part of betterment of people, planet and FY22, Starbucks announced that Waste and Recycling App the company’s 2,700 Greener animals. by the end of 2023, customers will Store portfolio. The company be able to use their own personal In FY22, Starbucks launched a new will use these pilots to explore Expanded Greener Stores reusable cup for every Starbucks Partner Waste and Recycling App, how EV charging and emerging visit in the U.S. – including in café, developed by partners as part of the technology will intersect with the Starbucks Greener Stores support drive-thru and mobile order and Greener Stores Innovation Challenge, Starbucks Experience of the future our Planet Positive goals with pay. Our goal, over time, is to give designed to help partners navigate and changing trends in retail. By performance-based standards customers easy access to a personal complex and unique store recycling 2030, Starbucks aspires to lead the that incorporate design and extend or Starbucks provided reusable cup guidelines. The app puts everything retail industry in decarbonization throughout the life of a store. In for every visit making it convenient partners need to know to reduce solutions, including Electric Vehicle December 2021, we opened the to reuse wherever customers are waste and recycle in one place; it charging and onsite solar availability doors to Japan’s first Greener enjoying their Starbucks Experience. features store specific information at stores and in adjacent locations. Store in Tokyo, which will serve and notifications, a sorting guide and Starbucks will continue to expand its as a sustainability hub, informing the option to create store specific solar pilot locations to 55 new stores Starbucks Greener Stores expansion signage for partners and customers. this year. across Japan. Starbucks will continue the international expansion of this program with Greener Stores opening in the U.K. and Chile.
Governance We believe strong corporate governance is the foundation for financial integrity, partner and stakeholder confidence and sustainable performance. We promote ethical leadership and business practices to deliver our very best in all we do, while holding ourselves accountable for results.
Governance Board Oversight on Environmental, Social and Governance Issues Our board is highly engaged in sustainability matters given that our global BOARD environmental and social impact goals are intricately linked to our strategic direction. Our board considers our impact agenda at least annually in connection Responsible for ensuring ESG risks and opportunities are integrated into with the strategic plan. Starbucks long-term strategy. In addition, our Nominating and Corporate Governance Committee is tasked with the responsibility of overseeing the effectiveness of our environmental and NOMINATING AND GOVERNANCE COMMITTEE social responsibility policies, goals and programs, including review of our annual Oversees, reviews and assesses the effectiveness of Starbucks ESG strategies, Global Environmental and Social Impact Report, and make recommendations as policies, practices, goals and programs; annually reviews Starbucks corporate appropriate. political contributions and expenditures to ensure alignment with Starbucks Other board committees are also involved in assessing and managing our policies and values. environmental and social priorities through their oversight responsibilities, including risk management and talent management. COMPENSATION COMMITTEE AUDIT COMMITTEE In addition to board oversight of our environmental and social goals, we regularly engage with informal advisors who are experts and influencers in sustainability. Oversees the development, Oversees certain ESG risks, as part of implementation and effectiveness overall risk management, and also of Starbucks practices, policies and reviews ESG disclosures in SEC filings. strategies relating to human capital management as they relate to Starbucks workforce generally.
Governance Ethics & Compliance FY21 Results: Starbucks was recognized by Ethisphere as one of the World’s Most Ethical Companies for the 14th year. Our Ethics & Compliance program supports our Mission and Values and helps protect our culture by fostering an environment that is committed to ethical leadership and conducting business with integrity. The Ethics and Compliance program makes regular reports to the Board of Director’s Audit Committee including formal sessions several times per year. We provide all Starbucks partners with our Standards of Business Conduct, a framework to guide them in ethical decisions at work. The Standards of Business Conduct is supported by other robust global company policies and training for our partners. Our internal policies cover ethics and human rights issues including Anti-Harassment, Anti-Discrimination, Conflicts of Interest, Gifts & Entertainment, Anti-Bribery and Equal Employment Opportunity. Annually, we conduct training on our SoBC for our partners to recommit to our company values. Partners are empowered to ask for guidance and voice concerns when they experience or see conduct that is inconsistent with our Standards of Business Conduct. Our Ethics & Compliance Helpline and Webline allow partners to ask questions and voice concerns. The Helpline and Webline are available 24 hours a day, seven days week, with interpreters and translations available. We are committed to providing safe, confidential and accessible channels to all individuals connected to Starbucks, while maintaining a strict Anti- Retaliatory Policy in compliance with our Global Human Rights Statement.
Governance Executive Compensation Tied to ESG Performance Stakeholder Engagement In FY21, we incorporated a new set of measurements into our executive Our ESG goals are formulated based on a comprehensive stakeholder review compensation programs focused on sustainability and building inclusive and process which includes materiality review and analysis and identifying diverse teams, which resulted in the increase of the individual performance business critical issues. By actively engaging both internal and external factor (IPF) of the Annual Incentive Bonus Plan from 30% to 50% of the overall stakeholders in this process, we ensured our strategy and goals are targeted payout calculation. Ten percent of the overall bonus payout calculation for to key areas allowing us to have the greatest impact and create positive Starbucks senior vice president and above population is tied to Starbucks outcomes. This process includes direct outreach, public forums and industry planet-positive results which aligns to our vision of giving back more than working groups, and we will continue to leverage these channels on an we take from the planet, as well as ensuring the sustainability of coffee and ongoing basis. other materials which are paramount to our business operations. Another ten At the local level, operations teams, including our regional, district and store percent of the overall bonus payout calculation is tied to creating an inclusive managers are available and often actively engage local stakeholder questions environment where everyone belongs, because the strength, diversity and or concerns. If an issue goes beyond the scope of their responsibilities, they inclusiveness of our workforce drives our success as a global brand. escalate it to the Starbucks Support Center (headquarters). Any issues related to ESG matters referred to the Global Social Impact and Global Public Policy Responsible Tax Policies team for response or further action. As a responsible business, we manage our global tax responsibilities in keeping with our mission and values. Our approach to tax aims to align with Political Expenditures the needs and long-term interests of our various stakeholders - including Starbucks is committed to being actively involved in the communities governments, shareholders, partners and the communities where we operate we serve. This commitment extends to our approach to public policy. We and source products. To achieve this, we work to implement several guiding believe we have a responsibility to advocate policies that support the principles: health of our business, our partners and communities we are part of. In an • We always consider the company’s corporate and social responsibilities, effort to better communicate these activities, Starbucks adopted a policy to brand and reputation when considering tax affairs. provide more transparency about our corporate political contributions and • We aim for our tax affairs to be sustainable and equitable, and we expenditures. We believe this policy serves Starbucks interests in promoting recognize the importance of tax systems in helping governments fund public policies of concern to the company and educating elected and public policies and programs to meet the needs of their communities and officials about our business, while providing important information to our residents. partners, customers and shareholders. Starbucks is committed to conducting business ethically, with integrity and in accordance with the law. Part of that • We engage with all tax authorities in an open, transparent and respectful commitment includes compliance with rules, regulations and standards manner. governing our interaction with the government, including our disclosure and • We support initiatives to improve transparency on tax matters, including accountability regarding political contributions and expenditures. Organisation for Economic Co-operation and Development (OECD) measures on country-by-country reporting and automatic exchange of information. • We comply with the financial and tax related disclosure and transparency requirements of the U.S. Securities and Exchange Commission (“SEC”), as well as other government institutions that require financial and tax reporting in each jurisdiction where we have operations.
Governance Human Rights At Starbucks, we are committed to respecting human rights, as outlined in Our global commitment to fundamental human rights is a core component our Global Human Rights Statement, which was updated in FY20. Throughout of how we engage our partners. Starbucks respects the inherent dignity of all FY21, we continued to embed our updated Global Human Rights Statement people and seeks to enable partners to do their best work by embracing and into our various internal and external stakeholder communication, training valuing the unique combination of talents, experiences and perspectives they and due diligence systems. each bring to our work. We adhere to ILO Core Labor Standards, including the Throughout the year, we continued to work diligently to demonstrate our rights to freedom of association and participation in collective bargaining. While commitment to human rights and human rights due diligence through our we do not believe third-party representation is necessary at Starbucks, we various People Positive initiatives, from ensuring that the coffee we serve respect our partners’ right to organize and we want partners to be informed as to our customers is ethically sourced to advancing racial and social equity, they make decisions about engaging with third-party representation. Starbucks LGBTQIA2+ rights and disability inclusion throughout our operations. created the “We Are One Starbucks” website with critical information and resources for partners who may be exploring joining or engaging with a union. For instance, within our Tier 1 coffee supply chain, we leveraged our flagship See data tables at the end of this report for FY21 performance results and trends. C.A.F.E. Practices program to identify and initiate corrective action plans for zero tolerance non-conformities in FY21. For each zero tolerance non- conformity brought to our attention through C.A.F.E. Practices, we swiftly addressed them by working closely with our suppliers and our on-the- ground, third-party partners to pursue corrective actions, including, where appropriate, providing remedy for the impacted individuals. See our program scorecard for the full list of human rights topics we cover. On the manufactured goods side, whether it’s the merchandise on our shelves or the furniture we place in our stores, we continued to implement our ethical sourcing program and standards for manufactured goods and services, which includes on-the-ground factory assessments and assurance measures to identify and remediate potential and actual violations. While the COVID-19 pandemic limited our ability to conduct these on-the-ground assessments, we were nevertheless able to achieve a significant milestone in FY21: the mapping of and transparency into 98% of our Tier 1 manufactured goods supply chain. Going forward, we now have the transparency we need to influence, measure and report the performance of nearly our entire Tier 1 manufactured goods supply base.
ABOUT THIS REPORT Scope Previous Reports identify forward-looking statements, COVID-19 or other public health to the extent we experience a Our Global Environmental and Starbucks has produced an annual although not all forward-looking events, the expected effects of material breach; material failures Social Impact report for FY21 global social impact report since statements contain these identifying new accounting pronouncements of our information technology focuses on the goals in our two key 2001. Previous annual reports are words. These statements include and the estimated impact of systems; costs associated with, and social impact areas: People and available on our website. statements relating to trends changes in U.S. tax law, including the successful execution of, the Planet. We’ve also included links to We also respond to key industry in or expectations relating to on tax rates, investments funded Company’s initiatives and plans, information and resources publicly questionnaires such as the Dow the effects of our existing and by these changes and potential including the successful expansion available at stories.starbucks. Jones Sustainability Index and the any future initiatives, strategies outcomes and effects of legal of our Global Coffee Alliance with com and starbucks.com regarding CDP Climate Change, Water and and plans, as well as trends in or proceedings. Such statements Nestlé; our ability to obtain financing financial, corporate governance Forests Questionnaires. expectations regarding our financial are based on currently available on acceptable terms; the acceptance work, workplace and diversity results and long-term growth operating, financial and competitive of the Company’s products by our policies and performance, because model and drivers, the anticipated information and are subject to customers, evolving consumer these commitments are directly Information Integrity timing and effects of recovery various risks and uncertainties. preferences and tastes and changes tied to our business. The geographic Starbucks management is of our business, the conversion Actual future results and trends in consumer spending behavior; scope of all data points in the report responsible for the preparation of several market operations to may differ materially depending on partner investments, changes in are tracked against U.S. company- and integrity of the information fully licensed models, our plans a variety of factors, including, but the availability and cost of labor owned operations unless otherwise reported for fiscal 2021. Through a for streamlining our operations, not limited to: further spread of including any union organizing noted. Starbucks is committed system of internal controls, including including store openings, closures COVID-19 and related disruptions to efforts and our responses to such to United Nations Sustainable a comprehensive verification and changes in store formats and our business; regulatory measures efforts; significant increased logistics Development Goals and uses these process involving internal subject models, expanding our licensing to or voluntary actions that may be costs; inflationary pressures; the goals as a lens for our social impact matter experts, we believe this Nestlé of our consumer packaged put in place to limit the spread of impact of competition; inherent programs and collaborations with information accurately represents goods and Foodservice businesses COVID-19, including restrictions risks of operating a global business; others. Based on our stakeholder our global responsibility activities and its effects on our Channel on business operations or social the prices and availability of coffee, engagement efforts, we also believe and performance results for the Development segment results, tax distancing requirements, and dairy and other raw materials; the these areas are important to our fiscal year. External verification rates, business opportunities and the duration and efficacy of effect of legal proceedings; and the customers, our partners, non- over specified metrics is provided expansion, strategic acquisitions, our such restrictions; the potential effects of changes in tax laws and governmental organizations (NGOs) by Moss Adams LLP and Burns & future relationship with Starbucks for a resurgence of COVID-19 related guidance and regulations and investors. McDonnell Engineering Inc. Coffee Korea Co., Ltd., expenses, infections and the circulation of that may be implemented and other dividends, share repurchases, novel variants of COVID-19 in a risks detailed in the company filings commodity costs and our mitigation given geographic region after it with the Securities and Exchange Reporting Year Forward-Looking Statements strategies, liquidity, cash flow has hit its “peak”; fluctuations in Commission, including in the “Risk Starbucks fiscal year 2021 or “FY21” Our reporting on global from operations, use of cash and U.S. and international economies Factors” and “Management’s is September 28, 2020 through responsibility for fiscal 2021 cash requirements, investments, and currencies; our ability to Discussion and Analysis of Financial October 3, 2021, unless otherwise includes “forward-looking” borrowing capacity and use of preserve, grow and leverage our Condition and Results of Operations” noted. statements within the meaning proceeds, continuing compliance brands; the ability of our business sections of the Company’s most of the applicable securities laws with our covenants under our credit partners and third-party providers recently filed periodic reports on and regulations. Generally, these facilities and commercial paper to fulfill their responsibilities and Form 10-K and Form 10-Q and Currency statements can be identified by program, repatriation of cash to the commitments; potential negative subsequent filings. The company All references to currency are in U.S. the use of words such as “aim,” U.S., the likelihood of the issuance of effects of incidents involving food or assumes no obligation to update any dollars, unless otherwise noted. “anticipate,” “believe,” “continue,” additional debt and the applicable beverage-borne illnesses, tampering, of these forward-looking statements. “could,” “estimate,” “expect,” “feel,” interest rate, the continuing impact adulteration, contamination or “forecast,” “intend,” “may,” “outlook,” of the COVID-19 pandemic on our mislabeling; potential negative Stay Up-to-Date “plan,” “potential,” “predict,” “project,” financial results, future availability effects of material breaches of our “seek,” “should,” “will,” “would,” and of governmental subsidies for information technology systems Follow @starbucksnews on Twitter similar expressions intended to for the latest information.
STARBUCKS 2021 GLOBAL ENVIRONMENTAL & SOCIAL IMPACT REPORT Supporting 021 REPORT 2 Documents T 2 02 OR 1 R EP E 1 R PO 2 TR && Data Tables 02 2 TR 20 OP R 1 E R 1 OPE 20 2 TR 49 Goals Scorecard 56 Planet Positive Performance 60 Sustainability Accounting Standards Board Reporting 64 Human Rights
Supporting Documents & Data Tables GOALS SCORECARD 21 REPORT 2 0 2 0 ORT 21 R E P REP Here’s a snapshot of our People and Planet goals 1 O and progress for FY21. 20 TR 2T 02 RO 12 PER PE R 12 02 T RO
Goals Scorecard PEOPLE Opportunity GOAL FY21 RESULT NOTES Enroll 100,000 learners – partners, Over 87,000 course enrollments in To Be Welcoming courses globally and nearly 37,000 course The geographic scope of this data point includes customers and communities – in a To Be completions since launch. all company-owned and operated markets Welcoming course globally. Graduate 25,000 Starbucks partners from 2,500 partners earned their college degree in FY21 through the Starbucks College Achievement Plan. Arizona State University (ASU) by the end of 2025 Committed to 100% ethically sourced Nearly 95% of Starbucks coffee was ethically sourced and verified through C.A.F.E. Practices, down from coffee in partnership with Conservation 98.6% in FY20 due to restrictions caused by COVID-19. Auditors were unable to complete all necessary International in-person, on-farm audits. Committed to 100% ethically sourced tea 99.9% of tea sourced by Global Coffee, Tea & Cocoa sourcing team was verified as responsibly sourced. More on Cargill’s approach to Cocoa and cocoa 10 million kilograms of segregated cocoa beans were purchased from the Ivory Coast through our Tier 1 procurement can be found here. supplier, Cargill. Inclusion GOAL FY21 RESULT NOTES At least 40% BIPOC representation and 55% All partner base: 71% female and 48% BIPOC More information on our Workforce Diversity women in all retail roles, by 2025 in the U.S. Data is available here. Within BIPOC representation: 8% of partners identify as Black; 29% Hispanic or Latinx; 6% Asian; 5% Demographic percentages represented in this At least 30% BIPOC representation and 50% Multiracial; 1% American Indian or Alaskan Native and 0.5% Native Hawiian or other Pacific Islander section have been rounded. women for all enterprise roles, including senior leadership, by 2025 in the U.S. Senior Leadership: 54% women and 36% BIPOC At least 40% BIPOC representation and 30% Manufacturing: 33% female and 44% BIPOC women in all manufacturing roles by 2025 in the U.S. 100% gender and racial pay equity in the U.S. Starbucks has achieved and maintained 100% pay equity for women and men and people of all races performing similar work in the U.S. 100% gender pay equity globally in company- Starbucks has achieved and maintained 100% pay equity for women and men performing similar work In FY20, our licensed partners in Singapore, owned markets in global company-operated markets Canada and Great Britain. the Philippines and India also achieved 100% pay equity for women and men. In FY21, eight additional markets in Asia-Pacific and the Hong Kong Support Center achieved 100% gender pay equity.
Goals Scorecard PEOPLE Inclusion GOAL FY21 RESULT NOTES Hire 5,000 Veterans and Military Spouses in In FY21, Starbucks has hired 7,720 Veterans and military spouses across Starbucks roles in the U.S. the U.S. annually Hire 10,000 Refugees globally by 2022 In FY21, Starbucks hired 339 partners who self-identified as refugees in the U.S., Canada and EMEA. The geographic scope of this data point includes 2,959 refugees hired in the U.S., Canada and EMEA to date. globally company-owned and operated markets and licensed markets in EMEA. Community GOAL FY21 RESULT NOTES Open 100 social-impact-designed Community Starbucks dedicated its 21st Community Store in the U.S. The geographic scope of this data point includes Stores by the end of 2025 in the U.S. company-owned and operated markets in the U.S. and licensed markets in Asia-Pacific. Open 200 Military Family Stores by 2022 in 78 Military Family Stores open in the U.S. the U.S. $ The geographic scope of this data point includes Reinvest 100 million into hunger relief Met FY21 goal to ensure FoodShare food donation program is available at 100% of company operated efforts in the U.S. by 2030 stores in the U.S. and Canada. In FY21, 10.4 million meals were donated in the U.S. and 1.2 million meals all company-owned and operated stores in the were donated in Canada. U.S. and Canada. $ The geographic scope of this data point includes Increase annual spend with diverse suppliers Nearly 800 million spent with Tier 1 direct, diverse suppliers. $ all company-owned and operated stores in the to 1.5 billion by 2030 U.S. and Canada. Goal announced in 2022. $ $ Invest total 100 million in the Community Starbucks deployed 10 million into Chicago Community Development Financial Institutions (CDFIs) Resillience Fund by 2025 to support small businesses. Empower 250,000 women and girls in coffee, The Starbucks Foundation’s Origin Grants help communities break down barriers to education, The geographic scope of this data point tea and cocoa growing communities by 2025 promote clean water, sanitation and hygiene (WASH) and create economic opportunities for women includes all company-owned and operated and girls. We met this goal in early FY22, and expanded our commitment to reach 1 million women and markets globally. girls in coffee- and tea-growing frontline communities across Africa, Asia and Latin America.
Goals Scorecard PLANET 2030 Targets GOAL FY21 RESULT NOTES Starbucks commits to reduce absolute scope 1, 1% increase compared to FY19. An increase at this stage in our journey towards significant reductions scope 2 and scope 3 greenhouse gas emissions in our GHG emissions is expected. We are focused on identifying and testing innovative solutions by 50% by FY30 from a FY19 base year that we can scale across our global operations and engaging with our value chain while improving our measurement systems. In March 2021, Starbucks GHG reduction goal was validated as science-based by the SBTi, which confirmed our target is aligned with a 1.5 degree Celsius pathway. Starbucks commits through conservation or 11% decrease compared to FY19. Water withdrawals decreased in FY21 because of shifts in agricultural replenishment to reduce water withdrawals commodities purchased due to changing customer preferences, continued impacts from COVID-19, from direct operations, stores, packaging and and improvements to measurement processes. our agricultural supply chain by 50% by FY30 In August 2021, we announced an expanded water target increasing the projected water conserved or from a FY19 base year replenished and catalyzing holistic watershed health improvements in high risk basins. Starbucks commits to reduce waste sent to In FY21, we are reporting progress against our waste target as two metrics: Starbucks diverted 32% of landfill from stores (including packaging that operational waste and 24% of packaging was reusable, recyclable or compostable. leaves stores) and direct operations by 50% To improve measurement and align to industry standards, our methodology for calculating waste by FY30 from a FY19 base year diversion and packaging was updated. We are reviewing our target going forward. Strategies for Change GOAL FY21 RESULT NOTES 10,000 Greener Stores globally by 2025 2,779 Starbucks stores in FY21 were certified Greener Stores mainly in the U.S. and Canada, representing SCS Global Services completed the verification an approximately 20% increase over FY20. of Starbucks Greener Stores program for FY21. Starbucks began expanding our Green Stores framework globally. Certifying our first Greener Store outside of North America in Shanghai, China. 100% renewable energy for global operation Sourced renewable energy to power 66% of company-operated locations globally with market by 2020 constraints in China and Japan limiting our ability to meet this goal globally. As members of the RE100, we remain committed to reaching 100% renewable energy in our global company operations.
Goals Scorecard PLANET Strategies for Change GOAL FY21 RESULT NOTES Eliminate plastic straws globally by end of 2021 We achieved our goal to eliminate traditional plastic straws. This effort does not deter our commitment The geographic scope of this data point includes to accessibility and our responsibility to provide plastic straws for customers who require them to enjoy all markets globally. their favorite beverage. We are using various alternatives to traditional plastic straws globally, including PLA or PHA materials straws, and have reduced the need for straws in cold beverages through strawless lids. Double the use of reusable cups from 2016- Less than 1% of beverages sold were in reusable cups, either a customer’s personal cup, “for here” ware, 2022 or a “borrow a cup” in company operated stores globally. Due to COVID-19 safety measures reusable cups options were paused in the U.S. until June 2021, which decreased this rate. Other markets also had pauses or limitations related to Covid-19 safety measures. 20% recycled content in our hot cups by 2022 Hot cups currently contain 10% post-consumer (PCR) fiber. We will be launching a new hot cup with increased PCR fiber before the end of 2022. 100% compostable and recyclable hot cups Starbucks is continuing our work to develop compostable and recyclable hot cups in collaboration with developed by 2022 Closed Loop Partners and the NextGen Consortium. In FY21 and FY22, to date seven new markets have joined the list of major markets where Starbucks hot cups are recyclable: Lansing, Mich.; Athens and Clark County, Ga.; Atlanta and Dekalb County, Ga.; Detroit; Madison; Chicago; and Cincinnati. They join 15 other major markets: Seattle; Washington, DC; Denver; New York City; San Francisco; Boston; Louisville, Ky.; Dallas; Chattanooga, Tenn.; Kent County, Mich.; Sioux Falls, S.D.; St. Lucile County, Fla.; Vancouver and province of British Columbia; London; and Amsterdam.
Goals Scorecard PLANET 1 Ellen MacArthur Foundation Global Commitment GOAL FY21 RESULT NOTES Take action to help eliminate problematic or In 2021, we eliminated traditional plastic straws globally from our retail stores. unnecessary plastic packaging by 2025 Take action to move from single-use towards We launched multiple “borrow a cup” trials to engage customers with reusable cups in new ways. reuse models where relevant by 2025 Take action for 100% of plastic packaging to 17.8% of plastic packaging was reusable, recyclable or compostable. be reusable, recyclable or compostable by 2025 Use 5-10% recycled content across all plastic 4.6% of recycled content used across all plastic packaging. packaging by 2025 20% reduction of virgin plastic packaging by 11.9% increase of virgin plastic packaging compared to FY19. 2025 compared to FY19 Sustainable Future of Coffee GOAL FY21 RESULT NOTES Achieve Carbon Neutral Green Coffee by 2030 This goal was announced in FY21. Starbucks is working to determine the baseline for this goal and appropriate measurement processes. Conserve water usage in green coffee Contracted more than 1,200 eco-wet water mills for separating coffee fruit from coffee beans, saving processing by 50% up to 80% of water where installed. Provide 100 million coffee trees to farmers More than 10 million climate-resistant trees distributed globally. by 2025 1 Starbucks EMF commitments and related reporting represents packaging from direct operations and licensed stores and excludes Starbucks branded packaging not sold in our stores. Starbucks branded products sold outside of our stores is part of a licensed model of the Global Coffee Alliance with Nestlé, while our global ready-to-drink businesses operate under collaborative relationships with PepsiCo and others. The Starbucks branded packaging used by Channel Development business partners are part of their commitments and reporting.
Goals Scorecard PLANET Animal Welfare GOAL FY21 RESULT NOTES Phase out the excessive use of gestation stalls Developed plan to specify “100% group-house pork” as a as a requirement of our pork suppliers in The geographic scope of this data point includes for mother pigs (sows) in our supply chain by the U.S. and Canada and take steps to ensure a “group-housed” pork supply in 2024. We expect to all company-owned and operated stores in the 2030 demonstrate meaningful progress towards this goal in 2023. Group housing will significantly reduce a U.S. and Canada. sow’s time in a gestation stall.
Supporting Documents & Data Tables 021 REPORT 2 T 2 02 OR 1 R 1,2,3 EP E PLANET POSITIVE PERFORMANCE 1 R PO 20 TR 2 T 02 R O 1 2 The following metrics represent detailed reporting of Starbucks P E R P E R environmental performance in FY19, the baseline year for our 2030 1 2 0 2 T R O environmental targets, and FY21. We made significant updates to our inventory methodologies this year and rebaselined FY19 results, which will differ from the FY19 data previously reported. We did not update our FY20 calculations because reduced business activity in FY20 from 4 COVID-19 make this year difficult to use for comparisons. In FY21, we were not expecting significant reductions in our environmental impacts and progress towards our 2030 targets as we are focused on identifying and testing innovative solutions that we can scale across our global operations and we are committed to enhancing measurement systems and coordination across Starbucks and our value chain. 1 The scope of this data is global unless otherwise noted. Direct operations refers to an operational control boundary, inclusive of company owned stores, corporate offices, and manufacturing and distribution facilities. This includes global wholly-owned and partially-owned subsidiaries over which Starbucks has management and operational control. Direct operations excludes licensed stores. 2 We have updated the methodologies used to develop our environmental inventories. These updates including improved data quality and availability, changes to emissions and water factors, and other methodological changes. These changes are reflected consistently in our FY19 and FY21 inventories. 3 Where possible, reported data aligns with our fiscal year. In some cases, for example utility bills, the data aligns to the nearest month rather than the exact fiscal year end and start dates. 4 FY20 environmental performance metrics are available in Starbucks FY20 Global Environmental and Social Impact Report Supplement
Planet Positive Performance ( ) ENERGY CONSUMPTION MWh FY19 FY21 5 Total Energy Consumption, direct operations 2,570,946 2,605,210 5 In gigajoules, total energy consumption in FY21 equals 9,478,801 GJ, Total purchased electricity, direct operations 1,948,466 1,991,153 and total fuel consumed in FY21 equals 2,296,223 GJ. 6 6 Percent renewable 71% 66% A methodology change was made in FY19 and FY21 inventories to update estimates and emission factors resulting more scope 2 7 Total fuel consumed, direct operations 622,480 614,057 market-based emission than previously reported for FY19. This also impacted the percent of electricity sourced from renewables. 7Fuel use includes natural gas, propane, aviation fuel and vehicle fuel. GREENHOUSE GAS EMISSIONS8 FY19 FY21 8 Starbucks presents greenhouse gas emissions in accordance with the GHG Protocol and uses global warming potential values from 9 Scope 1 349,178 372,020 the IPCC Fourth Assessment. 9 Scope 2 FY21 data has been third-party verified by Burns and McDonnell. 6,9 Their report is available at the end of this report. market-based 396,487 474,774 10 Scope 3 emissions utilize location-based values 9 location-based 877,440 923,483 11 Category 1 emissions includes land use change (LUC) for purchases sub-total scope 1 + 2 market-based emissions 745,665 846,794 of coffee, tea, cocoa and dairy. LUC is defined as a change from 10 one land-use category to another as a result of human activity. We Scope 3 use the Quantis LUC methodology, which accounts for year-to- 1 9,11,12 year, country-level LUC over 20-year intervals, including primary Purchased goods and services 8,143,957 8,128,362 and secondary forest loss; peatland drainage and degradation; 2 Capital goods 250,223 211,674 and soil erosion and degradation. LUC numbers were assumed 3 to stay constant from FY20, as we plan to update our calculation Fuel- and energy-related activities 164,059 203,417 methodologies for these emissions for our next reporting cycle as 4 new guidance becomes available. Upstream transportation and distribution 589,987 676,195 12 5 Category 1 emissions include the emissions from the purchased Waste generated in operations 287,716 283,847 goods and services made by Starbucks Corporation. We have 6 Business travel 26,008 3,766 moved purchases made by licensees for key commodities to 7 category 14 as recommended by the GHG Protocol. Employee commuting 583,742 619,526 13 8 13 Starbucks does not have significant upstream leased assets. Upstream leased assets Not relevant 14 9 Downstream transportation impacts are minimal and not Downstream transportation and distribution Not relevant calculated. 10 15 Processing of sold products 42,055 46,498 Starbucks does not act as a lessor. 11 16 Use of sold products 77,718 78,339 A methodology change was made in the FY19 and FY21 inventories 12 to include the scope 1, 2 and select scope 3 emissions of our global End-of-life treatment of sold products 155,748 155,004 licensed stores’ in category 14, instead of category 3 as in prior 13 15 years. The select scope 3 emissions include the emissions from Downstream leased assets Not relevant these licensed stores’ purchases of food, beverage ingredients, and 14 16 Franchises 3,330,106 2,308,317 packaging not purchased through Starbucks Corporation as these 15 17 are covered in category 1. Due to data availability, purchases by Investments 143,350 1,144,133 Licensed Stores are often estimated. subtotal scope 3 emissions 13,794,670 13,859,078 17 A methodology change was made in the FY19 and FY21 inventories Total emissions (scope 1 + 2 market-based + 3) 14,540,335 14,705,871 to include operational emissions from two joint ventures: (1) North American Coffee Partnership, a joint venture with Pepsi, and (2) 18 Percent of total GHG emissions from fluid dairy purchases 19% 18% Starbucks AiNi Group. From FY20 to FY21, we also updated our 19 methodology for estimating emissions from our investment in the Percent of total GHG emissions from green coffee purchases 16% 14% Valor Siren Venture Fund. Percent reduction of total emissions from FY19 baseline -1%
Planet Positive Performance ( ) WATER WITHDRAWALS megaliters FY19 FY21 Total water withdrawal 4,306,370 3,845,353 18 Total GHG emissions from fluid dairy purchases is inclusive of fluid 9,20,21 dairy categorized in scope 3 category 1 and category 14, and include Direct operations 22,996 24,177 22 estimated LUC associated with these purchases. Percent water withdrawn from high-risk basins Not calculated 32% 19 Total GHG emissions from gree coffee purchases is inclusive of 20 Indirect: licensed stores 9,737 13,271 estimated LUC associated with these purchases included in scope 22 3 category 1. Percent water withdrawn from high-risk basins Not calculated 42% 20 23 Water withdrawal from stores includes both primary and Indirect: packaging and agricultural commodities purchased 4,273,638 3,807,905 estimated data. Where primary data is not available, water Percent reduction of total water withdrawal from FY19 baseline 11% withdrawal is estimated by applying an average water withdrawal factor derived from U.S. and Canada company-owned stores. 21 Starbucks withdraws water strictly from local water utilities or 24 similar relevant entities, and as such all of our water withdrawals ( ) OPERATIONAL WASTE thousand metric tons FY19 FY21 are categorized as sourced from third-party water. 22 Total weight of non-hazardous operational waste 1,184 1,183 High risk basins refers to water withdrawals from facilities located in regions of high or extremely-high baseline water stress as 25 Direct operations generated 854 901 defined by WRI Aqueduct tool, which was used to conduct this Percent organic 53% 55% assessment. 23 26 Water withdrawal from packaging and agricultural commodities Percent diverted 27% 34% is estimated using country-level or regional data from the World 27 Food Lifecycle Database (WFLDB). Reporting of this category aligns Indirect: generated in licensed stores 330 282 with our GHG inventory, scope 3, category 1. Percent organic 58% 56% 24 A methodology change was made in the FY19 and FY21 inventories 26 to update operational waste values and classifications to be Percent diverted 18% 24% 26 consistent with internal data tracking and estimation methodology Percent total non-hazardous operational waste, diverted 25% 32% improvements established in FY21. We are not reporting on waste discarded by customers out of stores and instead have expanded our reporting of packaging materials. 25 Reporting of this category aligns with the GHG inventory, scope 3, category 5. 26 We measure diversion as waste materials recycled, composted, donated, or sold to be processed int cattle feed. Diversion does not include materials sent to landfill, incineration (with or without energy recovery) or liquid waste sent down the drain (excludes water). 27 Licensed store non-hazardous waste is estimated based on company-owned store information. This does not include construction & demolition waste. Reporting of this category aligns with the GHG inventory, scope 3, category 14.
Planet Positive Performance 28 ( ) PACKAGING MATERIALS thousand metric tons FY19 FY21 29 Total weight of packaging material 280 277 28 Data represents packaging materials used in our direct operations Percent of packaging made from recycled or renewable materials 21.0% 15.5% and licensed stores and all other packaging materials purchased by Percent of materials recyclable, compostable or reusable 22.7% 27.3% Starbucks Corporation. Packaging materials purchased by channel business partners for use in products they sell with our brand on 30 it and not sold in a Starbucks retail store is excluded. This aligns Corporation 187 194 with our GHG Inventory and Ellen MacArthur Foundation Global Indirect: total weight of packaging materials purchased by licensees for 94 83 Commitment reporting boundaries. Starbucks branded products 31 sold outside of our stores is part of a licensed model of the Global Starbucks retail operations Coffee Alliance with Nestlé, while our global ready-to-drink 32 businesses operate under collaborative relationships with PepsiCo Total weight of plastic packaging materials 150 166 Total weight of virgin plastic packaging materials 139 156 and others. The Starbucks branded packaging used by Channel Development business partners are part of their commitments and Percent reduction of virgin plastic packaging materials from FY19 baseline -11.9% reporting. 33 29 Data represents paper and plastic packaging materials, our most Percent of plastic packaging that is reusable, recyclable or compostable 19.4% 23.2% significant sources of packaging materials. Percent of post-consumer recycled content used in our plastic packaging 6.1% 4.6% 30 Reporting of this category aligns with packaging materials reported in the GHG inventory under scope 3, category 1. 31 Reporting of this category aligns with packaging materials reported in the GHG inventory under scope 3, category 14. 32 FY19 inventory has been recalculated to align to methodology changes made as part of the FY21 inventory. These results may differ from what has been previously submitted to Ellen MacArthur Foundation Global Commitment and WWF ReSource Plastic and we anticipate restating these baselines in our 2022 reporting to these organizations. 33 In assessing the recyclability of our portfolio Starbucks has aligned with the New Plastics Economy 2022 Recycling Rate Survey results.
Supporting Documents & Data Tables SUSTAINABILITY ACCOUNTING STANDARDS BOARD REPORTING REP 021 ORT 2 T 2 02 OR 1 R EP E 1 R PO 20 TR 2T 02 RO 12 PER PER 120 2 TR O
SASB Reporting TOPIC & ACCOUNTING METRIC SASB CODE FY21 STARBUCKS RESPONSE Energy Management (1) Total energy consumed, (2) percentage grid electricity, (3) percentage FB-RN-130a.1 See FY21 Global Environmental & Social Impact Report narrative, page 35. renewable See Planet Positive Performance, page 61. Additional information is available in our CDP Climate Change response. Water Management (1) Total water withdrawn, (2) total water consumed, percentage of each FB-RN-140a.1 See FY21 Global Environmental & Social Impact Report narrative, page 36. in regions with High or Extremely High Baseline Water Stress See Planet Positive Performance, page 56. Additional information is available in our CDP Water Stewardship response. Total volume of water consumption is not monitored as we do not typically have discharge meters in our stores and do not track how much water goes into beverages. Therefore, we are disclosing on water withdrawn from regions with high or extremely baseline water stress. Food & Packaging Waste Management (1) Total amount of waste, (2) percentage food waste, and (3) percentage FB-RN-150a.1 See FY21 Global Environmental & Social Impact Report narrative, page 36. diverted See Planet Positive Performance, page 56. (1) Total weight of packaging, (2) percentage made from recycled and/or FB-RN-150a.2 Additional information about our packaging is available via our reporting to renewable materials, and (3) percentage that is recyclable, reusable, WWF ReSource and the Ellen MacArthur Foundation Global commitment. and/or compostable Food Safety (1) Percentage of restaurants inspected by a food safety oversight body, FB-RN-250a.1 Starbucks is always committed to the health and safety of our customers (2) percentage receiving critical violations and partners. We regularly audit and review product quality and food safety (1) Number of recalls issued and (2) total amount of food product recalled FB-RN-250a.2 practices. We validate our policies and procedures to ensure they are effective and up to date. We actively communicate with our partners and customers Number of confirmed foodborne illness outbreaks, percentage resulting in FB-RN-250a.3 through starbucks.com and other communication channels on product-related U.S. Centers for Disease Control and Prevention (CDC) investigation nutritional and safety information.
SASB Reporting TOPIC & ACCOUNTING METRIC SASB CODE FY21 STARBUCKS RESPONSE Nutritional Content (1) Percentage of meal options consistent with national dietary guidelines FB-RN-260a.1 Starbucks provides transparent information to ingredients, calories and other and (2) revenue from these options nutritional information. Additional information is available on starbucks.com. (1) Percentage of children’s meal options consistent with national dietary FB-RN-260a.2 Starbucks reviews our marketing and advertising for compliance with all guidelines for children and (2) revenue from these options applicable laws, including the Federal Trade Commission’s Truthin-Advertising standards. We also design our digital content to be compliant with the Number of advertising impressions made on children, percentage promoting FB-RN-260a.3 Children’s Online Privacy Protection Act (COPPA). products that meet national dietary guidelines for children Additional information is available in Starbucks Global Human Rights Statement. Labor Practices (1) Voluntary and (2) involuntary turnover rate for restaurant employees FB-RN-310a.1 Starbucks is committed to being an employer of choice and maintaining the strength of our workforce. Starbucks makes available online our Commitment to (1) Average hourly wage, by region and (2) percentage of restaurant FB-RN-310a.2 Partners and our workforce data for the U.S. business. Additional information is employees earning minimum wage, by region available on Human Capital Management in our Form 10-K Filing (on pages 2-4). Number of advertising impressions made on children, percentage promoting FB-RN-260a.3 As of FY21, 100% of U.S. partners earn above minimum wage. Additional products that meet national dietary guidelines for children information about Starbucks labor practices is available at Starbucks Commitment to Partners. Supply Chain Management & Food Sourcing Percentage of food purchased that (1) meets environmental and social FB-RN-430a.1 sourcing standards and (2) is certified to third-party environmental and/or Starbucks ethical sourcing approach integrates social and environmental social standards standards and is an expectation for suppliers and business partners. Additional Percentage of (1) eggs that originated from a cage-free environment and (2) FB-RN-430a.2 information is available in the Starbucks Global Human Rights Statement, Our pork that was produced without the use of gestation crates Supply Chain. Discussion of strategy to manage environmental and social risks within the FB-RN-430a.3 See FY21 Global Environmental & Social Impact Report narrative, page 39. supply chain, including animal welfare
SASB Reporting TOPIC & ACCOUNTING METRIC SASB CODE FY21 STARBUCKS RESPONSE Activity Metrics Number of (1) company-owned and (2) franchise restaurants FB-RN-000.A As of October 3, 2021, Starbucks operated 17,133 Company-Operated and 16,700 Licensed locations. Additional information is available in the Starbucks Number of employees at (1) company-owned and (2) franchise locations FB-RN-000.B Fiscal 2021 Annual Report, page 11. As of October 3, 2021, Starbucks employed approximately 383,000 people worldwide. Additional information is available in the Starbucks Fiscal 2021 Annual Report, page 8.
Supporting Documents & Data Tables 021 REPORT 2 T 2 02 OR 1 R EP E 1 R PO HUMAN RIGHTS 20 TR 2T 02 RO 12 PER PER Starbucks reports its most recent fiscal year performance to demonstrate 12 02 TR O its commitment to fundamental human rights and reporting continuous improvement transparently. As we continue to mature our internal data management systems, we intend to share more information about our human rights performance in future reports.
Human Rights Coffee ZERO-TOLERANCE INDICATORS # OF NONCONFORMITIES % OF TOTAL NONCONFORMITIES Nonconformities related to wage practices 161 54.4% All suppliers from which we purchase a product or service Nonconformities related to traceability requirements 57 19.3% are required to pledge compliance with our Supplier Nonconformities related to child labor 46 15.5% Code of Conduct. Our flagship ethical sourcing program, Nonconformities related to labor intermediaries 11 3.7% based on the Coffee and Farmer Equity (C.A.F.E.) Practices standard, is dedicated to monitoring 100 percent of our Nonconformities related to transparency 8 2.7% C.A.F.E.-approved, coffee supply chains, which today requirements 1 represents more than 400,000 farms around the world. 3 We also monitor all facilities in our first-tier, manufactured Nonconformities related to banned pesticides 7 2.4% goods supply chain. Nonconformities related to forced labor, abuse, or 6 2.0% A nonconformity is a breach of any one of Starbucks unethical recruitment practices zero-tolerance indicators. Multiple nonconformities could 296 100% be identified in a single location. In FY21, we verified or audited 525 coffee supply chains and identified 296 zero- 2 tolerance nonconformities in 88 supply chains. For each Manufactured Goods zero tolerance non-conformity brought to our attention through C.A.F.E. Practices, we swiftly addressed them by ZERO-TOLERANCE INDICATORS # OF NONCONFORMITIES % OF TOTAL NONCONFORMITIES working closely with our suppliers and our on-the-ground, third-party partners to pursue corrective actions, including, Nonconformities related to wage practices 19 63.3% where appropriate, providing remedy for the impacted individuals. For manufactured goods, we assessed 213 Nonconformities related to transparency 5 16.7% manufactured goods facilities and identified 30 zero- requirements tolerance nonconformities in 10 facilities. Access denial into facilities for audits and inspections 2 6.7% 1 Health and safety, including direct and immediate A “coffee supply chain” is a network of farms, mills, and warehouses. 2 6.7% We work with more than 1,100 coffee supply chains, which are endangerment made up of more than 400,000 individual farms. 2 Environmental impact 1 3.3% All coffee supply chains are verified or audited at regular intervals Forced labor 1 3.3% by approved, verification organizations and with oversight provided by SCS Global Services that includes additional audits. Child labor 0 0.0% While exceptions exist, as a general rule, we verify or audit all new supply chains and large-scale supply chains every year. Abuse and harassment 0 0.0% Returning or reverifying coffee supply chains are generally verified 30 100% approximately every two years. 3 Includes pesticides classified as Type 1a or 1b by the World Health Organization.
Independent Accountant’s Report To the Stakeholders of Starbucks Coffee Company We have examined the data identified below (the Data) contained within the Starbucks Coffee Company’s Global Environmental and Social Impact Report (the Report) for the fiscal year ended October 3, 2021. Starbucks Coffee Company’s management is responsible for the Data. Our responsibility is to express an opinion on the Data listed below based on our examination: 95% ethically sourced coffee purchases as contained in the Coffee and Farmer Equity (C.A.F.E) Practices sec of the Report; tion on page 11 99.9% ethically sourced tea purchases as contained in the Responsible Sourcing for Tea section on page 12 of the Report; 10 million kilograms of segregated cocoa beans purchased from Cargill as contained in the Responsible Sourcing for Cocoa section on page 12 of the Report; Investment in farmer loans since FY18 of $54.8 million as contained in the Global Farmer Fund section on page 13 of the Report. The criteria used to evaluate the Data are contained in the respective sections of the Report indicated above. Our examination was conducted in accordance with attestation standards established by the American Institute of Certified Public Accountants. Those standards require that we plan and perform the examination to obtain reasonable assurance about whether the Data is in accordance with the criteria, in all material respects. An examination involves performing procedures to obtain evidence about the Data. Those procedures are described in more detail in the paragraph below. The nature, timing, and extent of the procedures selected depend on our judgment, including an assessment of the risks of material misstatement of the Data, whether due to fraud or error. We believe that the evidence we obtained is sufficient and appropriate to provide a reasonable basis for our opinion. Our evidence-gathering procedures included, among other activities, the following: Testing the effectiveness of the internal reporting system used to collect and compile information on the Data which is included in the Report; Performing specific procedures, on a sample basis, to validate the Data, through communications with Starbucks Coffee Trading Company buying operations in Lausanne, Switzerland, and Corporate headquarters in Seattle, Washington; Interviewing partners (employees) responsible for data collection and reporting; Reviewing relevant documentation, including corporate policies, management and reporting structures; Performing tests, on a sample basis, of documentation and systems used to collect, analyze and compile the Data that is included in the Report, and Confirming certain of the Data to third-party confirmations and reports. In our opinion, the Data for the fiscal year ended October 3, 2021, is presented in accordance with the criteria indicated above, in all material respects. Seattle, Washington April 22, 2022
Memorandum Date: April 5, 2022 To: To the Board of Directors and Stakeholders of Starbucks Coffee Company From: Emily Robbins – Burns & McDonnell Subject: Verification Report for FY2021 Greenhouse Gas Inventory and Water Withdrawals Inventory Burns & McDonnell Engineering Company, Inc. (Burns & McDonnell) was retained by Starbucks Corporation (Starbucks) to verify and provide a third-party assessment of the 2021 Greenhouse Gas (GHG) Emissions Inventory and Water Withdrawals Inventory for Fiscal Year (FY) 2021. The purpose of assessment was to verify that the FY2021 GHG Emissions Inventory and Water Withdrawals Inventory represents a reasonable and accurate account of Starbuck’s GHG emissions and water withdrawals. Greenhouse Gas Emissions Inventory Burns & McDonnell reviewed Scope 1, Scope 2, and Scope 3 GHG emissions as presented in the “FY21 SBUX GHG Scope 1, 2, Operational Water Inventory” and “FY21 SBUX GHG Scope 3 & Indirect Water Inventory” excel workbooks for the fiscal period September 28, 2020 through October 3, 2021. The GHG emissions data included in the emissions inventory that were subject to review consisted of the following for each Scope: Scope 1 GHG Emissions: • Fuel combustion (retail and non-retail facilities, roasting) • Process emissions from roasting • Refrigerant losses from equipment • Nitrous (whipped cream chargers) • Corporate jet fuel use • Starbucks owned vehicles fuel use Scope 2 GHG Emissions: • Purchased electricity usage (market based and location based) Scope 3 GHG Emissions: • Category 1 – Purchased Goods and Services • Category 2 – Capital Goods • Category 3 – Fuel- and Energy-Related Activities • Category 4 – Upstream Transportation and Distribution • Category 5 – Waste Generated in Operations • Category 6 – Business Travel • Category 7 – Employee Commuting • Category 10 – Processing of Sold Products
Memorandum (continued) April 29, 2022 Page 2 • Category 11 – Use of Sold Products • Category 12 – End of Life Treatment of Sold Products • Category 14 – Franchises • Category 15 – Investments It should be noted that this inventory is based on the Fourth Assessment Report (AR4) Global Warming Potential Values developed by the Intergovernmental Panel on Climate Change (IPCC) Fifth Assessment Report. The GHG inventory assurance review was conducted in accordance with the ISO 14046-3 Standard and World Resources Institute GHG Protocol based on evidence of the reliability of the procedures undertaken to develop the GHG Emissions Footprint. To the best of our knowledge, Burns & McDonnell has found with moderate assurance that Starbucks has satisfactorily compiled a reasonable and fair account of their GHG emissions for FY 2021. Water Withdrawals Inventory In order to complete this moderate assurance of Starbucks’ FY2021 Water Withdrawals Inventory, Burns & McDonnell utilized the AA1000AS Quality Assurance Standard and obtained, analyzed and verified data related to water withdrawals as described below. This included: • A review of Starbuck’s operations and facility activities for the purposes of verifying the water withdrawals • A qualitative review evaluating water withdrawals potentially omitted from the FY2021 Water Withdrawals Inventory and the impact on the overall inventory accuracy • A review of the processes and procedures utilized to gather data for and develop the FY2021 Water Withdrawals Inventory • An examination of Starbucks’ 2021 Water Withdrawals Inventory report and electronic workbook spreadsheets utilized to calculate water withdrawals Statement of Independence This verification and third-party assessment was performed with no conflicts of interest in relation to providing the assurance of the FY2021 Greenhouse Gas Inventory and Water Withdrawals Inventory for Starbucks.