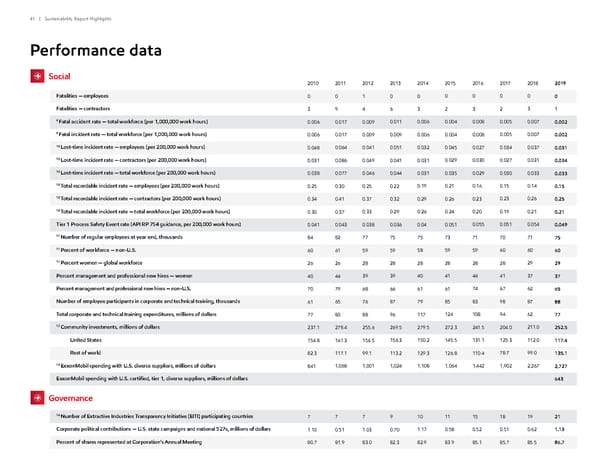
2019 2010 2011 2012 2013 2014 2015 2016 2017 2018 Fatalities — employees Fatalities — contractors 9 Fatal accident rate — total workforce (per 1,000,000 work hours) 9 Fatal incident rate — total workforce (per 1,000,000 work hours) 10 Lost-time incident rate — employees (per 200,000 work hours) 10 Lost-time incident rate — contractors (per 200,000 work hours) 10 Lost-time incident rate — total workforce (per 200,000 work hours) 10 Total recordable incident rate — employees (per 200,000 work hours) 10 Total recordable incident rate — contractors (per 200,000 work hours) 10 Total recordable incident rate — total workforce (per 200,000 work hours) Tier 1 Process Safety Event rate (API RP 754 guidance, per 200,000 work hours) 11 Number of regular employees at year end, thousands 11 Percent of workforce — non-U.S. 11 Percent women — global workforce Percent management and professional new hires — women Percent management and professional new hires — non-U.S. Number of employee participants in corporate and technical training, thousands Total corporate and technical training expenditures, millions of dollars 12 Community investments, millions of dollars United States Rest of world 13 ExxonMobil spending with U.S. diverse suppliers, millions of dollars ExxonMobil spending with U.S. certified, tier 1, diverse suppliers, millions of dollars 0 1 0.002 0.002 0.031 0.034 0.033 0.15 0.25 0.21 0.049 75 60 29 37 65 88 77 252.5 117.4 135.1 2,727 643 0 3 0.006 0.006 0.048 0.031 0.038 0.25 0.34 0.30 0.041 84 60 26 40 70 61 77 237.1 154.8 82.3 841 0 9 0.017 0.017 0.064 0.086 0.077 0.30 0.41 0.37 0.043 82 61 26 44 79 65 80 278.4 161.3 117.1 1,068 1 4 0.009 0.009 0.041 0.049 0.046 0.25 0.37 0.33 0.038 77 59 28 39 68 76 88 255.6 156.5 99.1 1,001 0 6 0.011 0.009 0.051 0.041 0.044 0.22 0.32 0.29 0.036 75 59 28 39 66 87 96 269.5 156.3 113.2 1,024 0 3 0.006 0.006 0.032 0.031 0.031 0.19 0.29 0.26 0.04 75 58 28 40 61 79 117 279.5 150.2 129.3 1,108 0 2 0.004 0.004 0.045 0.029 0.035 0.21 0.26 0.24 0.051 73 59 28 41 61 85 124 272.3 145.5 126.8 1,064 0 3 0.008 0.008 0.027 0.030 0.029 0.16 0.23 0.20 0.055 71 59 28 44 74 83 108 241.5 131.1 110.4 1,442 0 2 0.005 0.005 0.034 0.027 0.030 0.15 0.23 0.19 0.051 70 60 28 41 67 98 94 204.0 125.3 78.7 1,902 0 3 0.007 0.007 0.037 0.031 0.033 0.14 0.26 0.21 0.054 71 60 29 37 62 87 62 211.0 112.0 99.0 2,267 14 Number of Extractive Industries Transparency Initiative (EITI) participating countries Corporate political contributions — U.S. state campaigns and national 527s, millions of dollars Percent of shares represented at Corporation’s Annual Meeting 7 1.10 80.7 7 0.51 81.9 7 1.03 83.0 9 0.70 82.3 10 1.17 82.9 11 0.58 83.9 15 0.52 85.1 18 0.51 85.7 19 0.62 85.5 21 1.13 86.7 Social Governance Performance data 41 | Sustainability Report Highlights
 ExxonMobil ESG Report Page 40 Page 42