ExxonMobil ESG Report
Sustainability Report Highlights In response to the COVID-19 pandemic, ExxonMobil temporarily reconfigured manufacturing operations in Louisiana to produce, blend, package and distribute hand sanitizer.
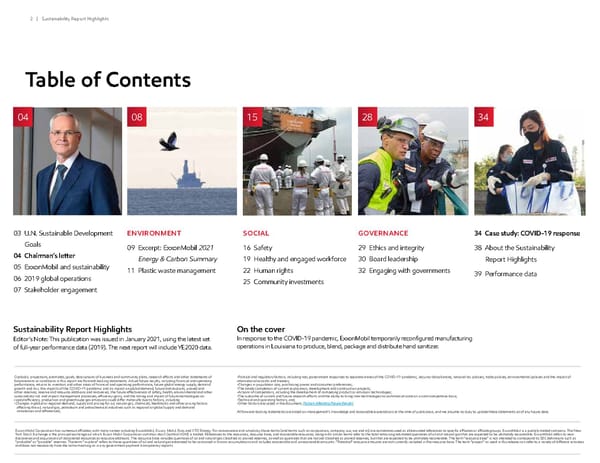
Table of Contents 2 | Sustainability Report Highlights 04 08 15 28 34 03 U.N. Sustainable Development Goals 04 Chairman’s letter 05 ExxonMobil and sustainability 06 2019 global operations 07 Stakeholder engagement ENVIRONMENT 09 Excerpt: ExxonMobil 2021 Energy & Carbon Summary 11 Plastic waste management SOCIAL 16 Safety 19 Healthy and engaged workforce 22 Human rights 25 Community investments GOVERNANCE 29 Ethics and integrity 30 Board leadership 32 Engaging with governments 34 Case study: COVID-19 response 38 About the Sustainability Report Highlights 39 Performance data Outlooks, projections, estimates, goals, descriptions of business and community plans, research efforts and other statements of future events or conditions in this report are forward-looking statements. Actual future results, including financial and operating performance, returns to investors and other areas of financial and operating performance, future global energy supply, demand growth and mix, the impacts of the COVID-19 pandemic and its impact on global demand, future distributions, proved and other reserves, reserve and resource additions and recoveries, the future effectiveness of safety, health, environmental and other sustainability risk and impact management processes, efficiency gains, and the timing and impact of future technologies on capital efficiency, production and greenhouse gas emissions could differ materially due to factors, including: •Changes in global or regional demand, supply and pricing for oil, natural gas, chemicals, feedstocks and other pricing factors affecting the oil, natural gas, petroleum and petrochemical industries such as regional or global supply and demand imbalances and differentials; Exxon Mobil Corporation has numerous affiliates, with many names including ExxonMobil, Exxon, Mobil, Esso and XTO Energy. For convenience and simplicity, those terms (and terms such as corporation, company, our, we and its) are sometimes used as abbreviated references to specific affiliates or affiliate groups. ExxonMobil is a publicly traded company. The New York Stock Exchange is the principal exchange on which Exxon Mobil Corporation common stock (symbol XOM) is traded. References to the resources, resource base, and recoverable resources, along with similar terms refer to the total remaining estimated quantities of oil and natural gas that are expected to be ultimately recoverable. ExxonMobil refers to new discoveries and acquisitions of discovered resources as resource additions. The resource base includes quantities of oil and natural gas classified as proved reserves, as well as quantities that are not yet classified as proved reserves, but that are expected to be ultimately recoverable. The term “resource base” is not intended to correspond to SEC definitions such as “probable” or “possible” reserves. The term “in-place” refers to those quantities of oil and natural gas estimated to be contained in known accumulations and includes recoverable and unrecoverable amounts. “Potential” resource amounts are not currently included in the resource base. The term “project” as used in this release can refer to a variety of different activities and does not necessarily have the same meaning as in any government payment transparency reports. •Political and regulatory factors, including war, government responses to separate waves of the COVID-19 pandemic, security disturbances, national tax policies, trade policies, environmental policies and the impact of international accords and treaties; •Changes in population size, purchasing power and consumer preferences; •The timely completion of current exploration, development and construction projects; •Actions of competitors, including the development of competing product or emission technologies; •The outcome of current and future research efforts and the ability to bring new technologies to commercial scale on a cost-competitive basis; •Technical and operating factors; and; •Other factors discussed in the document, Factors Affecting Future Results . All forward-looking statements are based on management’s knowledge and reasonable expectations at the time of publication, and we assume no duty to update these statements as of any future date. Sustainability Report Highlights Editor’s Note: This publication was issued in January 2021, using the latest set of full-year performance data (2019). The next report will include YE2020 data. On the cover In response to the COVID-19 pandemic, ExxonMobil temporarily reconfigured manufacturing operations in Louisiana to produce, blend, package and distribute hand sanitizer.
Addressing the United Nations Sustainable Development Goals The United Nations has adopted the Sustainable Development Goals (SDGs) to achieve significant progress on global economic, social and environmental challenges by 2030. Although directed at governments, the private sector and civil society play an important role in support of governments’ national plans. ExxonMobil contributes to certain aspects of all 17 SDGs. In this report, we feature eight SDGs to which we are making significant contributions. For additional information, visit the Sustainability Report content index. 3 | Sustainability Report Highlights
Darren W. Woods Chairman and Chief Executive Officer 4 | Sustainability Report Highlights Darren W. Woods, Chairman and Chief Executive Officer. Chairman’s letter At ExxonMobil, we strive to deliver superior results while providing products and services that are essential to the health and welfare of billions of people around the world. How we achieve these results is as important as the results themselves. That is why we are committed to operating our businesses in a responsible and sustainable manner, supplying high-quality products, working to minimize environmental impacts and supporting the communities where we live and work. These efforts are outlined in our latest Sustainability Report and its companion publication, the Energy & Carbon Summary , which showcases efforts to reduce greenhouse gas emissions. Few would disagree that one of the most urgent societal challenges we face today is addressing the risks of climate change. How we meet the world’s demand for the energy necessary for economic growth while mitigating the long-term impact on our environment is key to our sustainable future. We are making progress in this area through a variety of actions including enhancing energy efficiency across our operations, improving leak detection and repair and increasing cogeneration capacity at manufacturing facilities. As a result of these efforts, we expect to meet our goal to decrease methane emissions by 15 percent and flaring by 25 percent by 2020, compared to 2016 levels. We recently outlined a new five-year plan to further reduce greenhouse gas emissions from our operations in support of the goals of the Paris Agreement. We plan to reduce the intensity of our operated upstream greenhouse gas emissions by 15 to 20 percent by 2025, compared to 2016 levels. This plan will be supported by a 40 to 50 percent decrease in methane intensity, and a 35 to 45 percent decrease in flaring intensity across our global operations. Ultimately, we aim for industry-leading greenhouse gas performance across our businesses by 2030. We also plan to align with the World Bank’s initiative to eliminate routine flaring by 2030 – a continuation of the strict flaring protocols we adopted for our U.S. unconventional operations in 2019 – and we proposed a model regulatory framework for our industry to mitigate methane emissions from new and existing oil and gas operations. The steps we are taking to reduce emissions reflect ExxonMobil’s commitment to addressing the risks of climate change. We also continue to invest in lower-emission technologies, such as carbon capture and advanced biofuels, which are necessary for society to achieve its ambition for net zero emissions by 2050. Other key dimensions of sustainability performance include: • Taking action to help society address plastic waste in the environment by working on advanced recycling solutions and having no reportable plastic pellet losses for two consecutive years; • Achieving a historically low rate of high-consequence injuries, extending a multiyear improvement trend • Increasing representation of women executives by 69 percent since 2009; • Increasing representation of minority executives in the United States by 80 percent since 2009; • Contributing more than $250 million in communities worldwide to address key needs such as health care, disaster relief, education and economic development; • Expanding human rights training with more than 1,800 employees across 49 countries completing training since 2015. These actions demonstrate our commitment to responsibly and sustainably running our businesses and the resilience and excellence of our people who respond and adapt to new challenges. That adaptability was critically important in responding to the COVID-19 global pandemic. I am proud of the way our company and our people delivered assistance to governments, health care personnel and first responders around the world while safely providing an uninterrupted supply of vital energy products. We boosted production of isopropyl alcohol, the key ingredient in hand sanitizer, and polypropylene, critical for the manufacture of medical masks and surgical gowns. One of our U.S. manufacturing facilities even temporarily reconfigured its operations to directly manufacture hand sanitizer to meet increased demand. Further details on our response to the pandemic, our overall sustainability efforts and our work to manage the risks of climate change are included in our Sustainability Report and Energy & Carbon Summary . I hope you find these reports useful and informative in understanding more about ExxonMobil’s positive contribution to society. Thank you for your interest, and we welcome your feedback. Sincerely,
Sustainability S o c i a l E n v i r o n m e n t G o v e r n a n c e M a n a g i n g t h e r i s k s o f c l i m a t e c h a n g e E n v i r o n m e n t a l p e r f o r m a n c e C o r p o r a t e g o v e r n a n c e e n g a g e m e n t a n d C o m m u n i t y h u m a n r i g h t s d e v e l o p m e n t a n d L o c a l s u p p l y c h a i n m a n a g e m e n t a n d t h e w o r k p l a c e S a f e t y , h e a l t h ExxonMobil and sustainability ExxonMobil is committed to producing the energy and chemical products that are essential to modern life and economic development, in a way that helps protect people, the environment and the communities where we operate. This includes mitigating the risks of climate change. Meeting this dual challenge will be even more important in the coming decades as growing populations and global economic expansion are expected to drive energy demand higher. This report provides a summary of the key dimensions of sustainability: our environmental, social and governance (ESG) performance. 5 | Sustainability Report Highlights
4.0M PRODUCTION Natural Gas Natural Gas Liquids Oil UPSTREAM: We are one of the largest producers of oil and natural gas, and have an active presence in 45 countries where we explore, develop, produce and/or market hydrocarbons. 5.5M REFINING + SUPPLY Asphalt Chemical Feedstocks Diesel Fuel Oil Gasoline Jet Fuel Lubricants DOWNSTREAM: We are one of the largest integrated refiners and manufacturers of fuels and lubricants, as well as a leading marketer of petroleum products and finished lubricants. We have refining and lubricant blending facilities in 22 countries. 26.5M CHEMICAL Adhesives & sealants Agriculture Automotive Building & construction Compounding Consumer products Healthcare & medical Hygiene & personal care Industrial applications Lubricants Oil & gas Packaging CHEMICAL : ExxonMobil is one of the largest chemical companies. We have manufacturing operations in 12 countries and a unique portfolio of high-performance products. CRUDE OIL AND NATURAL GAS FEEDSTOCKS oil-equivalent barrels of net oil and gas production per day † barrels of petroleum product sales per day ‡ tonnes of chemical prime product sales ‡ ExxonMobil maintains a diverse portfolio of resources, projects and assets across our businesses. 2019 global operations 6 | Sustainability Report Highlights
Communities Customers Employees Governments Nongovernmental organizations Shareholders Suppliers Stakeholder groups Common areas of interest ExxonMobil works to foster mutual understanding, trust and cooperation with stakeholder groups on sustainability topics. We interact with a variety of stakeholders via community meetings, digital and social media, and one-on-one discussions. Maintaining an open dialogue provides opportunities to listen to concerns, discuss approaches and share plans. Across stakeholder groups, from communities and nongovernmental organizations to employees and shareholders, we continue to see broad interest in our environmental, social and governance performance. The table below highlights our key stakeholder groups, their typical areas of interest and our engagement approach. Stakeholder engagement Communicate with local residents in areas where we operate through direct correspondence and group meetings Dedicate personnel responsible for community engagement, as well as receiving, tracking, analyzing and responding to potential community concerns Establish channels for communities to provide input or seek information Use social media platforms to share project updates Contributed $253 million to communities around the world in 2019 Air emissions Community investments Economic development Education Employment opportunities Environmental performance Grievance management Human rights Operational impacts Collaborate with our customers to identify potential solutions to sustainability issues Cultivate an open dialogue with our customers and educate them about the market-based approach to sustainable solutions Provide customer service contact numbers and support marketing teams in responding to customer questions Developing innovative products and technology Safety Supply chain management Sustainability and environmental performance Support the professional development of our employees globally Invest in worker health by providing voluntary health programs Share feedback and raise topics of interest through managers, internal surveys, company forums and a confidential hotline Support employee-led resource groups that foster a culture of diversity and inclusion Use social media platforms to share information Benefits Diversity and inclusion Health and wellness Professional development Safety Workplace security Engage host governments to maintain the safety and security of operations while respecting human rights Monitor and participate in transparency initiatives in countries where we operate Meet with representatives and leaders to provide information and insights on policies that may affect our business Work to support responsible economic, energy and environmental policies and help identify solutions Energy supply and security Environmental performance Climate change Employment opportunities Ethics and integrity Impact assessments Local supplier development Safety Taxes and other revenue sources Human rights Health and wellness Diversity and inclusion Education Collaborate on technical projects of mutual interest Conduct one-on-one meetings Engage in corporate and foundation philanthropic activities with nongovernmental organizations Participate in conference events to exchange views, information and expertise Participate in multi-stakeholder initiatives to enable progress on key policy issues Partner with grantees to improve health, education and job opportunities in local communities Climate change Environmental performance Human rights Social issues Transparency Economic development Health Education Engage directly with shareholders to understand input and feedback, including shareholder proposals Disseminate information to our shareholders through SEC filings, investor days, investor presentations and other publications Enable engagement between non-employee directors and shareholders, and facilitate communication from any interested party to non-employee directors via our corporate governance page Host annual shareholder meetings to share information on company highlights and answer questions from shareholders Board composition Business performance Climate change Environmental performance Governance practices Policy engagement Risk management Hold sessions with suppliers to provide information on our safety, environmental and human rights practices Participate in organizations dedicated to building local supplier capabilities Share our supplier, vendor and contractor expectations Conduct regular supplier audits and anti-corruption due diligence in relevant countries Support U.S. businesses owned by traditionally underrepresented groups through our U.S. supplier diversity database and supplier forums Local business opportunities Local supplier development Operational integrity Safety Environmental performance Expectations for suppliers Diversity and inclusion Supplier training Human rights Engagement approach 7 | Sustainability Report Highlights
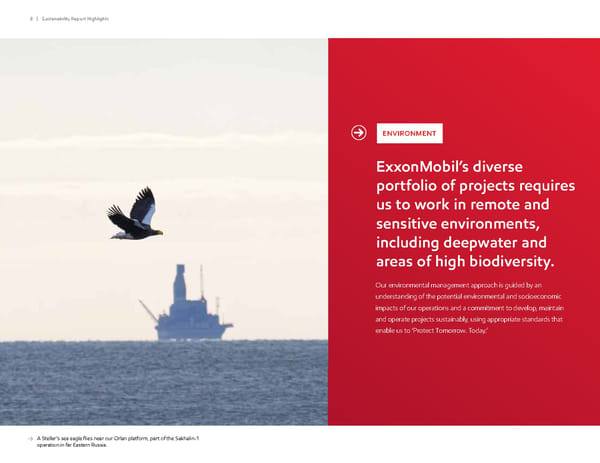
ExxonMobil’s diverse portfolio of projects requires us to work in remote and sensitive environments, including deepwater and areas of high biodiversity. Our environmental management approach is guided by an understanding of the potential environmental and socioeconomic impacts of our operations and a commitment to develop, maintain and operate projects sustainably, using appropriate standards that enable us to ‘Protect Tomorrow. Today.’ ENVIRONMENT A Steller’s sea eagle flies near our Orlan platform, part of the Sakhalin-1 operation in far Eastern Russia. 8 | Sustainability Report Highlights
ENVIRONMENT EXCERPT: EXXONMOBIL 2021 ENERGY & CARBON SUMMARY About the Energy & Carbon Summary The Energy & Carbon Summary outlines ExxonMobil’s approach to managing climate risks, including Board of Directors oversight, technology investments and actions to reduce greenhouse gas emissions. It highlights the Company’s commitment to advancing sustainable, effective solutions that address the world’s growing demand for energy and the risks of climate change. Positioning for a lower-carbon energy future Under most third-party scenarios that meet the objectives of the Paris Agreement, oil and natural gas continue to play a significant role for decades in meeting increasing energy demand of a growing and more prosperous global population. ExxonMobil will play an important role in meeting society’s need for energy and at the same time is committed to supporting efforts to mitigate the risk of climate change, as reflected in the four pillars of the Company’s climate strategy: • Mitigating emissions in Company operations. • Providing products to help customers reduce their emissions. • Developing and deploying scalable technology solutions. • Proactively engaging on climate-related policy. • ExxonMobil’s greenhouse gas emissions have declined approximately 5 percent from 2010 to 2019 due to energy efficiency improvements, and reductions in flaring, venting and fugitive emissions. • At year-end 2020, the Company expected to achieve the emission reduction goals outlined in 2018. These included: – 15 percent reduction in methane emissions versus 2016 levels, and – 25 percent reduction in flaring versus 2016 levels. • The Company aims for industry-leading greenhouse gas performance across its businesses by 2030, and recently announced new emission reduction plans for 2025, which are projected to be consistent with the goals of the Paris Agreement. • The 2025 plans include a 15 to 20 percent reduction in greenhouse gas intensity of upstream operations compared to 2016 levels. This will be supported by a: – 40 to 50 percent reduction in methane intensity, and – 35 to 45 percent reduction in flaring intensity. • The Company’s upstream operations also plan to align with the World Bank’s initiative to eliminate routine flaring by 2030. • The 2025 emission reduction plans are expected to reduce absolute greenhouse gas emissions by an estimated 30 percent for the Company’s upstream business. Similarly, absolute flaring and methane emissions are expected to decrease by 40 to 50 percent. The emission reduction plans cover Scope 1 and Scope 2 emissions from assets operated by the Company. ExxonMobil has a long history of responsibly meeting society‘s evolving need for energy in a reliable and sustainable manner. With a longstanding commitment to investments in technology and the ingenuity of its people, the Company is well positioned to continue to provide the energy that is essential to improving lives around the world, while managing the risks of climate change. Mitigating emissions in Company operations EXXONMOBIL’S CLIMATE STRATEGY 9 | Sustainability Report Highlights For more information, visit exxonmobil.com/energycarbonsummary .
ENVIRONMENT EXCERPT: EXXONMOBIL 2021 ENERGY & CARBON SUMMARY 10 | Sustainability Report Highlights For more information, visit exxonmobil.com/energycarbonsummary . • The Company continues to engage in efforts to encourage sound and constructive policy solutions that reduce climate-related risks across the economy at the lowest cost to society, such as supporting the regulation of methane from new and existing sources. • ExxonMobil is responding to product demand growth by delivering solutions that enable customers to meet product performance requirements while reducing greenhouse gas emissions. These products and solutions include: natural gas, lightweight materials and packaging, and advanced fuels and lubricants. • Recognizing climate change is a global issue that requires collaboration among governments, private companies, consumers and other stakeholders to create meaningful solutions, ExxonMobil has participated in the Intergovernmental Panel on Climate Change (IPCC) since its inception in 1988, is a founding member of the Climate Leadership Council, and is part of the Oil and Gas Climate Initiative. • Commercially viable technology advances are required to achieve the Paris Agreement objectives. ExxonMobil’s sustained investment in research and development is focused on society’s highest-emitting sectors of industrial, power generation and commercial transportation, which together account for 80 percent of global CO 2 emissions, and for which the current solution set is insufficient. • ExxonMobil is working to develop breakthrough solutions in areas such as carbon capture, biofuels, hydrogen and energy-efficient process technology. • Over the past two decades, ExxonMobil has invested more than $10 billion to research, develop and deploy lower-emission energy solutions, resulting in highly efficient operations that have eliminated or avoided approximately 480 million tonnes of CO 2 emissions – the equivalent of taking 100 million passenger vehicles off the road for a year. Providing products to help customers reduce their emissions Proactively engaging on climate-related policy Developing and deploying scalable technology solutions EXXONMOBIL’S CLIMATE STRATEGY, continued Governance and oversight Strong governance is essential to the long-term viability of ExxonMobil’s business. Within the Company’s robust governance framework, a rigorous risk-management approach is applied to identify and address risks associated with the business. Importantly, the Board of Directors and its various committees are highly engaged and have oversight of risk management, including as it applies to climate. The Board regularly receives updates from internal and third-party experts on climate science and policy, evaluates climate risk in the context of overall enterprise risk, including other operational, strategic and financial risks, and considers the interactions among these factors, which includes in-depth analyses by Board committees. Conclusion The 2021 Energy & Carbon Summary contains additional detail on all of the areas described above. It updates and enhances last year’s report, and includes a Frequently Asked Questions section as well as metrics, annual Scope 1 and Scope 2 emission data, and a new provision of Scope 3 emissions. ExxonMobil supports the aims of the 2015 Paris Agreement and efforts to achieve net-zero emissions. The pillars of ExxonMobil’s climate strategy, the investments the Company is making in lower-emission technologies, and the actions taken to reduce emissions across its operations are consistent with these global efforts. ExxonMobil strives to deliver superior results while providing products and services that are essential to the health and welfare of billions of people around the world. The Company is committed to providing reliable and affordable energy to support human progress while advancing effective solutions that address the risks of climate change. ExxonMobil is working to be part of the solution.
11 | Sustainability Report Highlights Plastics are important to our society and should never end up as litter in our environment. Plastic waste management ExxonMobil shares society’s concern about plastic waste in the environment. Plastics provide significant sustainability benefits versus alternative materials and will continue to play an important role in helping society mitigate greenhouse gas emissions (see sidebar, page 13). They should not end up as litter, either in our oceans or anywhere else in the environment. Industry, governments, nongovernmental organizations and consumers must work collaboratively to encourage appropriate recycling, reuse and recovery of plastic waste. Demand for plastics is increasing around the world at rates greater than GDP, due to the rapid growth in the global middle class and the many benefits that plastics bring to society. For example, plastics help provide for the safe production, distribution and preservation of food and water. They help reduce the weight of automobiles to improve fuel efficiency, which enables consumers to reduce their environmental footprint. And they are critical components to many life-saving products in the medical industry, including facemasks, shields and gowns for medical professionals treating patients with COVID-19 and other medical conditions (see case study, page 34). Plastic waste in the environment is part of a larger issue related to global waste management infrastructure. At least 3 billion people worldwide lack access to formal waste disposal facilities. As a result, a significant amount of solid waste makes its way into the environment. According to a 2018 estimate from the World Bank, about 12 percent of the global municipal solid waste stream is plastic. ExxonMobil is taking action to help address plastic waste in the environment by increasing plastic recyclability and supporting improvements in plastic waste recovery, for example, through our founding membership in the Alliance to End Plastic Waste . We are also working on advanced recycling solutions that create and capture value from plastic waste with opportunities for lower overall greenhouse gas emissions over the full life cycle of the plastic. In addition, minimizing pellet loss from our operations is integral to our commitment to responsible operations. ENVIRONMENT
12 | Sustainability Report Highlights Increasing plastic recyclability ExxonMobil is creating innovative products that help society reduce plastic waste by meeting consumers’ performance needs with less material, developing new materials for packaging that is more easily recycled, and enabling customers to increase their recycled content. For example, our Vistamaxx TM performance polymers increase our customers’ ability to use recycled materials, while also improving toughness and tear resistance. Our products can be used to make full polyethylene laminated pouches that are more easily recyclable and can replace difficult-to-recycle conventional multilayer packaging in non-food applications such as detergents and dishwasher pods, while retaining packaging performance benefits. And our performance polyethylene resins enable our customers to meet their performance needs with thinner, lighter-weight products, which require less resource. Assessing advanced recycling technology Plastics have value throughout their life cycle, including at the end of their life. Both traditional and advanced recycling processes are needed to help society maximize the value captured from plastic waste, but there are some limitations with traditional recycling as currently configured. Traditional mechanical recycling – grinding discarded plastic and melting it together with new plastic – is an efficient approach where waste is well sorted and for waste products that are made predominantly from one type of plastic. However, each time plastic is recycled via traditional processes, it loses some of its performance benefits. In addition, it is difficult to remove contaminants from traditional recycling processes, an important consideration for food and health care applications. Our employees monitor the production, loading and storage of plastic pellets at all our resin-handling facilities to minimize plastic pellet loss.
13 | Sustainability Report Highlights Lorem ipsum dolar sit etium apparatus dolar sit etium montrimonii, catherdas sinosous. Advanced recycling involves breaking down plastic waste into its molecular building blocks. This approach effectively transforms plastic waste into the raw materials that are used in the process of making virgin-quality plastic and other valuable products. ExxonMobil believes advanced recycling is a necessary complement to traditional recycling for several reasons: • Advanced recycling enables society to capture more value from a broader range of products and provides more flexibility in sorting and separation processes. • There are no evident technical limitations regarding how many times a plastic product can be put through these processes. • Advanced recycling helps remove contaminants from used plastic. • Advanced recycling provides opportunities for lower overall greenhouse gas emissions over the full life cycle of the plastic. ExxonMobil is working on technology to help enable and accelerate large-scale advanced recycling solutions that could address certain limitations of traditional recycling and do so in an economically feasible way. Leveraging our expertise in research and development and molecule management, we are developing options for integrating advanced recycling solutions at our petrochemical facilities. We expect this will lead to more mixed and soiled plastic waste being recovered and used to make high- value raw materials safely, reliably and economically, at scale. We are doing this without diminishing our commitment to developing products that are easier to recycle via traditional recycling methods. Supporting improvements in plastic waste recovery As economies grow, society’s commitment to waste management systems must expand to enable the appropriate collection, sorting and processing of waste to minimize environmental impact. These infrastructure enhancements are needed for all types of municipal solid waste, not just plastic. However, increasing plastic recycling rates and converting plastic waste into a broad range of valuable products could unlock value and help offset some of the costs of improvements to waste collection and sorting infrastructure. Environmental benefits of plastics relative to alternative materials While ExxonMobil agrees there is no place for plastic waste in the environment, the environmental benefits of plastic are clear. Calls to replace plastic packaging with alternative materials can often have unintended negative environmental impacts. For example: According to a 2011 U.K. Environment Agency study , a cotton tote bag would need to be used 131 times to have a lower full life cycle emissions impact than using a typical plastic grocery bag once. A 2016 TruCost study found that substituting plastic in consumer products packaging with alternatives that perform the same function would have nearly four times the negative impact on the environment on a full life cycle basis. A 2018 study by the Denmark Ministry of Environment and Food concluded a paper bag would need to be reused 43 times to have a lower impact on ozone depletion and air and water pollution than the average plastic bag. A 2018 Franklin Associates study in the United States found the manufacturing process for plastics packaging used almost 50 percent less energy and 80 percent less water compared to the manufacturing process for alternate materials.
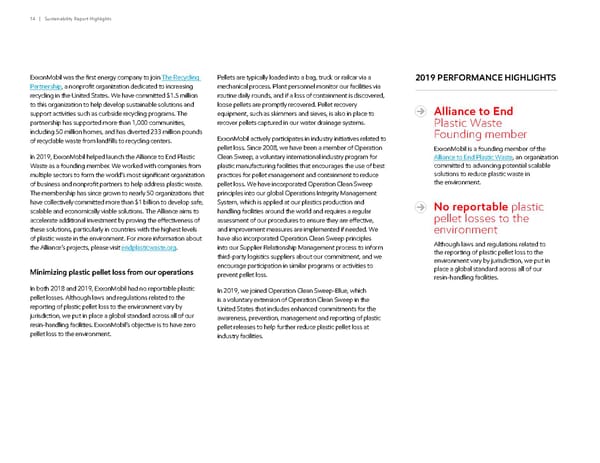
14 | Sustainability Report Highlights ExxonMobil was the first energy company to join The Recycling Partnership , a nonprofit organization dedicated to increasing recycling in the United States. We have committed $1.5 million to this organization to help develop sustainable solutions and support activities such as curbside recycling programs. The partnership has supported more than 1,000 communities, including 50 million homes, and has diverted 233 million pounds of recyclable waste from landfills to recycling centers. In 2019, ExxonMobil helped launch the Alliance to End Plastic Waste as a founding member. We worked with companies from multiple sectors to form the world’s most significant organization of business and nonprofit partners to help address plastic waste. The membership has since grown to nearly 50 organizations that have collectively committed more than $1 billion to develop safe, scalable and economically viable solutions. The Alliance aims to accelerate additional investment by proving the effectiveness of these solutions, particularly in countries with the highest levels of plastic waste in the environment. For more information about the Alliance’s projects, please visit endplasticwaste.org . Minimizing plastic pellet loss from our operations In both 2018 and 2019, ExxonMobil had no reportable plastic pellet losses. Although laws and regulations related to the reporting of plastic pellet loss to the environment vary by jurisdiction, we put in place a global standard across all of our resin-handling facilities. ExxonMobil’s objective is to have zero pellet loss to the environment. 2019 PERFORMANCE HIGHLIGHTS Alliance to End Plastic Waste Founding member ExxonMobil is a founding member of the Alliance to End Plastic Waste , an organization committed to advancing potential scalable solutions to reduce plastic waste in the environment. No reportable plastic pellet losses to the environment Although laws and regulations related to the reporting of plastic pellet loss to the environment vary by jurisdiction, we put in place a global standard across all of our resin-handling facilities. Pellets are typically loaded into a bag, truck or railcar via a mechanical process. Plant personnel monitor our facilities via routine daily rounds, and if a loss of containment is discovered, loose pellets are promptly recovered. Pellet recovery equipment, such as skimmers and sieves, is also in place to recover pellets captured in our water drainage systems. ExxonMobil actively participates in industry initiatives related to pellet loss. Since 2008, we have been a member of Operation Clean Sweep, a voluntary international industry program for plastic manufacturing facilities that encourages the use of best practices for pellet management and containment to reduce pellet loss. We have incorporated Operation Clean Sweep principles into our global Operations Integrity Management System, which is applied at our plastics production and handling facilities around the world and requires a regular assessment of our procedures to ensure they are effective, and improvement measures are implemented if needed. We have also incorporated Operation Clean Sweep principles into our Supplier Relationship Management process to inform third-party logistics suppliers about our commitment, and we encourage participation in similar programs or activities to prevent pellet loss. In 2019, we joined Operation Clean Sweep-Blue, which is a voluntary extension of Operation Clean Sweep in the United States that includes enhanced commitments for the awareness, prevention, management and reporting of plastic pellet releases to help further reduce plastic pellet loss at industry facilities.
Around the world, ExxonMobil aims to be a preferred business partner, neighbor, employer and supplier. We maintain a corporate-wide commitment to safeguarding the health and security of our employees and the public, responsibly managing our social impacts, and upholding respect for human rights in our operations. SOCIAL ExxonMobil employees worked with strategic partners and contractors from around the world to build the Floating Production Storage and Offloading platform (FPSO) Liza Destiny in Singapore and deliver it offshore Guyana. 15 | Sustainability Report Highlights
ExxonMobil remains focused on achieving a work environment where Nobody Gets Hurt . Safety is a core value at ExxonMobil. We operate in a manner that helps protect our employees, contractors, customers and the communities where we operate. Our approach to safety includes identifying possible risks, implementing measures to prevent potential incidents, and educating employees and contractors about unsafe behaviors. For 27 years, our Operations Integrity Management System (OIMS) has established a set of worldwide expectations for addressing risks inherent to our business, including safety risks. Our work procedures embed OIMS into our everyday work processes at all levels of the organization. Personnel safety From a Lost-Time Incident Rate (LTIR) perspective, our workforce remains significantly safer than the industry as a whole. XTO Energy, our unconventional exploration and production unit, continued its year-on-year improvement trend and achieved its best-ever LTIR results in 2019. Our Fuels & Lubricants and Chemical businesses continue to outperform their respective industry benchmarks. In 2019, we enhanced our focus on defining consistent Life Saving Actions, or safeguards, for higher-consequence work associated with lifting and rigging, and with work around mobile equipment. These actions are applicable to day-to-day activities where ExxonMobil and industry experience has shown tragic personnel safety outcomes still occur. SOCIAL 16 | Sustainability Report Highlights We continually monitor operations to help keep our employees safe and secure. Safety
ExxonMobil employees regularly attend specialized trainings, often with local firefighters and other first responders, to help ensure preparedness in case of an emergency. We work with our employees and contractors to understand Life Saving Actions for these higher-consequence activities and how to verify critical, effective safeguards are in place before the work begins and during execution. With our focus on eliminating the most serious incidents, we extended a steady multiyear improvement trend in 2019, while also achieving a historically low rate of high-consequence injuries. Process safety ExxonMobil has an unwavering commitment to helping protect our people, the community and the environment by seeking to manage the risks inherent to our operations. Our Operations Integrity Management System (OIMS) serves as the foundation for managing process safety risks and establishes clear process safety expectations, which are distributed throughout our management systems. The safeguards needed to protect against process safety risks are built into OIMS and integral to the way our facilities are designed, operated and maintained. We verify and rigorously maintain these safeguards to prevent or mitigate the consequences of a process safety event. We collaborate with our peers and industry associations to share lessons learned. For example, we are actively engaged in the Advancing Process Safety initiative, a collaborative effort between the American Fuel and Petrochemical Manufacturers and the American Petroleum Institute. The initiative aims to improve process safety performance across industry by sharing experiences and knowledge about process safety events, hazard identification metrics and industry-proven practices. 17 | Sustainability Report Highlights
2019 PERFORMANCE HIGHLIGHTS ~80% improvement in lost-time incident rate since 2000 Since 2000, we have achieved a nearly 80 percent improvement in our workforce lost-time incident rate. 27 years of OIMS For 27 years, our Operations Integrity Management System has established a set of worldwide expectations for addressing risks inherent to our business, including safety risks. Lost-time incident rate* Lost-time incident rate* Incidents per 200,000 work hours 0.20 0.15 0.10 0.05 0 2010 2011 2012 2013 2014 2016 2015 2017 2018 2019 ExxonMobil workforce *Incidents include injuries and illnesses. We base our safety data on information available at the time of publication. Workforce includes employees and contractors. Depending on the reporting year, around 2 to 12 percent of the lost-time incidents are illness-related. ExxonMobil’s 2019 total workforce (employees and contractors) lost-time incident rate per 200,000 work hours was 0.033, similar to our performance in 2018. In 2019, our employee total lost-time incident rate per 200,000 work hours was 0.031 and our contractor lost-time incident rate per 200,000 work hours was 0.034. When compared with the American Petroleum Institute U.S. petroleum industry workforce benchmark, ExxonMobil continues to be among the industry leaders in safety performance. American Petroleum Institute U.S. petroleum industry workforce benchmark Year ExxonMobil workforce American Petroleum Institute U.S. petroleum industry workforce benchmark "2010" 0.038 0.128 "2011" 0.077 0.121 "2012" 0.046 0.108 "2013" 0.044 0.118 "2014” 0.031 0.107 "2015" 0.035 0.089 "2016" 0.029 0.084 "2017" 0.029 0.029 "2018" 0.033 0.033 "2019" 0.033 0.033 DATA AS OF 6/01/2020 Lost-time incident rate* Incidents per 200,000 work hours 0.20 0.15 0.10 0.05 0 2010 2011 2012 2013 2014 2016 2015 2017 2018 2019 ExxonMobil workforce *Incidents include injuries and illnesses. We base our safety data on information available at the time of publication. Workforce includes employees and contractors. Depending on the reporting year, around 2 to 12 percent of the lost-time incidents are illness-related. ExxonMobil’s 2019 total workforce (employees and contractors) lost-time incident rate per 200,000 work hours was 0.033, similar to our performance in 2018. In 2019, our employee total lost-time incident rate per 200,000 work hours was 0.031 and our contractor lost-time incident rate per 200,000 work hours was 0.034. When compared with the American Petroleum Institute U.S. petroleum industry workforce benchmark, ExxonMobil continues to be among the industry leaders in safety performance. American Petroleum Institute U.S. petroleum industry workforce benchmark Year ExxonMobil workforce American Petroleum Institute U.S. petroleum industry workforce benchmark "2010" 0.038 0.128 "2011" 0.077 0.121 "2012" 0.046 0.108 "2013" 0.044 0.118 "2014” 0.031 0.107 "2015" 0.035 0.089 "2016" 0.029 0.084 "2017" 0.029 0.029 "2018" 0.033 0.033 "2019" 0.033 0.033 DATA AS OF 6/01/2020 Emergency preparedness ExxonMobil is prepared to respond to a wide array of emergency events, including natural disasters, pandemics and operational incidents. Regardless of the size, severity or cause of an event, each ExxonMobil facility and business unit has access to trained responders and resources. Cross-functional teams develop and practice emergency response tactics through incident management teams and emergency support groups around the world. This preparation enables ExxonMobil’s global operations to provide a robust response in emergency situations to help protect the safety of people and the environment. In 2019, we carried out a Regional Response Team exercise in Egypt to demonstrate the readiness to plan and execute real-time field deployments effectively, based on the response actions included in the Egyptian National Oil Spill Contingency Plan. With more than 150 participants representing 27 countries, the five- day exercise strengthened alignment on response objectives between key stakeholders and the Regional Response Team. 18 | Sustainability Report Highlights
Healthy and engaged workforce Worksite health and wellness The success of ExxonMobil’s operations depends on a healthy and competent workforce. Our health policy communicates corporate expectations for identifying and managing health risks related to our operations. In each country, we develop workplace health programs that consider local health care systems and health needs. Improvements in worker health can increase quality of life and employee productivity. ExxonMobil supports voluntary health programs that promote employee well-being while reducing health-plan costs. Through our Culture of Health program, we provide employees with health education, disease management assistance, resilience training and fitness programs. We have implemented the Culture of Health program in 30 countries, and we continue to look for new opportunities to expand the program’s reach. We have recently added programs in Canada, Chad, Colombia, Equatorial Guinea, France, Germany, Guam and New Caledonia. When the COVID-19 pandemic emerged in early 2020, our emergency preparedness and response procedures were triggered at the country, regional and facility levels, building on lessons learned from SARS, Pandemic Flu, MERS and Ebola. Our preventive and mitigation safeguards, combined with coordinated internal communications, helped protect the health and safety of our workers and their dependents. Where appropriate, we implemented remote-work policies while our facilities were deep cleaned and reconfigured to enable proper social distancing. Our measures were continually refined as more information about the virus was identified, in consultation with internal and external health experts. SOCIAL 19 | Sustainability Report Highlights In collaboration with the Alberta Health Services, we conducted on-site COVID-19 testing at our Kearl operations in Canada.
20 | Sustainability Report Highlights Diversity and inclusion Diversity of thought, ideas, perspectives, skill, knowledge and culture makes ExxonMobil more innovative, resilient and better able to navigate the complex and changing global energy business. Creating an inclusive workplace enables our global employees to bring their unique perspectives to help achieve our business objectives. Our global workforce reflects the local communities and cultures where we operate. Our objectives are to seek and hire talented, dedicated employees and give them opportunities to learn, grow and succeed. The result is a diverse and multifaceted employee base representing different perspectives and ideas. We consider and monitor diversity through all stages of employment, including recruitment, training and development of our employees. For example, in 2019, 36 percent of our campus engineering hires in the United States were women, and 40 percent were minorities. Both rates are higher than the average annual percentage of female engineering graduates and minority engineering graduates, respectively. Over the past decade, 39 percent of our global management, professional and technical hires were female, and 31 percent of our U.S. management, professional and technical hires were minorities. In 2019, 22 percent of ExxonMobil’s global executive employee population were women, and 18 percent of our U.S. executives were minorities. Culture of Health program in 30 countries We have implemented the Culture of Health program in 30 countries, and we continue to look for new opportunities to expand the program’s reach. Representation of women executives increased 69% since 2009 In 2019, 22 percent of ExxonMobil’s executives were women vs. 13 percent in 2009. Representation of minority executives in the U.S. increased 80% since 2009 In 2019, 18 percent of ExxonMobil’s U.S. executives were minorities vs. 10 percent in 2009. More than 30 years of service Career employees at ExxonMobil average more than 30 years of service. 2019 PERFORMANCE HIGHLIGHTS ExxonMobil actively fosters a productive work environment where individual and cultural differences are respected and valued, and where all employees are encouraged to contribute fully to achieving business results.
21 | Sustainability Report Highlights Our Global Diversity Framework and Standards of Business Conduct govern ExxonMobil employment practices, including policies for recruitment, hiring, promotions and salary administration. The standards support our commitment to provide equal employment opportunities, prohibit discrimination in the workplace and align with applicable laws in the countries where we operate. We use a series of training programs and tools to help our employees understand cultural sensitivities across a diverse workforce. We do not tolerate harassment in any form, and violators of this policy are subject to disciplinary action, up to and including termination. Employee recruitment and retention ExxonMobil prioritizes the development of employees. We begin with recruiting exceptional talent and continue with individually planned assignments and experiences that lead to broad skill development and a deep understanding of our businesses. This career-oriented, tailored approach results in an average length of service of more than 30 years for career employees. It also facilitates development of the next generation of leaders from within the company. ExxonMobil invests in people for a long-term career. Through a combination of work assignments, on-the-job experiences, and focused training and education, employees acquire the necessary skills and competencies to take on increasing levels of responsibility and job complexity. We have invested an average of $93 million per year on training since 2015. In 2019, more than 60,000 personnel completed voluntary training courses. We recruit exceptional people and give them personalized career plans and unique experiences, which leads to an average length of service of more than 30 years for career employees.
Our business presence should have a positive influence on the people in the communities where we operate. Through our livelihood support programs, we are helping to build the capacity of communities and enhance the livelihoods of Papua New Guineans in our project areas. SOCIAL 22 | Sustainability Report Highlights Human rights ExxonMobil is committed to respecting human rights as a fundamental principle in our operations, reinforced through training and integrated into our policies and practices. Our business presence should have a positive influence on the people in the communities where we operate. Our practices reflect the spirit and intent of the United Nations’ Universal Declaration of Human Rights and are guided by elements of the United Nations’ Guiding Principles on Business and Human Rights . ExxonMobil conducts human rights training to help build an understanding of human rights and an awareness of potential human rights risks. More than 1,800 employees in applicable positions and locations across 49 countries have completed the training since 2015. We use a risk screening tool to assess potential human rights impacts associated with our activities, and we integrate it with our Environmental, Socioeconomic and Health Impact Assessment and Management process so risks are appropriately assessed, mitigated and tracked. Our processes for stakeholder engagement and grievance management support our integrated approach to human rights due diligence. Through our grievance management process, for example, we help provide effective, accessible and culturally appropriate channels for individuals or communities to raise concerns, whether through community engagements, electronic or in-person submission, or third parties such as civil society organizations or nongovernmental organizations. We then work to manage, respond to and, ideally, resolve issues in a timely manner, as appropriate. Our efforts to manage human rights issues reflect evolving international initiatives. We are actively involved with IPIECA, the global oil and gas industry association for advancing environmental and social issues, to monitor business and human rights trends. Our engagement also includes developing and sharing practices on human rights due diligence and human rights supply chain management from the oil and natural gas industry and other extractive industries. In 2019, ExxonMobil contributed to the new edition of the Sustainability Reporting Guidance for the Oil and Gas Industry , jointly developed by IPIECA, the American Petroleum Institute, and the International Association of Oil and Gas Producers. We were actively engaged in the development of the expanded social performance section, which embeds human rights considerations throughout the sustainability reporting guidance.
Security and human rights ExxonMobil’s Statement of Principles on Security and Human Rights establishes the expectation that all business units provide security for personnel, facilities and operations in a manner that respects human rights. The framework guides our majority-owned operating affiliates on how to manage interactions with both host government-assigned security and private security providers. It also provides guidance for documenting allegations of human rights abuse by public or private security personnel and any incidents of inappropriate physical force used by security providers in the protection of company assets. Depending on the nature of an incident, our procedures include reporting to host governments. Where appropriate, our standard security services contracts include provisions requiring that personnel receive training to understand the expectations and their responsibilities with respect to the following: • ExxonMobil’s Statement of Principles on Security and Human Rights • Local laws and regulations • Provisions of the Universal Declaration on Human Rights • International Labour Organization’s 1998 Declaration on Fundamental Principles and Rights at Work • U.N. Code of Conduct for Law Enforcement Officials • U.N. Principles on the Use of Force and Firearms by Law Enforcement Officials These standard security services contract provisions require contractors to monitor, report and investigate allegations of credible human rights abuse. Contractors are required to immediately remove any of their personnel credibly alleged to have committed a human rights abuse. Since 2016, we have helped train nearly 29,000 security providers on the Voluntary Principles on Security and Human Rights, a multi-stakeholder initiative that focuses on ways to maintain the safety and security of operations while respecting human rights. Using the Voluntary Principles to train on-the-ground security personnel can help reduce human rights risks. 23 | Sustainability Report Highlights Since 2016, we have helped train nearly 29,000 security providers on the Voluntary Principles on Security and Human Rights.
2019 PERFORMANCE HIGHLIGHTS Human rights training in 49 countries since 2015 Since 2015, more than 1,800 employees in applicable positions and locations across 49 countries have completed our human rights training module. Utilized a risk screening tool We use a risk screening tool prior to conducting broader Environmental, Socioeconomic and Health Impact Assessments to assess potential human rights impacts. ~29K trained on Voluntary Principles on Security and Human Rights since 2016 We have helped train nearly 29,000 security providers on the Voluntary Principles on Security and Human Rights to reduce human rights risks associated with security activities in communities. 24 | Sustainability Report Highlights 24 | Sustainability Report Highlights In some instances, host governments require ExxonMobil to engage their security forces. In these cases, we have signed agreements with governments that include expectations for respecting human rights consistent with the Voluntary Principles, as well as compliance with relevant local, U.N. and other security-related frameworks. We have agreements in place in Chad, Colombia, Indonesia, Mozambique and Papua New Guinea. We developed targeted training modules in 2019 for ExxonMobil personnel in global affiliates where host government security forces are engaged. The training focuses on our expectations for host government security deployment, including identifying the risks of security-related human rights impacts in communities. Human rights in the supply chain ExxonMobil is committed to respecting human rights, and we expect the same of our suppliers. Our Supplier Expectations include our expectations of suppliers, vendors and contractors with regards to human rights. These expectations include references to key international human rights frameworks, such as the United Nations’ Guiding Principles on Business and Human Rights and the International Labour Organization’s 1998 Declaration on Fundamental Principles and Rights at Work. We reiterate our expectations on human rights to our suppliers through an annual letter to suppliers. We also comply with all relevant laws and regulations regarding human rights. For example, in compliance with the U.K. Modern Slavery Act 2015, we prepare an annual slavery and human trafficking statement . Also, our annual conflict minerals filing to the U.S. Securities and Exchange Commission provides disclosures regarding supply sources of gold, tin, tungsten and tantalum. Additionally, since 2016, more than 300 procurement employees have received human rights awareness training, tailored to procurement professionals, to help improve their understanding of human rights in the supply chain. For information on supply chain management, including supplier diversity, please visit our website .
Community investments ExxonMobil works closely with the communities where we operate to identify and invest in initiatives that help support their needs. We collaborate with governments and local stakeholders to invest in programs that promote local economic growth and help improve social conditions. Local economic growth and development ExxonMobil adds economic value to countries where we operate by employing and training local personnel and supporting local suppliers. We also build capacity of local suppliers to increase their capabilities and work to create a competitive local industrial base. We develop a local content plan specific to each country or area to establish long-term economic benefits. When we hire local employees, they may receive additional training to develop technical and leadership skills, improving their overall employability. Our development program includes training on relevant technical and vocational skills, health and safety, environmental protection, management skills and business conduct. For example, providing opportunities for local hiring and development is a vital part of our commitment to enhancing the economic and social benefits associated with our activities in Guyana. We apply proven training curriculums, industry best practices and leading technology to support local workforce development. In 2019, our affiliate’s activities in Guyana increased the total workforce to more than 3,400 employees and contractors, of which nearly 1,900 are Guyanese. Our goal is to provide Guyanese personnel with technical and professional skills needed for existing and future operations. ExxonMobil and our contractors provided more than 250,000 hours of training to individuals working on our projects in Guyana in 2019. 25 | Sustainability Report Highlights EQUATORIAL GUINEA ANGOLA INDONESIA GUYANA MALAYSIA NIGERIA PAPUA NEW GUINEA Employees locally hired in supervisory or managerial positions Employees locally hired CHAD 48 % 83 % 91 % 03 % 87 % 88 % 18 % 87 % 82 % 93 % 97 % 58 % 97 % 94 % 69 % 94 % 2019 workforce composition SOCIAL In December 2019, ExxonMobil announced oil production had started from the Liza field offshore Guyana, a first for the country of 750,000 people. At year-end 2019, more than 50 percent of ExxonMobil’s employees in Guyana were Guyanese.
We temporarily reconfigured manufacturing operations at our facilities in Baton Rouge, Louisiana, to give us the ability to produce, blend, package and distribute hand sanitizer. Social investments Our social investments address key needs, such as access to health care, disaster relief, education and economic development. In 2019, we contributed $253 million to communities around the world, which includes donations from Exxon Mobil Corporation, our divisions and affiliates, the ExxonMobil Foundation, employee and retiree giving through ExxonMobil’s matching gift and volunteer programs, and disaster relief. For example, in 2019, when Cyclones Idai and Kenneth impacted Mozambique, we provided $400,000 in emergency assistance to support ongoing relief and recovery efforts, including the provision of food and shelter in affected communities. We are also actively involved in worldwide support of response efforts related to the COVID-19 pandemic. As a company with operations around the world, our efforts have ranged from donating personal protective equipment and supporting local food banks, to reconfiguring our own operations to produce hand sanitizer. Learn more in our COVID-19 case study on page 34. Our employees are passionate about engaging in their communities, and we encourage them to contribute to the communities where they live and work. Through our volunteer involvement program in the United States, we provide a $500 donation to the employee’s or retiree’s charity of choice for every 20 hours a volunteer works, up to four times per year. Many of our affiliates have similar volunteer programs. More than 17,000 ExxonMobil employees, retirees and their families volunteered approximately 443,000 hours at 3,700 charitable organizations in 28 countries in 2019. More than 4,100 employees and retirees donated more than $18 million to 825 U.S. colleges and universities, as well as minority scholarship programs. The ExxonMobil Foundation matched that amount with more than $33.6 million in 2019. For more information on our work with local communities, please visit our website . 26 | Sustainability Report Highlights >$1.3B contributed to education since 2000 Since 2000, we have contributed more than $1.3 billion to education programs around the world, including approximately $59 million in 2019. >125M people reached through malaria programs Since 2000, more than 125 million people have benefited from ExxonMobil-supported programs that focus on malaria research, education and treatment. >$120M invested in women’s economic opportunities Since 2005, we have invested more than $120 million to support women in more than 90 countries to fulfill their economic potential and drive economic change in their communities. 160K gallons of hand sanitizer In 2020, as part of our work to support the response to the COVID-19 pandemic, we temporarily reconfigured manufacturing operations in Louisiana to enable us to produce up to 160,000 gallons of hand sanitizer, which was donated to frontline workers and military personnel. 2019 PERFORMANCE HIGHLIGHTS
$18.3M Canada $73.7M Europe $30.2M Africa/Middle East $9.2M Asia Pacific $117.4M United States $3.7M Central/ South America *Total contributions do not include environmental capital and operating expenditures. $143M Civic & community $61M Higher education $5M Public policy research $11M Pre-college education $17M Health & environment $6M Workforce development/ other education $7M Arts & culture $3M Women’s economic opportunity $253M WORLDWIDE TOTAL Investments by focus area Investments by geographic region In 2019, ExxonMobil contributed $253 million to communities around the world.* Total contributions include donations from Exxon Mobil Corporation, our divisions and affiliates, the ExxonMobil Foundation, as well as employee and retiree giving through ExxonMobil’s matching gift and volunteer programs. 2019 community investments 27 | Sustainability Report Highlights SOCIAL
Good corporate governance creates a business environment conducive to long-term growth. ExxonMobil employs a variety of policies and processes to uphold high ethical standards and promote transparency. Our efforts are underpinned by a board of directors that provides strategic and independent oversight of our corporation’s affairs. GOVERNANCE Members of the ExxonMobil Board of Directors visited its Rotterdam, Netherlands, petrochemical complex and learned about the facility from local employees. 28 | Sustainability Report Highlights
29 | Sustainability Report Highlights Ethics and integrity ExxonMobil strives to uphold high ethical standards at all times and in all aspects of our business. Our Standards of Business Conduct set the ethical conduct expectations for our corporation and majority-owned subsidiaries. Employees must annually confirm they have read and comply with the standards to ensure a consistent understanding. ExxonMobil requires all employees, officers, directors and those working on our behalf to comply with all applicable laws. ExxonMobil encourages employees and contractors to ask questions, voice concerns and report any alleged violations of company policies. In addition to our open-door communication procedures, we have several confidential mechanisms for reporting. Employees can submit concerns through a 24-hour phone hotline or a mailing address. We respect confidentiality, subject to legal requirements, and strictly prohibit retaliation against any employee for submitting concerns. A hotline steering committee reviews reports of suspected violations. The board audit committee, comprising four independent, non-employee directors, oversees accounting and internal control matters for the company, including compliance with legal and regulatory requirements. The board audit committee receives a quarterly report summarizing the steering committee’s findings, including any policy violations. Confirmed violations lead to disciplinary actions, up to and including termination. For more information on the board audit committee, please see the company’s annual proxy statement . ExxonMobil conducts regular internal audits and self-assessments to verify the effectiveness of our control systems and adherence to our Standards of Business Conduct. Our team of internal auditors annually reviews approximately one-third of the corporation’s activities and processes. Internal auditors have access to all operations, records, personnel and properties. We thoroughly investigate any suspected acts of noncompliance with the Standards of Business Conduct. Employees in relevant job functions receive in-person training on antitrust, anti-corruption, anti-boycott, trade sanctions and export controls soon after entering their positions, as well as every year thereafter. In 2019, nearly 24,000 employees and contractors participated in such training. GOVERNANCE 29 | Sustainability Report Highlights ExxonMobil regularly conducts employee training, both in-person and computer- based, to help maintain adherence to our Standards of Business Conduct. 2019 PERFORMANCE HIGHLIGHTS ~24K participated in compliance training Nearly 24,000 employees and contractors participated in compliance training. ~1/3 of activities and processes audited ExxonMobil’s team of internal auditors annually reviews approximately one-third of the corporation’s activities and processes.
Board leadership 30 | Sustainability Report Highlights ExxonMobil’s board of directors provides oversight of the corporation’s affairs. Board members select an independent director to serve as the lead director to help ensure a level of independence in our board leadership. Board members expect the lead director to serve for a minimum of two years. In March 2020, the board clarified and enhanced the role of the presiding director, and renamed the role as lead director. The lead director has broad responsibilities, including: • Calls, chairs and sets the agenda for executive sessions of the non-employee directors; • Provides feedback to the chairman; • Chairs meetings of the board in the absence of the chairman; • In consultation with the chairman, reviews and approves the schedule and agenda for all board meetings and reviews associated materials distributed to the directors; • Reviews committee meeting schedules; • Engages with shareholders, including on ESG-related matters, as appropriate; and • Leads the annual performance evaluation of the board. The lead director also chairs the board affairs committee, which has authorities that include establishing the criteria for director engagement with shareholders, overseeing independent director succession planning, and establishing and maintaining procedures for interested parties to communicate with non-employee directors. The lead director works with the compensation committee to oversee the annual evaluation of the CEO, the communication of resulting feedback to the CEO and the review of CEO succession plans. The board believes shareholder interests are best served through a leadership model combining the roles of chairman of the board and chief executive officer. At year-end 2019, nine of ExxonMobil’s 10 directors were independent as defined by New York Stock Exchange guidelines. In 2019, the board of directors met 10 times. ExxonMobil’s directors, on average, attended approximately 96 percent of board and committee meetings during 2019. The ExxonMobil board of directors, as of May 1, 2020. From left: Angela Braly, Kenneth Frazier, Joseph Hooley ( joined January 2020), Ursula Burns, Samuel Palmisano, Darren Woods, Douglas Oberhelman, Steven Reinemund (since retired), William Weldon, Susan Avery and Steven Kandarian. GOVERNANCE
2019 PERFORMANCE HIGHLIGHTS 9/10 independent directors On average, ExxonMobil’s directors attended approximately 96 percent of board and committee meetings. 44% board diversity At year-end 2019, 44 percent of the board’s independent directors were female and/or a racial/ethnic minority. At year-end 2019, nine of ExxonMobil’s 10 directors were independent as defined by New York Stock Exchange guidelines. The board of directors met 10 times. 10 board meetings 96% board meeting attendance Board diversity ExxonMobil believes the strength and effectiveness of the board reflects the balance, experience and diversity of the individual directors; their commitment; and the ability of the directors to work effectively as a group in carrying out their responsibilities. The board affairs committee recommends board of director candidates in accordance with our Guidelines for the Selection of Non-Employee Directors . The board considers director longevity of service and experience of great value, but recognizes the importance of director refreshment. The average tenure of our non-employee directors as of April 2020 was 6.1 years, below the 2019 average of S&P 500 companies of eight years. The board affairs committee looks for highly qualified, non-employee candidates with demonstrated leadership, competency and a commitment to represent the interests of our shareholders. An independent executive search firm helps identify external candidates for consideration who have: • Achieved prominence in their fields; • A diversity of backgrounds, including gender and racial/ethnic diversity; • Experience and demonstrated expertise in managing large, complex organizations such as that of chief executive officers or senior executives of a large company or organization with global operations; • Expertise in financial and other risk management; • Experience on one or more boards of significant public organizations or nonprofit organizations; • Expertise resulting from significant professional or academically based scientific or research activities; and • Experience with cyclical businesses such as commodities. The board affairs committee considers recommendations from shareholders and board directors to help ensure the selection process is collaborative. At year-end 2019, 44 percent of the board’s independent directors were female and/or a racial/ethnic minority. Board risk oversight and sustainability engagement ExxonMobil’s full board of directors provides oversight of key risks to the company’s business. As a whole, the board reviews litigation and other legal matters; political contributions, budget and policy; lobbying costs; developments in climate science and policy; the company’s work to project future global energy supply and demand, including the Outlook for Energy ; the Energy & Carbon Summary ; stewardship of business performance; and long-term strategic plans. The board receives updates and reviews from internal and external experts on issues of importance to the company. The board oversees a broad spectrum of interrelated risks, with assistance from its committees. This integrated risk management approach facilitates recognition and oversight of important risk interdependencies. Sustainability-related topics typically fall under the purview of the Public Issues and Contributions Committee. The committee oversees operational risks, such as those relating to employee and community safety, health and environmental performance, including actions taken to address climate change-related risks; security matters; and reviews and provides advice on objectives, policies and programs related to political and other contributions. The board, including the Public Issues and Contributions Committee, visits an ExxonMobil operations site each year. These visits enable directors to observe and provide input on safety, operating practices, environmental performance, technology, products, industry and corporate standards, and community engagement. Recently, the independent lead director, along with the full board, provided oversight as management guided the company’s response to the COVID-19 pandemic through a series of actions that helped protect our employees, the communities in which we work and people around the world. To learn more about our COVID-19 response, please see the case study on page 34. 31 | Sustainability Report Highlights
Engaging with governments Transparency in payments to governments ExxonMobil recognizes the importance of disclosing relevant payments to governments to reduce corruption, improve government accountability and promote greater economic stability worldwide. We consider the most successful transparency initiatives are those that: • Apply to all foreign, domestic and state-owned companies; • Protect proprietary information to promote commercial competitiveness; • Comply with international trade conventions and treaties; and • Do not violate host government laws or contractual obligations. ExxonMobil is an original member of the Extractive Industries Transparency Initiative (EITI), a global organization that promotes the accountable management of oil, natural gas and mineral resources. Companies and governments participating in EITI report payments and revenues, which enables EITI to reconcile any differences between the totals and publish validated total government revenues. We actively participate at the EITI secretariat and country levels. Every year, an ExxonMobil representative serves on the EITI board as either a primary or alternate member. We work with several governments that are EITI members, as well as others considering membership. Policy engagement ExxonMobil believes sound public policy should include input from a variety of stakeholders. We recognize public policy decisions made at all levels of government can have significant effects on our current and future operations. We exercise our right to support policies that promote stable investment for long-term business viability. ExxonMobil works in countries around the world and recognizes the importance of transparency and accountability with each of them. GOVERNANCE 32 | Sustainability Report Highlights
ExxonMobil engages with U.S. lawmakers to support responsible economic, energy and environmental policies. Around the world, we engaged on several issues in 2019 to support responsible economic, energy and environmental policies, including: • Free-market policies: A level playing field within our energy markets is vital if consumers and families are to continue to have access to affordable, reliable and safe energy for homes and businesses. Preferential treatment for certain energy sources undermines the market and raises costs for consumers, families and businesses. • Energy infrastructure: In the United States alone, private investments in oil and natural gas infrastructure could exceed $1.3 trillion by 2035, adding 1 million U.S. jobs and increasing gross domestic product by almost $2 trillion, according to a study conducted by global consulting firm IFC, commissioned by the American Petroleum Institute. These infrastructure projects create jobs and deliver energy to market, safely and efficiently. • Regulatory reform: We support efforts to enhance transparency in our regulatory process, minimizing cost and maximizing efficiency. • Trade: ExxonMobil relies on free and fair trade agreements and policies, including, for example, strong investment protection provisions in the U.S.-Mexico-Canada Trade Agreement (USMCA). Providing a level playing field to import and export goods and services ultimately gives consumers greater choice. • Climate: ExxonMobil believes sound policy should address the dual challenge of reducing the risks of climate change at the lowest societal cost, while balancing increased demand for affordable energy and the need to address poverty, education, health and energy security. We work to encourage collaboration across governments, private companies, consumers and other stakeholders to create meaningful solutions to address climate change. For example, we engaged with the EU Commission, both directly and through trade associations, on the development and adoption of the EU methane strategy. U.S. lobbying expenses In 2019, ExxonMobil’s U.S. federal lobbying expenses totaled $9.75 million, as publicly reported in our filings under the Lobbying Disclosure Act. Further information on the federal issues ExxonMobil lobbied in the United States in 2019 is available on our website . We also recently disclosed on our website a list of trade associations to which we paid $100,000 or more and for which a portion of our payment was reported to be used for lobbying. Political contributions The board of directors has authorized ExxonMobil to make political contributions to candidate committees and other political organizations, as permitted by applicable laws in the United States and Canada. The board annually reviews ExxonMobil’s political contributions, as well as contributions from the company-sponsored Political Action Committee (PAC). Internal audits of the corporation’s public and government affairs activities routinely verify contribution amounts. Eligible employees and shareholders may participate in the U.S. political process by contributing to a voluntary, company sponsored, federal PAC. ExxonMobil reports PAC contributions to the U.S. Federal Election Commission every month. In 2019, we contributed more than $253,000 to state candidates and caucuses in eight U.S. states. During 2019, ExxonMobil’s PAC disbursed more than $719,000 to federal and state candidates and committees. 1 Corporate political contributions are subject to an internal review process that requires approval from the chairman. 33 | Sustainability Report Highlights
Case study: COVID-19 response ExxonMobil volunteers worldwide helped distribute food to local communities affected by the COVID-19 pandemic. 34 | Sustainability Report Highlights
As a large, multinational corporation with operations in nearly 50 countries worldwide, ExxonMobil was well positioned to offer assistance to communities around the world when the COVID-19 pandemic rapidly began spreading in early 2020. At the same time, it was important for us to keep our employees and contractors safe, while also continuing to ensure we were providing essential energy and chemical products. The men and women of ExxonMobil responded, playing an important role in the global effort to combat the virus. We leveraged our leadership in technology and manufacturing, coupled with our culture of ingenuity and care for our people and the communities where we work. Protecting our workforce’s health and safety while maintaining critical operations On our offshore platforms, in our refineries, at our lubricants and chemical plants, and throughout our facilities worldwide, our employees and contractors safely maintained critical operations. In the earliest days of the pandemic, we activated emergency response teams and implemented business continuity plans, building on lessons learned from previous pandemics such as SARS and Ebola. ExxonMobil has comprehensive procedures and processes that we activate to respond to emergency events. Certain aspects of our operations function 24/7. The COVID-19 pandemic presented unique and challenging circumstances, since some operations entail working and living in close proximity to others. Many of our employees and contractors spent months at work, quarantined and isolated from their families, in order to deliver the energy and products that are essential to society. At our offshore facilities, we worked with local governments as needed to manage rotational crew changes safely, including chartering flights while international airports remained closed. Our preventive and mitigation safeguards, combined with coordinated internal communications, helped protect the health and safety of our workers and their dependents. Enhanced cleaning and distancing protocols were put in place at offices and facilities, and additional personal protective equipment was provided to employees. We continued to refine these measures in consultation with internal and external health experts as new information about the virus became available. To address the personal needs of employees, we deployed our workplace flexibility programs, childcare and elder care referral services, school-transition support and peer-to-peer connection networks. We also sought to help our customers at Exxon-, Mobil- and Esso-branded service stations. For example, in the United States and Canada, we advised our wholesalers, retailers and their service station personnel on more frequent cleaning and sanitizing of sites – from fuel nozzles to store countertops to door handles. Further, we encouraged consumers to use mobile payment options through our Exxon Mobil Rewards+™ app to reduce contact with surfaces at the pumps. 35 | Sustainability Report Highlights Case study: COVID-19 response Mobil-branded service stations in Thailand provided masks and hand sanitizer in response to COVID-19.
Case study: COVID-19 response ExxonMobil donated hand sanitizer and personal protective equipment to first responders around the world. 36 | Sustainability Report Highlights Supporting emergency responders and medical personnel By mid-April 2020, the need for medical masks, hospital gowns and other medical equipment and packaging had increased significantly. We answered this demand by increasing our manufacturing capability of specialized polypropylene at facilities in Louisiana, Texas and Singapore to enable production of hundreds of millions of masks and tens of millions of gowns each month. At the same time, we boosted production and supply of isopropyl alcohol – a key ingredient in many disinfectant products – to enable production of millions of bottles of hand sanitizer. We provided thousands of gallons of isopropyl alcohol to make urgently needed disinfectant for the U.S. Transportation Security Administration to protect its officers and passengers in airports across the United States. We also answered a request from New York state officials who needed large quantities of isopropyl alcohol to make hand sanitizer for emergency responders, primary care health professionals, senior health centers and others. We made similar donations of isopropyl alcohol and specialty polypropylene and polyethylene in other countries. We did our best to meet growing demand from the private sector as well. For example, we provided isopropyl alcohol to E.T. Browne, a small, family-owned business best known for its Palmer’s® personal care products, when it decided to repurpose its Pennsylvania factory to make medical-grade hand sanitizer for the U.S. military and medical first responders. In late April, we went beyond production by temporarily reconfiguring manufacturing operations at our Louisiana facilities to enable us to produce, blend, package and distribute hand sanitizer. The Federal Emergency Management Agency distributed these supplies amongst organizations supporting COVID-19 first responders across the United States. Additionally, we deployed our technical and logistical expertise to help solve problems associated with shortages of personal protective equipment, which typically can only be used for short periods before having to be replaced. We collaborated with the Association of the Nonwoven Fabrics Industry and contributed technical and product application expertise to help support the development of masks and face shields to protect first responders, medical caregivers and the general public in their return to work.
Case study: COVID-19 response During the COVID-19 pandemic, our employees worked safely to help keep vital energy and products flowing, including isopropyl alcohol, a key ingredient in many disinfectant products. 37 | Sustainability Report Highlights Helping our communities We complemented these efforts by helping our local communities. In the greater Houston area – home to more than 10,000 ExxonMobil personnel – we supported food banks, hospitals, police and firefighters. We also partnered with the Texas Restaurant Association to support hard-hit, local restaurants preparing thousands of meals for donation to frontline workers. In the Permian region in West Texas and New Mexico, we provided assistance to local food banks, as well as to the Carlsbad, New Mexico, Municipal School District to support technology improvements for online education. Similar efforts were undertaken in communities across the United States where ExxonMobil employees live and work. Outside of the United States, many affiliates and employees around the world contributed money, technical equipment, fuel, isopropyl alcohol, specialty products and logistics assistance to support local COVID-19 relief work. For example, in Canada, our affiliate Imperial Oil Limited offered 80,000 Esso and Mobil fuel vouchers worth $2 million to frontline nurses, paramedics and doctors as part of its Heroes Campaign. Our India affiliate partnered with United Way Mumbai to deliver protective gear to hospitals in Mumbai, Delhi and Bangalore. In China, we provided lubricants needed for ambulances and the construction of hospitals, along with tens of thousands of masks and protective suits. In Belgium, we provided monetary support to major clinical trial efforts at University Hospital Antwerp and University Hospital Leuven, which researched potential treatments and a vaccine for COVID-19. We also worked with authorities to help slow the spread of COVID-19. In Papua New Guinea, for instance, we offered our network of more than 50 Village Liaison Officers to help government health officials provide information in remote areas where the company operates. These Village Liaison Officers – typically clan leaders or councilors who inform community members about our activities and hear local concerns – helped raise awareness of COVID-19 prevention and safety measures, as well as how to implement proper social distancing. Our work to support the response to the COVID-19 pandemic was part of our long-standing commitment to safeguarding the health and security of our employees and the public, and to supporting the needs of the communities in which we live and work – a commitment we have embraced throughout our company’s history.
The Sustainability Report Highlights summarizes ExxonMobil’s approach to managing our operations and describes our environmental, social and governance performance. This report focuses on 10 key topics for our business. For further information on all topics that are important to ExxonMobil, please visit our website . We developed this year’s report in accordance with the reporting guidelines and indicators of IPIECA, the global oil and gas industry association for advancing environmental and social issues, the International Association of Oil and Gas Producers (IOGP) and the American Petroleum Institute (API). This report focuses primarily on ExxonMobil’s operations from January 1, 2019, through December 31, 2019, unless otherwise indicated, since full-year 2020 data were not available at the time of publication. This report uses qualitative descriptions and quantitative metrics to describe our policies, programs, practices and performance. Many of the standards and metrics used in preparing this report continue to evolve and are based on management assumptions believed to be reasonable at the time of preparation, but should not be considered guarantees. Materiality assessment Consistent with IPIECA’s Oil and Gas Industry Guidance on Voluntary Sustainability Reporting, ExxonMobil began conducting annual “materiality assessments” in 2006 to identify environmental, social and governance issues of particular interest to our stakeholders and to ensure our analysis reflects events and changing business priorities. The results of our assessment help inform the development of this report. Read more about our materiality assessment . We list the material issues for the full Sustainability Report below. For the purposes of this report, the concept of “material issues” refers to IPIECA reporting guidance on potential disclosures and does not correspond to the concept of materiality used in the securities laws and disclosures required by U.S. Securities and Exchange Commission rules. Visit our content index for a detailed mapping of the locations of information regarding these issues. ENVIRONMENT • Environmental management system • Engaging on climate change policy • Managing climate change risks • Developing innovative products and technology • Managing impacts on air and water • Plastic waste management • Spill performance • Biodiversity and ecosystem services SOCIAL • Safety • Workplace security • Community investments • Working with local communities • Human rights • Supply chain management • Healthy and engaged workforce GOVERNANCE • Ethics and integrity • Board leadership • Engaging with governments • Shareholder relations About the Sustainability Report Highlights More about this report Additional resources Energy & Carbon Summary Energy Factor Summary Annual Report The Outlook for Energy Explore our online Sustainability Report exxonmobil.com/sustainabilityreport Content index exxonmobil.com/contentindex Report archive exxonmobil.com/sustainabilityreportarchive 38 | Sustainability Report Highlights
We assess our performance to support continual improvements throughout the company. Since 2011, performance data include XTO Energy information. In 2014, we started reporting our data over a 10-year period to demonstrate trends over time as part of our commitment to transparency. The reporting guidelines and indicators of IPIECA, the International Oil and Gas Producers Association and the American Petroleum Institute Oil and Gas Industry Guidance on Voluntary Sustainability Reporting (2015) informed which data we included in the performance table. For additional information on our sustainability reporting, please visit our content index . Performance data 3 Greenhouse gas emissions, absolute (net equity, CO 2 -equivalent emissions), millions of metric tons 4 Direct (excluding emissions from exported power and heat) 5 Emissions associated with imported power CO 2 (excluding emissions from exported power and heat) Methane (CO 2 -equivalent) Other gases (CO 2 -equivalent) Emissions from exported power and heat By-region greenhouse gas emissions (net equity, CO 2 -equivalent emissions), millions of metric tons Africa/Europe/Middle East Americas Asia Pacific By-division greenhouse gas emissions (net equity, CO 2 -equivalent emissions), millions of metric tons Upstream Downstream Chemical 3 Greenhouse gas emissions, normalized (net equity, CO 2 -equivalent emissions), metric tons per 100 metric tons of throughput or production Upstream Downstream Chemical 126 117 9 122 3 1 13 45 64 17 50 55 21 20.5 20.8 57.9 2019 128 119 9 124 3 1 15 45 66 17 54 54 20 20.7 20.0 57.2 2010 126 118 8 120 5 1 15 44 68 14 56 51 19 22.3 19.6 56.3 2011 127 119 8 119 7 1 16 44 70 13 58 49 20 23.2 19.7 57.9 2012 124 116 8 116 7 1 8 43 66 15 56 47 21 24.0 19.2 54.5 2013 120 111 9 114 6 <1 3 37 66 17 55 42 23 25.4 19.1 52.8 2014 122 114 8 115 6 1 4 44 65 13 56 45 21 25.7 18.9 54.8 2015 125 117 8 117 7 1 3 45 64 16 59 45 21 26.3 19.4 53.9 2016 123 115 8 116 7 <1 3 43 64 16 58 43 22 26.3 18.6 54.2 124 116 8 117 7 <1 3 42 63 19 58 42 24 26.8 18.6 55.5 2017 2018 Environment 2 39 | Sustainability Report Highlights
Energy use (billion gigajoules) Upstream (gigajoules per metric tons production) Downstream (gigajoules per metric tons throughput) Chemical (gigajoules per metric tons product) 6 - Hydrocarbon flaring (worldwide activities), millions of standard cubic feet per day 7 Cogeneration capacity in which we have interest, gigawatts Freshwater withdrawn, millions of cubic meters Freshwater consumption, millions of cubic meters Freshwater intensity, metric tons of water consumed per metric tons of throughput or production Upstream Downstream Chemical Marine vessel spills (owned and long-term leased), number of hydrocarbon spills > 1 barrel Spills (not from marine vessels), number of oil, chemical and drilling fluid spills > 1 barrel Hydrocarbons spilled (oil spilled), thousands of barrels Other spills, thousands of barrels Controlled hydrocarbon discharges to water, thousands of metric tons Upstream Downstream Sulfur dioxide (SO 2 ) emitted, millions of metric tons Nitrogen oxides (NO x ) emitted, millions of metric tons Volatile organic compounds (VOCs) emitted, millions of metric tons Environmental expenditures, billions of dollars Total dollars spent on environmental penalties, fines and settlements, billions of dollars Total hazardous waste disposed from remediation, millions of metric tons 8 Total hazardous waste disposed from operations, millions of metric tons 1.5 2.0 3.0 9.5 380 4.9 N/A 330 0.1 0.9 2.4 0 210 7.7 40.4 1.3 1.1 0.2 0.14 0.12 0.17 4.5 0.011 0.6 1.3 2019 2010 1.5 2.0 3.0 11.4 430 5.0 540 370 0.3 0.9 2.6 0 484 17.8 2.0 1.3 1.1 0.2 0.13 0.15 0.18 4.9 0.003 1.3 1.9 2011 1.5 2.0 3.0 12.0 380 5.2 520 330 0.3 0.8 2.4 0 356 8.5 1.6 1.2 1.0 0.2 0.13 0.14 0.15 5.5 0.004 1.7 2.0 2012 1.4 2.1 3.0 10.9 390 5.3 420 280 0.2 0.7 2.0 0 332 9.3 0.9 1.1 1.0 0.1 0.12 0.14 0.15 6.0 0.002 1.1 0.3 2013 1.4 2.3 2.9 10.7 470 5.5 420 270 0.2 0.7 1.8 0 337 9.1 4.1 1.3 1.2 0.1 0.10 0.14 0.16 6.2 0.015 1.0 0.3 2014 1.5 2.4 2.9 10.9 570 5.5 450 300 0.4 0.7 1.8 0 321 10.8 0.4 1.1 1.0 0.1 0.11 0.14 0.16 5.7 0.006 1.4 0.2 2015 1.5 2.4 2.9 10.6 530 5.3 430 280 0.3 0.8 1.8 0 220 4.7 3.7 1.1 1.0 0.1 0.11 0.13 0.15 4.9 0.006 1.4 0.1 2016 1.4 2.5 2.9 10.5 410 5.4 440 290 0.3 0.8 1.8 0 204 6.9 1.8 1.7 1.6 0.1 0.10 0.12 0.14 4.7 0.001 1.5 0.2 1.5 2.5 3.0 10.0 410 5.4 470 310 0.5 0.7 1.8 0 334 11.3 0.8 0.8 0.7 0.1 0.10 0.12 0.16 4.9 0.001 1.1 0.2 1.5 2.5 3.0 10.0 430 5.4 460 290 0.5 0.7 1.8 0 352 7.5 0.6 0.7 0.5 0.1 0.09 0.12 0.15 5.2 <0.001 1.4 0.2 2017 2018 Performance data 40 | Sustainability Report Highlights Environment CONTINUED 2
2019 2010 2011 2012 2013 2014 2015 2016 2017 2018 Fatalities — employees Fatalities — contractors 9 Fatal accident rate — total workforce (per 1,000,000 work hours) 9 Fatal incident rate — total workforce (per 1,000,000 work hours) 10 Lost-time incident rate — employees (per 200,000 work hours) 10 Lost-time incident rate — contractors (per 200,000 work hours) 10 Lost-time incident rate — total workforce (per 200,000 work hours) 10 Total recordable incident rate — employees (per 200,000 work hours) 10 Total recordable incident rate — contractors (per 200,000 work hours) 10 Total recordable incident rate — total workforce (per 200,000 work hours) Tier 1 Process Safety Event rate (API RP 754 guidance, per 200,000 work hours) 11 Number of regular employees at year end, thousands 11 Percent of workforce — non-U.S. 11 Percent women — global workforce Percent management and professional new hires — women Percent management and professional new hires — non-U.S. Number of employee participants in corporate and technical training, thousands Total corporate and technical training expenditures, millions of dollars 12 Community investments, millions of dollars United States Rest of world 13 ExxonMobil spending with U.S. diverse suppliers, millions of dollars ExxonMobil spending with U.S. certified, tier 1, diverse suppliers, millions of dollars 0 1 0.002 0.002 0.031 0.034 0.033 0.15 0.25 0.21 0.049 75 60 29 37 65 88 77 252.5 117.4 135.1 2,727 643 0 3 0.006 0.006 0.048 0.031 0.038 0.25 0.34 0.30 0.041 84 60 26 40 70 61 77 237.1 154.8 82.3 841 0 9 0.017 0.017 0.064 0.086 0.077 0.30 0.41 0.37 0.043 82 61 26 44 79 65 80 278.4 161.3 117.1 1,068 1 4 0.009 0.009 0.041 0.049 0.046 0.25 0.37 0.33 0.038 77 59 28 39 68 76 88 255.6 156.5 99.1 1,001 0 6 0.011 0.009 0.051 0.041 0.044 0.22 0.32 0.29 0.036 75 59 28 39 66 87 96 269.5 156.3 113.2 1,024 0 3 0.006 0.006 0.032 0.031 0.031 0.19 0.29 0.26 0.04 75 58 28 40 61 79 117 279.5 150.2 129.3 1,108 0 2 0.004 0.004 0.045 0.029 0.035 0.21 0.26 0.24 0.051 73 59 28 41 61 85 124 272.3 145.5 126.8 1,064 0 3 0.008 0.008 0.027 0.030 0.029 0.16 0.23 0.20 0.055 71 59 28 44 74 83 108 241.5 131.1 110.4 1,442 0 2 0.005 0.005 0.034 0.027 0.030 0.15 0.23 0.19 0.051 70 60 28 41 67 98 94 204.0 125.3 78.7 1,902 0 3 0.007 0.007 0.037 0.031 0.033 0.14 0.26 0.21 0.054 71 60 29 37 62 87 62 211.0 112.0 99.0 2,267 14 Number of Extractive Industries Transparency Initiative (EITI) participating countries Corporate political contributions — U.S. state campaigns and national 527s, millions of dollars Percent of shares represented at Corporation’s Annual Meeting 7 1.10 80.7 7 0.51 81.9 7 1.03 83.0 9 0.70 82.3 10 1.17 82.9 11 0.58 83.9 15 0.52 85.1 18 0.51 85.7 19 0.62 85.5 21 1.13 86.7 Social Governance Performance data 41 | Sustainability Report Highlights
Footnotes † Natural gas converted to oil-equivalent barrels using 6 million cubic feet per 1,000 barrels. ‡ Sales data reported net of purchases/sales contracts with the same counterparty. 1 Totals may not reflect some candidates’ failure to deposit, or returned contributions not yet posted. 2 ExxonMobil-operated emission estimates are based on a combination of measured and estimated emissions data using best available information. Our calculations are based on industry standards and best practices, including guidance from the American Petroleum Institute (API) and IPIECA. The uncertainty associated with the emission estimates depends on variation in the processes and operations, the availability of sufficient data, the quality of those data and methodology used for measurement and estimation. Changes to the estimates may be reported as updated data and/or emission methodologies become available. We work with industry, including API and IPIECA, to improve emission factors and methodologies. Emission estimates from non-ExxonMobil-operated facilities are included in the equity data. The data include XTO Energy performance beginning in 2011. 3 The net equity greenhouse gas emissions metric was introduced in 2011 as a replacement for the direct equity greenhouse gas metric. Information has been restated back to 2010 according to the new metric. The net equity greenhouse gas metric includes direct and imported greenhouse gas emissions and excludes emissions from exports (including Hong Kong Power through mid-2014). ExxonMobil reports greenhouse gas emissions on a net equity basis for all our business operations, reflecting our percent ownership in an asset. 4 The addition of direct emissions and emissions associated with exported power and heat is equivalent to World Resources Institute (WRI) Scope 1. 5 These emissions are equivalent to WRI Scope 2. 6 Flaring increased in 2019 due to start-up of growth projects in the Upstream and as a result of implementing measures to comply with new regulatory requirements in Downstream and Chemical manufacturing. We anticipate meeting our 2020 flaring reduction target. 7 Cumulative figure. 8 The value for hazardous waste from ongoing operations includes produced water classified as hazardous waste by one local authority, which is approximately 80-95 percent of the reported figure in 2010-2012. 9 Workforce includes employees and contractors. Accidents or incidents include both injuries and illnesses. From 2010 through 2019, all fatalities were injury-related. 10 Incidents include injuries and illnesses. Safety data are based on information at the time of publication. Workforce includes employees and contractors. 11 Regular employees are defined as active executive, management, professional, technical and wage employees who work full-time or part-time for ExxonMobil and are covered by ExxonMobil’s benefit plans and programs. Employees at our company-operated retail stores are not included. 12 Total contributions include donations from ExxonMobil Corporation, our divisions and affiliates, the ExxonMobil Foundation, as well as employee and retiree giving through ExxonMobil’s matching gift and volunteer programs. 13 Beginning in 2015, our spending encompassed an expanded set of diverse classifications that includes: minority-owned businesses, women-owned businesses, small business-owned, lesbian-, gay-, bisexual- and transgender- owned businesses, veteran-owned businesses, service-disabled veteran-owned businesses and businesses owned by peoples with disabilities. Prior to 2014, spending included minority- and women-owned businesses. 14 In countries where ExxonMobil has an upstream business presence. N/A is used to indicate that data are not available. 42 | Sustainability Report Highlights
Exxon Mobil Corporation Corporate Headquarters 5959 Las Colinas Blvd. Irving, Texas 75039-2298 exxonmobil.com Explore our online Sustainability Report at exxonmobil.com/sustainabilityreport . ON THE COVER In response to the COVID-19 pandemic, ExxonMobil temporarily reconfigured manufacturing operations in Louisiana to produce, blend, package and distribute hand sanitizer.