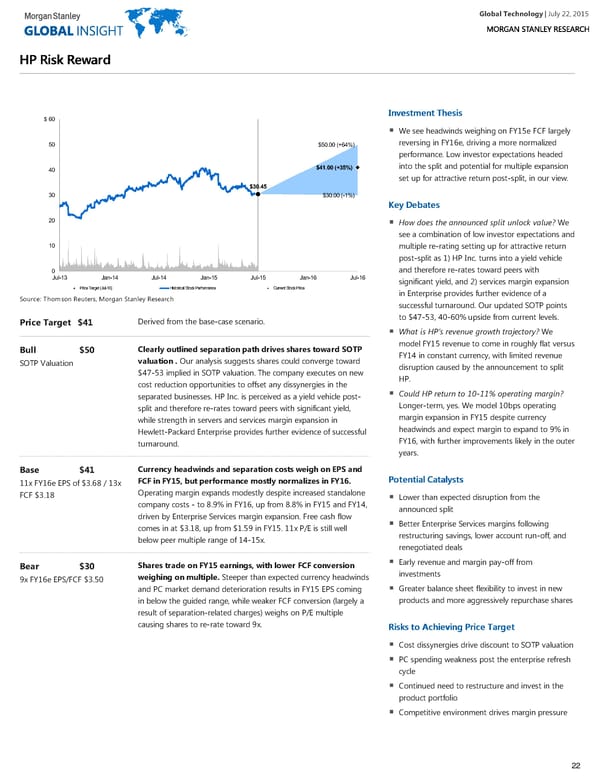
Global Technology| July 22, 2015 HHPP RRiisskk RReewwaarrdd IInnvveessttmmeenntt TThheessiiss $ 60 We see headwinds weighing on FY15e FCF largely reversing in FY16e, driving a more normalized 50 $50.00 (+64%) performance. Low investor expectations headed into the split and potential for multiple expansion $41.00 (+35%) 40 set up for attractive return post-split, in our view. $30.45 30 $30.00 (-1%) KKeeyy DDeebbaatteess 20 How does the announced split unlock value? We see a combination of low investor expectations and 10 multiple re-rating setting up for attractive return post-split as 1) HP Inc. turns into a yield vehicle and therefore re-rates toward peers with 0 Jul-13 Jan-14 Jul-14 Jan-15 Jul-15 Jan-16 Jul-16 significant yield, and 2) services margin expansion Price Target (Jul-16) Historical Stock Performance Current Stock Price WARNINGDONOTEDIT_RRS4RL~HPQ.N~ in Enterprise provides further evidence of a Source: Thomson Reuters, Morgan Stanley Research successful turnaround. Our updated SOTP points to $47-53, 40-60% upside from current levels. Derived from the base-case scenario. Price Target $41 What is HP’s revenue growth trajectory? We model FY15 revenue to come in roughly flat versus Clearly outlined separation path drives shares toward SOTP Bull $50 FY14 in constant currency, with limited revenue valuation . Our analysis suggests shares could converge toward SOTP Valuation disruption caused by the announcement to split $47-53 implied in SOTP valuation. The company executes on new HP. cost reduction opportunities to offset any dissynergies in the Could HP return to 10-11% operating margin? separated businesses. HP Inc. is perceived as a yield vehicle post- Longer-term, yes. We model 10bps operating split and therefore re-rates toward peers with significant yield, margin expansion in FY15 despite currency while strength in servers and services margin expansion in headwinds and expect margin to expand to 9% in Hewlett-Packard Enterprise provides further evidence of successful FY16, with further improvements likely in the outer turnaround. years. Currency headwinds and separation costs weigh on EPS and Base $41 PPootteennttiiaall CCaattaallyyssttss FCF in FY15, but performance mostly normalizes in FY16. 11x FY16e EPS of $3.68 / 13x Operating margin expands modestly despite increased standalone FCF $3.18 Lower than expected disruption from the company costs - to 8.9% in FY16, up from 8.8% in FY15 and FY14, announced split driven by Enterprise Services margin expansion. Free cash flow Better Enterprise Services margins following comes in at $3.18, up from $1.59 in FY15. 11x P/E is still well restructuring savings, lower account run-off, and below peer multiple range of 14-15x. renegotiated deals Early revenue and margin pay-off from Shares trade on FY15 earnings, with lower FCF conversion Bear $30 investments weighing on multiple. Steeper than expected currency headwinds 9x FY16e EPS/FCF $3.50 Greater balance sheet flexibility to invest in new and PC market demand deterioration results in FY15 EPS coming products and more aggressively repurchase shares in below the guided range, while weaker FCF conversion (largely a result of separation-related charges) weighs on P/E multiple causing shares to re-rate toward 9x. RRiisskkss ttoo AAcchhiieevviinngg PPrriiccee TTaarrggeett Cost dissynergies drive discount to SOTP valuation PC spending weakness post the enterprise refresh cycle Continued need to restructure and invest in the product portfolio Competitive environment drives margin pressure 22
 Global Technology Page 21 Page 23