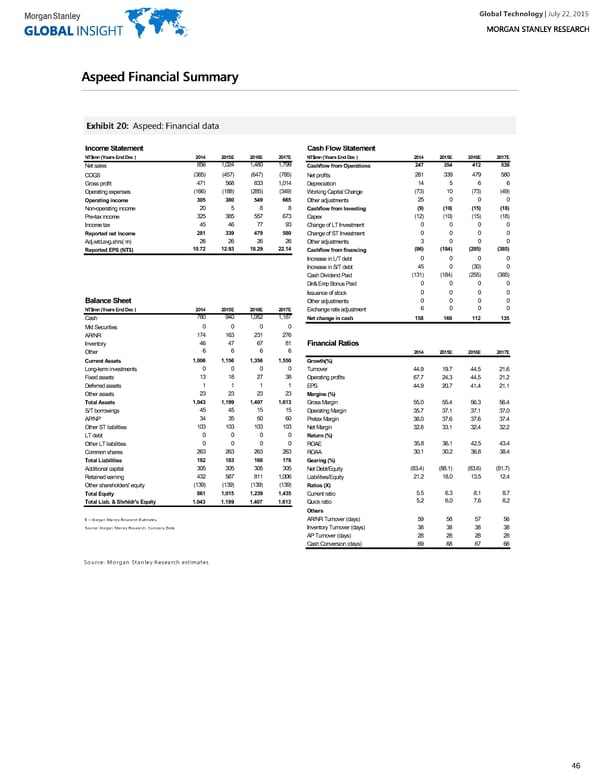
Global Technology| July 22, 2015 AAssppeeeedd FFiinnaanncciiaall SSuummmmaarryy EExxhhiibbiitt 2200:: Aspeed: Financial data Income Statement Cash Flow Statement NT$mn (Years End Dec ) 2014 2015E 2016E 2017E NT$mn (Years End Dec ) 2014 2015E 2016E 2017E 856 1,024 1,480 1,799 247 354 412 538 Net sales Cashflow from Operations (385) (457) (647) (785) 281 339 479 580 COGS Net profits 471 568 833 1,014 14 5 6 6 Gross profit Depreciation (166) (188) (285) (349) (73) 10 (73) (49) Operating expenses Working Capital Change 305 380 549 665 25 0 0 0 Operating income Other adjustments 20 5 8 8 (9) (10) (15) (18) Non-operating income Cashflow from Investing 325 385 557 673 (12) (10) (15) (18) Pre-tax income Capex 45 46 77 93 0 0 0 0 Income tax Change of LT Investment 281 339 479 580 0 0 0 0 Reported net Income Change of ST Investment 26 26 26 26 3 0 0 0 Adj.wtd.avg.shrs( m) Other adjustments 10.72 12.93 18.29 22.14 (86) (184) (285) (385) Reported EPS (NT$) Cashflow from financing 0 0 0 0 Increase in L/T debt 45 0 (30) 0 Increase in S/T debt (131) (184) (255) (385) Cash Dividend Paid 0 0 0 0 Dir& Emp Bonus Paid 0 0 0 0 Issuance of stock 0 0 0 0 Balance Sheet Other adjustments 6 0 0 0 NT$mn (Years End Dec ) 2014 2015E 2016E 2017E Exchange rate adjustment 780 940 1,052 1,187 Cash Net change in cash 158 160 112 135 0 0 0 0 Mkt Securities 174 163 231 276 AR/NR 46 47 67 81 Inventory Financial Ratios 6 6 6 6 Other 2014 2015E 2016E 2017E 1,006 1,156 1,356 1,550 Current Assets Growth(%) 0 0 0 0 Long-term investments Turnover 44.9 19.7 44.5 21.6 13 18 27 38 Fixed assets Operating profits 67.7 24.3 44.5 21.2 1 1 1 1 Deferred assets EPS 44.9 20.7 41.4 21.1 23 23 23 23 Other assets Margins (%) 1,043 1,199 1,407 1,613 Total Assets Gross Margin 55.0 55.4 56.3 56.4 45 45 15 15 S/T borrowings Operating Margin 35.7 37.1 37.1 37.0 34 35 50 60 AP/NP Pretax Margin 38.0 37.6 37.6 37.4 103 103 103 103 Other ST liabilities Net Margin 32.8 33.1 32.4 32.2 0 0 0 0 LT debt Return (%) 0 0 0 0 35.8 36.1 42.5 43.4 Other LT liabilities ROAE 263 263 263 263 30.1 30.2 36.8 38.4 Common shares ROAA 182 183 168 178 Total Liabilities Gearing (%) 305 305 305 305 (83.4) (88.1) (83.6) (81.7) Additional capital Net Debt/Equity 432 587 811 1,006 21.2 18.0 13.5 12.4 Retained earning Liabilities/Equity (139) (139) (139) (139) Other shareholders' equity Ratios (X) 861 1,015 1,239 1,435 5.5 6.3 8.1 8.7 Total Equity Current ratio 5.2 6.0 7.6 8.2 Total Liab. & Shrhldr's Equity 1,043 1,199 1,407 1,613 Quick ratio Others E = Morgan Stanley Research Estimates AR/NR Turnover (days) 59 58 57 56 Source: Morgan Stanley Research, Company Data Inventory Turnover (days) 38 38 38 38 AP Turnover (days) 28 28 28 28 Cash Conversion (days) 69 68 67 66 Source: Morgan Stanley Research estimates 46
 Global Technology Page 45 Page 47