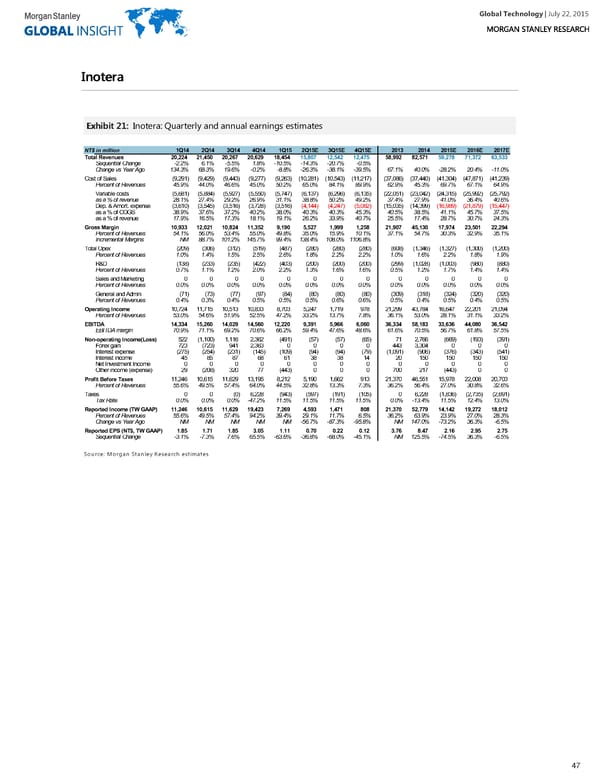
Global Technology| July 22, 2015 IInnootteerraa EExxhhiibbiitt 2211:: Inotera: Quarterly and annual earnings estimates NT$ in million 1Q14 2Q14 3Q14 4Q14 1Q15 2Q15E 3Q15E 4Q15E 2013 2014 2015E 2016E 2017E Total Revenues 20,224 21,450 20,267 20,629 18,454 15,807 12,542 12,475 58,992 82,571 59,278 71,372 63,533 Sequential Change -2.2% 6.1% -5.5% 1.8% -10.5% -14.3% -20.7% -0.5% Change vs Year Ago 134.3% 68.3% 19.6% -0.2% -8.8% -26.3% -38.1% -39.5% 67.1% 40.0% -28.2% 20.4% -11.0% Cost of Sales (9,291) (9,429) (9,443) (9,277) (9,263) (10,281) (10,543) (11,217) (37,086) (37,440) (41,304) (47,871) (41,239) Percent of Revenues 45.9% 44.0% 46.6% 45.0% 50.2% 65.0% 84.1% 89.9% 62.9% 45.3% 69.7% 67.1% 64.9% Variable costs (5,681) (5,884) (5,927) (5,550) (5,747) (6,137) (6,296) (6,135) (22,051) (23,042) (24,315) (25,992) (25,792) as a % of revenue 28.1% 27.4% 29.2% 26.9% 31.1% 38.8% 50.2% 49.2% 37.4% 27.9% 41.0% 36.4% 40.6% Dep. & Amort. expense (3,610) (3,545) (3,516) (3,728) (3,516) (4,144) (4,247) (5,082) (15,035) (14,399) (16,989) (21,879) (15,447) as a % of COGS 38.9% 37.6% 37.2% 40.2% 38.0% 40.3% 40.3% 45.3% 40.5% 38.5% 41.1% 45.7% 37.5% as a % of revenue 17.9% 16.5% 17.3% 18.1% 19.1% 26.2% 33.9% 40.7% 25.5% 17.4% 28.7% 30.7% 24.3% Gross Margin 10,933 12,021 10,824 11,352 9,190 5,527 1,999 1,258 21,907 45,130 17,974 23,501 22,294 Percent of Revenues 54.1% 56.0% 53.4% 55.0% 49.8% 35.0% 15.9% 10.1% 37.1% 54.7% 30.3% 32.9% 35.1% Incremental Margins NM 88.7% 101.2% 145.7% 99.4% 138.4% 108.0% 1106.8% Total Opex (209) (306) (312) (519) (487) (280) (280) (280) (608) (1,346) (1,327) (1,300) (1,200) Percent of Revenues 1.0% 1.4% 1.5% 2.5% 2.6% 1.8% 2.2% 2.2% 1.0% 1.6% 2.2% 1.8% 1.9% R&D (138) (233) (235) (422) (403) (200) (200) (200) (299) (1,028) (1,003) (980) (880) Percent of Revenues 0.7% 1.1% 1.2% 2.0% 2.2% 1.3% 1.6% 1.6% 0.5% 1.2% 1.7% 1.4% 1.4% Sales and Marketing 0 0 0 0 0 0 0 0 0 0 0 0 0 Percent of Revenues 0.0% 0.0% 0.0% 0.0% 0.0% 0.0% 0.0% 0.0% 0.0% 0.0% 0.0% 0.0% 0.0% General and Admin (71) (73) (77) (97) (84) (80) (80) (80) (309) (318) (324) (320) (320) Percent of Revenues 0.4% 0.3% 0.4% 0.5% 0.5% 0.5% 0.6% 0.6% 0.5% 0.4% 0.5% 0.4% 0.5% Operating Income 10,724 11,715 10,513 10,833 8,703 5,247 1,719 978 21,299 43,784 16,647 22,201 21,094 Percent of Revenues 53.0% 54.6% 51.9% 52.5% 47.2% 33.2% 13.7% 7.8% 36.1% 53.0% 28.1% 31.1% 33.2% EBITDA 14,334 15,260 14,029 14,560 12,220 9,391 5,966 6,060 36,334 58,183 33,636 44,080 36,542 EBITDA margin 70.9% 71.1% 69.2% 70.6% 66.2% 59.4% 47.6% 48.6% 61.6% 70.5% 56.7% 61.8% 57.5% Non-operating Income(Loss) 522 (1,100) 1,116 2,362 (491) (57) (57) (65) 71 2,766 (669) (193) (391) Forex gain 723 (723) 941 2,363 0 0 0 0 443 3,304 0 0 0 Interest expense (275) (254) (231) (145) (109) (94) (94) (79) (1,091) (906) (376) (343) (541) Interest income 45 85 87 68 61 38 38 14 20 150 150 150 150 Net Investment Income 0 0 0 0 0 0 0 0 0 0 0 0 0 Other income (expense) 29 (208) 320 77 (443) 0 0 0 700 217 (443) 0 0 Profit Before Taxes 11,246 10,615 11,629 13,195 8,212 5,190 1,662 913 21,370 46,551 15,978 22,008 20,703 Percent of Revenues 55.6% 49.5% 57.4% 64.0% 44.5% 32.8% 13.3% 7.3% 36.2% 56.4% 27.0% 30.8% 32.6% Taxes 0 0 (0) 6,228 (943) (597) (191) (105) 0 6,228 (1,836) (2,735) (2,691) Tax Rate 0.0% 0.0% 0.0% -47.2% 11.5% 11.5% 11.5% 11.5% 0.0% -13.4% 11.5% 12.4% 13.0% Reported Income (TW GAAP) 11,246 10,615 11,629 19,423 7,269 4,593 1,471 808 21,370 52,779 14,142 19,272 18,012 Percent of Revenues 55.6% 49.5% 57.4% 94.2% 39.4% 29.1% 11.7% 6.5% 36.2% 63.9% 23.9% 27.0% 28.3% Change vs Year Ago NM NM NM NM NM -56.7% -87.3% -95.8% NM 147.0% -73.2% 36.3% -6.5% Reported EPS (NT$, TW GAAP) 1.85 1.71 1.85 3.05 1.11 0.70 0.22 0.12 3.76 8.47 2.16 2.95 2.75 Sequential Change -3.1% -7.3% 7.6% 65.5% -63.6% -36.8% -68.0% -45.1% NM 125.5% -74.5% 36.3% -6.5% Source: Morgan Stanley Research estimates 47
 Global Technology Page 46 Page 48